***Last / Change / Volume data in this table is the closing quote data***
Symbol/Exchange
Company Name
Industry Group |
PRICE |
CHANGE
(%Change) |
Day High |
Volume
(% DAV)
(% 50 day avg vol) |
52 Wk Hi
% From Hi |
Featured
Date |
Price
Featured |
Pivot Featured |
|
Max Buy |
ABV
-
NYSE
Comp De Bebidas Adr
FOOD and BEVERAGE - Beverages - Brewers
|
$138.94
|
-0.89
-0.64% |
$141.05
|
398,214
59.58% of 50 DAV
50 DAV is 668,400
|
$143.53
-3.20%
|
6/29/2010
|
$104.74
|
PP = $109.33
|
|
MB = $114.80
|
Most Recent Note - 10/29/2010 5:38:29 PM
G - Gapped up today, rebounding after a couple of distribution days this week. Extended from a sound base, its 50 DMA line ($123.04 now) defines support.
>>> The latest Featured Stock Update with an annotated graph appeared on 10/11/2010. Click here.
View all notes |
Alert me of new notes |
CANSLIM.net Company Profile |
SEC |
Zacks Reports |
StockTalk |
News |
Chart |
Request a new note
C
A N
S L
I M


|
ARUN
-
NASDAQ
Aruba Networks Inc
COMPUTER HARDWARE - Networking andamp; Communication Dev
|
$23.06
|
+1.46
6.76% |
$23.17
|
3,173,853
122.88% of 50 DAV
50 DAV is 2,582,900
|
$22.80
1.14%
|
8/30/2010
|
$18.12
|
PP = $18.51
|
|
MB = $19.44
|
 Most Recent Note - 11/2/2010 3:04:07 PM
G - Hit a new 52-week high today with a considerable gain after a small gap up. Found great support near its 50 DMA line during its choppy 5-week consolidation near its 2007 all-time highs.
>>> The latest Featured Stock Update with an annotated graph appeared on 10/26/2010. Click here.
View all notes |
Alert me of new notes |
CANSLIM.net Company Profile |
SEC |
Zacks Reports |
StockTalk |
News |
Chart |
Request a new note
C
A N
S L
I M
|
BIDU
-
NASDAQ
Baidu Inc Ads
INTERNET - Internet Information Providers
|
$109.55
|
+2.40
2.24% |
$109.93
|
10,275,049
90.73% of 50 DAV
50 DAV is 11,324,900
|
$113.78
-3.72%
|
9/17/2010
|
$85.73
|
PP = $88.42
|
|
MB = $92.84
|
Most Recent Note - 11/2/2010 4:49:55 PM
G - Gain today halted a streak of 3 consecutive losses. Consolidating after gains with above average volume for all-time highs. Extended from a sound base pattern, the nearest support is recent chart lows near $95-96 which come into play near its 50 DMA line.
>>> The latest Featured Stock Update with an annotated graph appeared on 10/7/2010. Click here.
View all notes |
Alert me of new notes |
CANSLIM.net Company Profile |
SEC |
Zacks Reports |
StockTalk |
News |
Chart |
Request a new note
C
A N
S L
I M
|
CACC
-
NASDAQ
Credit Acceptance Corp
FINANCIAL SERVICES - Credit Services
|
$58.01
|
-0.22
-0.38% |
$59.63
|
18,521
69.11% of 50 DAV
50 DAV is 26,800
|
$63.45
-8.57%
|
7/29/2010
|
$52.04
|
PP = $54.07
|
|
MB = $56.77
|
Most Recent Note - 11/2/2010 2:49:45 PM
G - Reported earnings +26% on +11% sales revenues for the quarter ended September 30, 2010. Its 50 DMA line has acted as stubborn resistance in recent weeks while volume totals have been cooling. Its $55.07 low (on 10/04/10) defines the nearest chart support level to watch above its long ago chart highs ($53.97).
>>> The latest Featured Stock Update with an annotated graph appeared on 10/29/2010. Click here.
View all notes |
Alert me of new notes |
CANSLIM.net Company Profile |
SEC |
Zacks Reports |
StockTalk |
News |
Chart |
Request a new note
C
A N
S L
I M
|
CMG
-
NYSE
Chipotle Mexican Grill
LEISURE - Restaurants
|
$215.21
|
+4.13
1.96% |
$215.21
|
576,669
75.92% of 50 DAV
50 DAV is 759,600
|
$215.38
-0.08%
|
9/1/2010
|
$158.31
|
PP = $155.52
|
|
MB = $163.30
|
Most Recent Note - 11/2/2010 2:59:39 PM
G - Still holding its ground stubbornly after big volume driven gains on 10/22/10 and 10/26/10 to new new all-time highs. It is extended from a sound base. Its 50 DMA line defines chart support above its prior highs in the $155 area.
>>> The latest Featured Stock Update with an annotated graph appeared on 10/28/2010. Click here.
View all notes |
Alert me of new notes |
CANSLIM.net Company Profile |
SEC |
Zacks Reports |
StockTalk |
News |
Chart |
Request a new note
C
A N
S L
I M
|
Symbol/Exchange
Company Name
Industry Group |
PRICE |
CHANGE
(%Change) |
Day High |
Volume
(% DAV)
(% 50 day avg vol) |
52 Wk Hi
% From Hi |
Featured
Date |
Price
Featured |
Pivot Featured |
|
Max Buy |
CTRP
-
NASDAQ
Ctrip.Com Intl Ltd Adr
LEISURE - Resorts and Casinos
|
$52.16
|
+0.04
0.07% |
$52.56
|
2,735,828
163.93% of 50 DAV
50 DAV is 1,668,900
|
$53.16
-1.89%
|
9/24/2010
|
$46.75
|
PP = $47.11
|
|
MB = $49.47
|
Most Recent Note - 11/1/2010 4:15:09 PM
G - Closed near the session low today with a small gain with slightly above average volume for a new high close. Prior highs in the $47 area define support to watch above its 50 DMA line.
>>> The latest Featured Stock Update with an annotated graph appeared on 9/28/2010. Click here.
View all notes |
Alert me of new notes |
CANSLIM.net Company Profile |
SEC |
Zacks Reports |
StockTalk |
News |
Chart |
Request a new note
C
A N
S L
I M
|
DECK
-
NASDAQ
Deckers Outdoor Corp
CONSUMER NON-DURABLES - Textile - Apparel Footwear
|
$56.75
|
+0.16
0.28% |
$57.15
|
1,042,048
100.47% of 50 DAV
50 DAV is 1,037,200
|
$58.90
-3.65%
|
10/27/2010
|
$54.16
|
PP = $54.86
|
|
MB = $57.60
|
Most Recent Note - 11/1/2010 12:25:09 PM
G - Holding its ground following a 10/29/10 breakaway gap with 4 times average volume for a new 52-week high. Reported earnings +24% on +22% sales revenues for the quarter ended September 30, 2010 versus the year ago period. The earnings increases was the smallest percentage improvement in the past 5 quarterly comparisons and borderline with the minimum (+25%) increase the investment system calls for. Color code was changed to green after quickly trading above its "max buy" level.
>>> The latest Featured Stock Update with an annotated graph appeared on 10/27/2010. Click here.
View all notes |
Alert me of new notes |
CANSLIM.net Company Profile |
SEC |
Zacks Reports |
StockTalk |
News |
Chart |
Request a new note
C
A N
S L
I M
|
EBIX
-
NASDAQ
Ebix Inc
COMPUTER SOFTWARE and SERVICES - Business Software and Services
|
$24.24
|
+0.36
1.51% |
$24.43
|
1,122,411
179.76% of 50 DAV
50 DAV is 624,400
|
$26.36
-8.04%
|
9/23/2010
|
$21.78
|
PP = $22.74
|
|
MB = $23.88
|
Most Recent Note - 11/2/2010 2:11:48 PM
G - Trading up in positive territory, rebounding after a steep early slump today toward its recent low ($22.12 on 10/26/10) and its 50 DMA line. Damaging losses leading to violations would raise concerns.
>>> The latest Featured Stock Update with an annotated graph appeared on 9/24/2010. Click here.
View all notes |
Alert me of new notes |
CANSLIM.net Company Profile |
SEC |
Zacks Reports |
StockTalk |
News |
Chart |
Request a new note
C
A N
S L
I M
|
FFIV
-
NASDAQ
F 5 Networks Inc
INTERNET - Internet Software and Services
|
$117.35
|
+0.98
0.84% |
$118.36
|
1,537,458
61.24% of 50 DAV
50 DAV is 2,510,600
|
$119.88
-2.11%
|
6/16/2010
|
$74.50
|
PP = $74.10
|
|
MB = $77.81
|
Most Recent Note - 11/2/2010 2:56:05 PM
G - Holding its ground stubbornly since a big 10/27/10 gap up. It may go on to produce more climactic gains, however it did not form a sound new base and may be considered "late stage" after its considerable rally this year.
>>> The latest Featured Stock Update with an annotated graph appeared on 9/13/2010. Click here.
View all notes |
Alert me of new notes |
CANSLIM.net Company Profile |
SEC |
Zacks Reports |
StockTalk |
News |
Chart |
Request a new note
C
A N
S L
I M
|
FOSL
-
NASDAQ
Fossil Inc
CONSUMER DURABLES - Recreational Goods, Other
|
$60.17
|
+0.91
1.54% |
$60.41
|
1,245,872
166.72% of 50 DAV
50 DAV is 747,300
|
$60.11
0.10%
|
10/20/2010
|
$54.12
|
PP = $55.61
|
|
MB = $58.39
|
Most Recent Note - 11/2/2010 12:30:06 PM
G - Small gap up today for another new high, getting more extended. Color code was changed to green after a recent streak of gains without great volume conviction. The nearby chart support level to watch is its 50 DMA line. Earnings news is due prior to the market open on Tuesday, November 9, 2010.
>>> The latest Featured Stock Update with an annotated graph appeared on 10/5/2010. Click here.
View all notes |
Alert me of new notes |
CANSLIM.net Company Profile |
SEC |
Zacks Reports |
StockTalk |
News |
Chart |
Request a new note
C
A N
S L
I M
|
Symbol/Exchange
Company Name
Industry Group |
PRICE |
CHANGE
(%Change) |
Day High |
Volume
(% DAV)
(% 50 day avg vol) |
52 Wk Hi
% From Hi |
Featured
Date |
Price
Featured |
Pivot Featured |
|
Max Buy |
HMSY
-
NASDAQ
H M S Holdings Corp
COMPUTER SOFTWARE and SERVICES - Healthcare Information Service
|
$60.23
|
+1.23
2.08% |
$60.27
|
198,958
97.24% of 50 DAV
50 DAV is 204,600
|
$62.91
-4.26%
|
9/27/2010
|
$57.97
|
PP = $58.36
|
|
MB = $61.28
|
Most Recent Note - 11/2/2010 4:52:09 PM
Y - Small gap up gain today after encouraging signs of prompt support showing up near its 50 DMA line following its latest earnings report. Color code was changed to yellow based on its impressive resilience after distributional pressure caused technical damage.
>>> The latest Featured Stock Update with an annotated graph appeared on 9/27/2010. Click here.
View all notes |
Alert me of new notes |
CANSLIM.net Company Profile |
SEC |
Zacks Reports |
StockTalk |
News |
Chart |
Request a new note
C
A N
S L
I M
|
HS
-
NYSE
Healthspring Inc
HEALTH SERVICES - Health Care Plans
|
$28.15
|
+0.23
0.82% |
$28.57
|
821,237
109.37% of 50 DAV
50 DAV is 750,900
|
$29.80
-5.54%
|
8/27/2010
|
$19.91
|
PP = $19.75
|
|
MB = $20.74
|
Most Recent Note - 11/1/2010 11:11:38 AM
G - Down today, erasing most of the prior session's gain for a new 52-week high. A "positive reversal" on 10/28/10 followed earnings news after dipping near its 50 DMA line, and the prompt support near its short-term average was impressive. Earnings were +23% with sales revenues +10% for the quarter ended September 30, 2010 versus the year ago period, marking its weakest earnings increase in 5 quarterly comparisons with a worrisome deceleration in sales revenues growth.
>>> The latest Featured Stock Update with an annotated graph appeared on 10/22/2010. Click here.
View all notes |
Alert me of new notes |
CANSLIM.net Company Profile |
SEC |
Zacks Reports |
StockTalk |
News |
Chart |
Request a new note
C
A N
S L
I M
|
IGTE
-
NASDAQ
Igate Corp
COMPUTER SOFTWARE and SERVICES - Information Technology Service
|
$20.35
|
+0.35
1.75% |
$20.35
|
865,342
162.87% of 50 DAV
50 DAV is 531,300
|
$21.10
-3.55%
|
10/26/2010
|
$17.29
|
PP = $19.55
|
|
MB = $20.53
|
Most Recent Note - 11/1/2010 12:38:50 PM
Y - Holding its ground stubbornly near its 52-week high yet below its "max buy" level. Prior chart highs in the $19 area define initial chart support above its 50 DMA line.
>>> The latest Featured Stock Update with an annotated graph appeared on 9/10/2010. Click here.
View all notes |
Alert me of new notes |
CANSLIM.net Company Profile |
SEC |
Zacks Reports |
StockTalk |
News |
Chart |
Request a new note
C
A N
S L
I M
|
JOBS
-
NASDAQ
Fifty One Job Inc Ads
DIVERSIFIED SERVICES - Staffing and; Outsourcing Service
|
$46.40
|
+0.87
1.90% |
$47.00
|
84,072
44.77% of 50 DAV
50 DAV is 187,800
|
$47.48
-2.27%
|
10/13/2010
|
$42.07
|
PP = $40.60
|
|
MB = $42.63
|
Most Recent Note - 11/1/2010 4:16:35 PM
G - Closed with a small gain today. Wider intra-day price swings have been noted as signs of uncertainty, meanwhile prior highs in the $40 area define support above its 50 DMA line.
>>> The latest Featured Stock Update with an annotated graph appeared on 9/16/2010. Click here.
View all notes |
Alert me of new notes |
CANSLIM.net Company Profile |
SEC |
Zacks Reports |
StockTalk |
News |
Chart |
Request a new note
C
A N
S L
I M
|
LULU
-
NASDAQ
Lululemon Athletica
MANUFACTURING - Textile Manufacturing
|
$44.76
|
+0.04
0.09% |
$45.77
|
497,243
40.55% of 50 DAV
50 DAV is 1,226,300
|
$48.45
-7.62%
|
10/8/2010
|
$47.66
|
PP = $46.67
|
|
MB = $49.00
|
Most Recent Note - 10/27/2010 5:17:07 PM
Y - Down today with lighter volume. Its color code was changed to yellow while hovering near old highs in the $45-46 area. Recent lows in the $42 area define support to watch above its 50 DMA line. Subsequent gains to new highs with volume would be welcomed as a confirming sign of serious institutional accumulation.
>>> The latest Featured Stock Update with an annotated graph appeared on 10/8/2010. Click here.
View all notes |
Alert me of new notes |
CANSLIM.net Company Profile |
SEC |
Zacks Reports |
StockTalk |
News |
Chart |
Request a new note
C
A N
S L
I M
|
Symbol/Exchange
Company Name
Industry Group |
PRICE |
CHANGE
(%Change) |
Day High |
Volume
(% DAV)
(% 50 day avg vol) |
52 Wk Hi
% From Hi |
Featured
Date |
Price
Featured |
Pivot Featured |
|
Max Buy |
MRX
-
NYSE
Medicis Pharmaceut Cl A
DRUGS - Biotechnology
|
$29.87
|
+0.48
1.63% |
$29.89
|
641,557
59.06% of 50 DAV
50 DAV is 1,086,200
|
$30.94
-3.46%
|
8/12/2010
|
$26.88
|
PP = $26.71
|
|
MB = $28.05
|
Most Recent Note - 11/2/2010 2:53:17 PM
G - Volume totals have been cooling while consolidating in a tight trading range just above its 50 DMA line. Reporting earnings after the market closes on Thursday, November 4, 2010. In recent weeks Medicis Pharmaceutical Corp said Genzyme Corp had sued it in a U.S. court over its wrinkle treatments, accusing patent violation. Medicis acquired exclusive U.S. and Canadian rights to the Restylane family of products through certain license agreements in March 2003. Also it amended its 2009 complaint against India's Lupin Ltd related to a copycat version of Medicis' acne treatment Solodyn, to include a newly issued patent.
>>> The latest Featured Stock Update with an annotated graph appeared on 10/4/2010. Click here.
View all notes |
Alert me of new notes |
CANSLIM.net Company Profile |
SEC |
Zacks Reports |
StockTalk |
News |
Chart |
Request a new note
C
A N
S L
I M
|
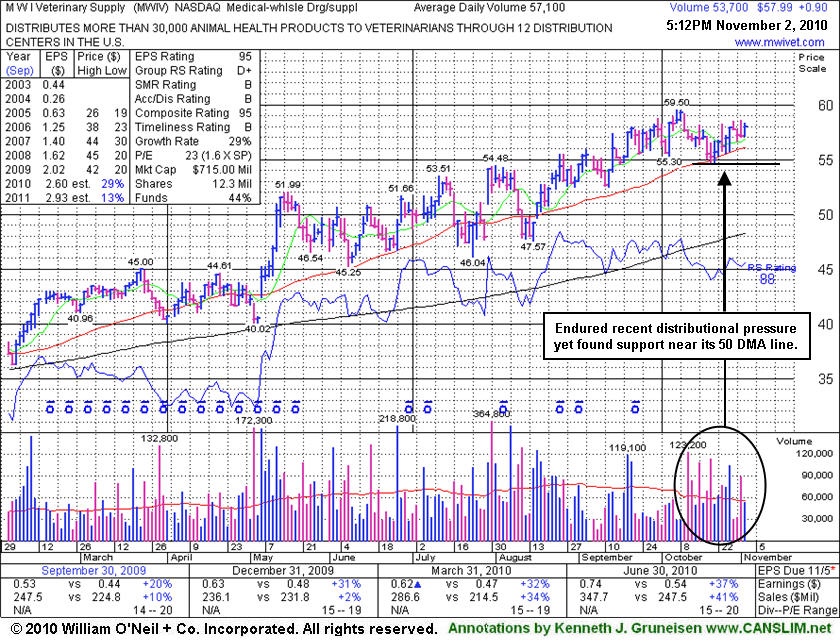
MWIV
-
NASDAQ
M W I Veterinary Supply
HEALTH SERVICES - Medical Instruments and; Supplies
|
$57.99
|
+0.90
1.58% |
$58.35
|
54,311
95.79% of 50 DAV
50 DAV is 56,700
|
$59.50
-2.54%
|
7/29/2010
|
$52.05
|
PP = $52.09
|
|
MB = $54.69
|
Most Recent Note - 11/1/2010 1:02:04 PM
G - Consolidating near its 52-week high, it recently found support near its 50 DMA line. Any subsequent violation of that classic chart support level or breach of recent lows would raise greater concerns. Due to announce earnings on Thursday, November 4, 2010.
>>> The latest Featured Stock Update with an annotated graph appeared on 11/2/2010. Click here.
View all notes |
Alert me of new notes |
CANSLIM.net Company Profile |
SEC |
Zacks Reports |
StockTalk |
News |
Chart |
Request a new note
C
A N
S L
I M
|
NEM
-
NYSE
Newmont Mining Corp
METALS and MINING - Gold
|
$59.89
|
-1.34
-2.19% |
$61.95
|
9,107,257
140.96% of 50 DAV
50 DAV is 6,461,000
|
$65.50
-8.56%
|
8/31/2010
|
$61.32
|
PP = $63.48
|
|
MB = $66.65
|
Most Recent Note - 11/2/2010 10:37:41 AM
G - Gapped up today, then reversed the early gain and promptly slumped below its 50 DMA line. That important short-term average may act as resistance, and it is now -8% off its 52-week high.
>>> The latest Featured Stock Update with an annotated graph appeared on 9/14/2010. Click here.
View all notes |
Alert me of new notes |
CANSLIM.net Company Profile |
SEC |
Zacks Reports |
StockTalk |
News |
Chart |
Request a new note
C
A N
S L
I M
|
NEOG
-
NASDAQ
Neogen Corp
DRUGS - Diagnostic Substances
|
$34.97
|
+1.54
4.61% |
$34.97
|
88,335
85.51% of 50 DAV
50 DAV is 103,300
|
$36.37
-3.85%
|
9/1/2010
|
$30.79
|
PP = $30.49
|
|
MB = $32.01
|
Most Recent Note - 11/2/2010 2:04:54 PM
Y - Color code is changed to yellow while rallying up from its 10 week moving average. It may be considered buyable up to +5% above its recent high ($36.37 plus 5%) as a secondary buy point following its earlier technical breakout, however a new pivot point is not cited because it did not form a sound new base pattern
>>> The latest Featured Stock Update with an annotated graph appeared on 10/13/2010. Click here.
View all notes |
Alert me of new notes |
CANSLIM.net Company Profile |
SEC |
Zacks Reports |
StockTalk |
News |
Chart |
Request a new note
C
A N
S L
I M
|
NFLX
-
NASDAQ
Netflix Inc
SPECIALTY RETAIL - Music and Video Stores
|
$171.61
|
+4.24
2.53% |
$173.38
|
5,454,296
99.04% of 50 DAV
50 DAV is 5,506,900
|
$184.74
-7.11%
|
8/10/2010
|
$124.05
|
PP = $124.00
|
|
MB = $130.20
|
Most Recent Note - 11/2/2010 4:48:13 PM
G - Gain today halted a streak of 3 consecutive losses. Now -7% off its 52-week high, it could go on to produce more climactic gains, but it is considered "late stage" and it is extended from a sound base after a considerable rally this year.
>>> The latest Featured Stock Update with an annotated graph appeared on 10/1/2010. Click here.
View all notes |
Alert me of new notes |
CANSLIM.net Company Profile |
SEC |
Zacks Reports |
StockTalk |
News |
Chart |
Request a new note
C
A N
S L
I M
|
Symbol/Exchange
Company Name
Industry Group |
PRICE |
CHANGE
(%Change) |
Day High |
Volume
(% DAV)
(% 50 day avg vol) |
52 Wk Hi
% From Hi |
Featured
Date |
Price
Featured |
Pivot Featured |
|
Max Buy |
NTAP
-
NASDAQ
Netapp Inc
COMPUTER HARDWARE - Data Storage Devices
|
$53.60
|
+0.32
0.60% |
$54.19
|
2,741,852
36.18% of 50 DAV
50 DAV is 7,578,800
|
$54.05
-0.83%
|
9/8/2010
|
$46.98
|
PP = $44.99
|
|
MB = $47.24
|
Most Recent Note - 11/1/2010 4:17:27 PM
G - Another small gain today with light volume for a new high close. Its recent lows near $47 define an initial chart support level to watch above its 50 DMA line.
>>> The latest Featured Stock Update with an annotated graph appeared on 9/8/2010. Click here.
View all notes |
Alert me of new notes |
CANSLIM.net Company Profile |
SEC |
Zacks Reports |
StockTalk |
News |
Chart |
Request a new note
C
A N
S L
I M
|
ORCL
-
NASDAQ
Oracle Corp
COMPUTER SOFTWARE and SERVICES - Application Software
|
$29.53
|
+0.40
1.38% |
$29.54
|
24,188,271
60.30% of 50 DAV
50 DAV is 40,111,000
|
$29.71
-0.60%
|
9/20/2010
|
$27.32
|
PP = $26.73
|
|
MB = $28.07
|
Most Recent Note - 10/28/2010 5:51:01 PM
G - Below average volume was behind today's gain for a new 52-week high. Stubbornly holding its ground after getting extended beyond its "max buy" level.
>>> The latest Featured Stock Update with an annotated graph appeared on 9/20/2010. Click here.
View all notes |
Alert me of new notes |
CANSLIM.net Company Profile |
SEC |
Zacks Reports |
StockTalk |
News |
Chart |
Request a new note
C
A N
S L
I M
|
PAY
-
NYSE
Verifone Systems Inc
COMPUTER HARDWARE - Transaction Automation Systems
|
$34.87
|
+1.21
3.59% |
$34.87
|
1,218,469
78.86% of 50 DAV
50 DAV is 1,545,100
|
$34.66
0.61%
|
8/25/2010
|
$24.30
|
PP = $23.74
|
|
MB = $24.93
|
Most Recent Note - 11/2/2010 2:07:05 PM
G - Small gap up gain today, perched at its all-time highs, extended from a sound base pattern. Its 50 DMA line defines chart support.
>>> The latest Featured Stock Update with an annotated graph appeared on 10/25/2010. Click here.
View all notes |
Alert me of new notes |
CANSLIM.net Company Profile |
SEC |
Zacks Reports |
StockTalk |
News |
Chart |
Request a new note
C
A N
S L
I M
|
PRGO
-
NASDAQ
Perrigo Co
DRUGS - Drug Related Products
|
$66.32
|
-0.65
-0.97% |
$68.38
|
1,526,054
197.14% of 50 DAV
50 DAV is 774,100
|
$67.94
-2.38%
|
9/15/2010
|
$63.73
|
PP = $64.76
|
|
MB = $68.00
|
Most Recent Note - 11/2/2010 1:00:14 PM
Y - Hit a new 52-week high today and briefly traded above its "max buy" level before reversing into the red. Reported +23% earnings on +21% sales revenues for the quarter ended September 30, 2010. That marks its smallest percentage earnings increase in 5 quarters. Recently building a base-on-base type pattern above support at its 50 DMA line. Confirming gains to new highs with above average volume would be a very reassuring sign that it may be capable of a sustained advance in price.
>>> The latest Featured Stock Update with an annotated graph appeared on 9/15/2010. Click here.
View all notes |
Alert me of new notes |
CANSLIM.net Company Profile |
SEC |
Zacks Reports |
StockTalk |
News |
Chart |
Request a new note
C
A N
S L
I M
|
RAX
-
NYSE
Rackspace Hosting Inc
INTERNET - Internet Software and; Services
|
$25.95
|
+0.59
2.33% |
$27.94
|
7,900,478
325.55% of 50 DAV
50 DAV is 2,426,800
|
$26.50
-2.08%
|
9/21/2010
|
$22.84
|
PP = $23.61
|
|
MB = $24.79
|
Most Recent Note - 11/2/2010 1:02:01 PM
G - Trading well off the session highs after a gap up today and considerable rally to a new all-time high. Strength in the Internet - Networking group has been reassuring, especially after a gap up gain last week from F5 Networks (FFIV) after earnings news. RAX is due to report earnings on Monday, November 8, 2010, after the close.
>>> The latest Featured Stock Update with an annotated graph appeared on 9/21/2010. Click here.
View all notes |
Alert me of new notes |
CANSLIM.net Company Profile |
SEC |
Zacks Reports |
StockTalk |
News |
Chart |
Request a new note
C
A N
S L
I M
|
Symbol/Exchange
Company Name
Industry Group |
PRICE |
CHANGE
(%Change) |
Day High |
Volume
(% DAV)
(% 50 day avg vol) |
52 Wk Hi
% From Hi |
Featured
Date |
Price
Featured |
Pivot Featured |
|
Max Buy |
ROVI
-
NASDAQ
Rovi Corp
COMPUTER SOFTWARE andamp; SERVICES - Security Software andamp; Services
|
$51.72
|
+0.23
0.45% |
$52.02
|
891,950
56.17% of 50 DAV
50 DAV is 1,587,900
|
$53.26
-2.89%
|
10/29/2010
|
$49.99
|
PP = $53.10
|
|
MB = $55.76
|
Most Recent Note - 11/1/2010 10:21:35 AM
Y - Gapped up today and touched a new 52-week high. Last week it reported earnings +67% on +21% sales revenues for the quarter ended September 30, 2010 versus the year ago period, its biggest percentage increases in the past 5 quarterly comparisons. Color code was changed to yellow with a new pivot point cited based on its 52-week high plus ten cents. A convincing breakout above its pivot point with volume conviction would trigger a new (or add-on) technical buy signal. Meanwhile, support to watch is defined by its 50 DMA line.
>>> The latest Featured Stock Update with an annotated graph appeared on 10/20/2010. Click here.
View all notes |
Alert me of new notes |
CANSLIM.net Company Profile |
SEC |
Zacks Reports |
StockTalk |
News |
Chart |
Request a new note
C
A N
S L
I M
|
SHOO
-
NASDAQ
Steven Madden Limited
CONSUMER NON-DURABLES - Textile - Apparel Footwear
|
$40.50
|
-1.83
-4.32% |
$41.17
|
2,384,814
779.61% of 50 DAV
50 DAV is 305,900
|
$44.85
-9.70%
|
9/15/2010
|
$38.94
|
PP = $40.27
|
|
MB = $42.28
|
Most Recent Note - 11/2/2010 10:16:31 AM
G - Gapped down today following earnings news. After initial weakness it is up from early lows below its 50 DMA line and prior chart highs in the $40 area. Prompt support is an encouraging sign, and a finish near the session high would be reassuring, meanwhile, a weak close may not bode well and could negate all of the bullish action following its latest technical breakout.
>>> The latest Featured Stock Update with an annotated graph appeared on 9/29/2010. Click here.
View all notes |
Alert me of new notes |
CANSLIM.net Company Profile |
SEC |
Zacks Reports |
StockTalk |
News |
Chart |
Request a new note
C
A N
S L
I M
|
SLW
-
NYSE
Silver Wheaton Corp
METALS and; MINING - Silver
|
$29.73
|
+0.79
2.73% |
$29.73
|
6,250,601
93.11% of 50 DAV
50 DAV is 6,713,400
|
$29.91
-0.60%
|
8/25/2010
|
$21.40
|
PP = $21.99
|
|
MB = $23.09
|
Most Recent Note - 11/2/2010 10:22:01 AM
G - Gapped up today for another new 52-week high. It is clear of resistance due to overhead supply, but it is extended and not breaking out of a sound new base. The high-ranked leader is one of the strongest names in the Mining - Gold/Silver/Gems group currently included on the Featured Stocks list.
>>> The latest Featured Stock Update with an annotated graph appeared on 10/18/2010. Click here.
View all notes |
Alert me of new notes |
CANSLIM.net Company Profile |
SEC |
Zacks Reports |
StockTalk |
News |
Chart |
Request a new note
C
A N
S L
I M
|
SVR
-
NYSE
Syniverse Holdings Inc
TELECOMMUNICATIONS - Diversified Communication Serv
|
$30.50
|
+0.08
0.26% |
$30.49
|
3,079,319
236.31% of 50 DAV
50 DAV is 1,303,100
|
$31.25
-2.40%
|
9/22/2010
|
$23.60
|
PP = $23.87
|
|
MB = $25.06
|
Most Recent Note - 11/2/2010 1:09:20 PM
G - Holding its ground after a considerable gain on 10/28/10 after news Carlyle Group will buy Syniverse Technologies for $31 per share. Color code was changed to green after spiking above its "max buy" level.
>>> The latest Featured Stock Update with an annotated graph appeared on 9/22/2010. Click here.
View all notes |
Alert me of new notes |
CANSLIM.net Company Profile |
SEC |
Zacks Reports |
StockTalk |
News |
Chart |
Request a new note
C
A N
S L
I M
|
UA
-
NYSE
Under Armour Inc Cl A
CONSUMER NON-DURABLES - Textile - Apparel Clothing
|
$46.80
|
+0.30
0.65% |
$47.39
|
564,372
73.85% of 50 DAV
50 DAV is 764,200
|
$48.59
-3.68%
|
9/9/2010
|
$39.99
|
PP = $40.10
|
|
MB = $42.11
|
Most Recent Note - 10/27/2010 2:00:50 PM
G - Gapped down today and held its ground on the prior session following a report of earnings +21% on +22% sales revenues for the quarter ended September 30, 2010 versus the year ago period. It remains near its 52-week high, in healthy shape technically, and may deserve the benefit of the doubt with a favorable backdrop from the M criteria currently favoring 3 out of 4 growth stocks. However, the weaker earnings increase (under the +25% guideline) raises concerns, fundamentally, with respect to the C criteria. Earlier notes acknowledged the downward turn in annual earnings (A criteria) in FY '08, another fundamental concern with respect to the fact-based investment system.
.
>>> The latest Featured Stock Update with an annotated graph appeared on 9/9/2010. Click here.
View all notes |
Alert me of new notes |
CANSLIM.net Company Profile |
SEC |
Zacks Reports |
StockTalk |
News |
Chart |
Request a new note
C
A N
S L
I M
|
Symbol/Exchange
Company Name
Industry Group |
PRICE |
CHANGE
(%Change) |
Day High |
Volume
(% DAV)
(% 50 day avg vol) |
52 Wk Hi
% From Hi |
Featured
Date |
Price
Featured |
Pivot Featured |
|
Max Buy |
UFPT
-
NASDAQ
U F P Tech Inc
CONSUMER NON-DURABLES - Packaging and Containers
|
$12.16
|
+0.08
0.66% |
$12.15
|
58,626
95.79% of 50 DAV
50 DAV is 61,200
|
$13.32
-8.71%
|
9/16/2010
|
$11.20
|
PP = $11.69
|
|
MB = $12.27
|
Most Recent Note - 11/1/2010 4:01:40 PM
Y - Color code was changed to yellow after its healthy consolidation to its 10 week average. It may be considered buyable up to +5% above its recent high ($13.32 plus 5%) as a secondary buy point following its earlier technical breakout, however a new pivot point is not cited because it did not form a sound new base pattern.
>>> The latest Featured Stock Update with an annotated graph appeared on 9/17/2010. Click here.
View all notes |
Alert me of new notes |
CANSLIM.net Company Profile |
SEC |
Zacks Reports |
StockTalk |
News |
Chart |
Request a new note
C
A N
S L
I M
|
ULTA
-
NASDAQ
Ulta Salon Cosm & Frag
SPECIALTY RETAIL - Specialty Retail, Other
|
$30.81
|
+0.40
1.32% |
$30.96
|
293,197
44.48% of 50 DAV
50 DAV is 659,100
|
$32.68
-5.72%
|
9/3/2010
|
$26.36
|
PP = $25.89
|
|
MB = $27.18
|
Most Recent Note - 11/2/2010 2:58:38 PM
G - Its 50 DMA line defines support to watch above prior chart highs in the $26 area, meanwhile it is extended from a sound base pattern.
>>> The latest Featured Stock Update with an annotated graph appeared on 11/1/2010. Click here.
View all notes |
Alert me of new notes |
CANSLIM.net Company Profile |
SEC |
Zacks Reports |
StockTalk |
News |
Chart |
Request a new note
C
A N
S L
I M
|
VIT
-
NYSE
Vanceinfo Tech Inc Ads
COMPUTER SOFTWARE and SERVICES - Business Software and Services
|
$37.37
|
+0.04
0.11% |
$37.98
|
226,864
35.69% of 50 DAV
50 DAV is 635,600
|
$37.89
-1.37%
|
7/8/2010
|
$25.20
|
PP = $26.58
|
|
MB = $27.91
|
Most Recent Note - 11/1/2010 11:03:22 AM
G - Hitting another new all-time high today, extended from any sound base pattern. Meanwhile, its 50 DMA line and recent low ($30.55 on 10/08/10) define important chart support to watch.
>>> The latest Featured Stock Update with an annotated graph appeared on 10/21/2010. Click here.
View all notes |
Alert me of new notes |
CANSLIM.net Company Profile |
SEC |
Zacks Reports |
StockTalk |
News |
Chart |
Request a new note
C
A N
S L
I M
|
WCRX
-
NASDAQ
Warner Chilcott Plc
DRUGS - Drug Manufacturers - Other
|
$23.80
|
-0.09
-0.38% |
$24.05
|
1,637,446
56.58% of 50 DAV
50 DAV is 2,894,100
|
$25.32
-6.00%
|
8/23/2010
|
$21.04
|
PP = $20.84
|
|
MB = $21.88
|
Most Recent Note - 10/29/2010 5:50:28 PM
G - Small loss on above average volume today, a sign of distributional pressure. Holding its ground stubbornly since its "negative reversal" on 10/22/10 was noted. Prior chart highs near $23.50 define near-term support above its 50 DMA line. Its currently low P/E Ratio of 8 (only 60% X S&P 500) might attract the interest of "value" players, but the low P/E and Street estimates calling for only +3% earnings growth in FY '11 raise concerns with respect to its future earnings outlook.
>>> The latest Featured Stock Update with an annotated graph appeared on 10/15/2010. Click here.
View all notes |
Alert me of new notes |
CANSLIM.net Company Profile |
SEC |
Zacks Reports |
StockTalk |
News |
Chart |
Request a new note
C
A N
S L
I M
|