***Last / Change / Volume data in this table is the closing quote data***
Symbol/Exchange
Company Name
Industry Group |
PRICE |
CHANGE
(%Change) |
Day High |
Volume
(% DAV)
(% 50 day avg vol) |
52 Wk Hi
% From Hi |
Featured
Date |
Price
Featured |
Pivot Featured |
|
Max Buy |
ABV
-
NYSE
Comp De Bebidas Adr
FOOD and BEVERAGE - Beverages - Brewers
|
$139.85
|
+0.91
0.65% |
$140.63
|
497,337
74.68% of 50 DAV
50 DAV is 666,000
|
$143.53
-2.56%
|
6/29/2010
|
$104.74
|
PP = $109.33
|
|
MB = $114.80
|
Most Recent Note - 10/29/2010 5:38:29 PM
G - Gapped up today, rebounding after a couple of distribution days this week. Extended from a sound base, its 50 DMA line ($123.04 now) defines support.
>>> The latest Featured Stock Update with an annotated graph appeared on 10/11/2010. Click here.
View all notes |
Alert me of new notes |
CANSLIM.net Company Profile |
SEC |
Zacks Reports |
StockTalk |
News |
Chart |
Request a new note
C
A N
S L
I M


|
ARUN
-
NASDAQ
Aruba Networks Inc
COMPUTER HARDWARE - Networking andamp; Communication Dev
|
$23.04
|
-0.02
-0.09% |
$23.30
|
1,425,910
54.97% of 50 DAV
50 DAV is 2,593,900
|
$23.18
-0.60%
|
8/30/2010
|
$18.12
|
PP = $18.51
|
|
MB = $19.44
|
Most Recent Note - 11/2/2010 3:04:07 PM
G - Hit a new 52-week high today with a considerable gain after a small gap up. Found great support near its 50 DMA line during its choppy 5-week consolidation near its 2007 all-time highs.
>>> The latest Featured Stock Update with an annotated graph appeared on 10/26/2010. Click here.
View all notes |
Alert me of new notes |
CANSLIM.net Company Profile |
SEC |
Zacks Reports |
StockTalk |
News |
Chart |
Request a new note
C
A N
S L
I M
|
BIDU
-
NASDAQ
Baidu Inc Ads
INTERNET - Internet Information Providers
|
$110.65
|
+1.10
1.00% |
$110.87
|
7,553,564
66.19% of 50 DAV
50 DAV is 11,411,100
|
$113.78
-2.75%
|
9/17/2010
|
$85.73
|
PP = $88.42
|
|
MB = $92.84
|
Most Recent Note - 11/2/2010 4:49:55 PM
G - Gain today halted a streak of 3 consecutive losses. Consolidating after gains with above average volume for all-time highs. Extended from a sound base pattern, the nearest support is recent chart lows near $95-96 which come into play near its 50 DMA line.
>>> The latest Featured Stock Update with an annotated graph appeared on 10/7/2010. Click here.
View all notes |
Alert me of new notes |
CANSLIM.net Company Profile |
SEC |
Zacks Reports |
StockTalk |
News |
Chart |
Request a new note
C
A N
S L
I M
|
CACC
-
NASDAQ
Credit Acceptance Corp
FINANCIAL SERVICES - Credit Services
|
$59.86
|
+1.85
3.19% |
$59.96
|
10,822
41.15% of 50 DAV
50 DAV is 26,300
|
$63.45
-5.66%
|
11/3/2010
|
$59.86
|
PP = $63.55
|
|
MB = $66.73
|
 Most Recent Note - 11/3/2010 5:45:35 PM
Y - Today's gain on light volume helped it close above its 50 DMA line, technically helping its outlook. That short-term average acted as stubborn resistance since it was violated on 10/01/10 with a damaging loss on above average volume. Color code is changed to yellow with new pivot point cited based on its 52-week high plus ten cents. A subsequent breakout on volume could trigger a new (or add-on) buy signal, meanwhile it is ideal for investors' watchlists. It reported earnings +26% on +11% sales revenues for the quarter ended September 30, 2010. Its $55.07 low (on 10/04/10) defines the nearest chart support level to watch above its long ago chart highs ($53.97).
>>> The latest Featured Stock Update with an annotated graph appeared on 10/29/2010. Click here.
View all notes |
Alert me of new notes |
CANSLIM.net Company Profile |
SEC |
Zacks Reports |
StockTalk |
News |
Chart |
Request a new note
C
A N
S L
I M
|
CMG
-
NYSE
Chipotle Mexican Grill
LEISURE - Restaurants
|
$219.32
|
+4.11
1.91% |
$219.32
|
815,829
107.11% of 50 DAV
50 DAV is 761,700
|
$215.38
1.83%
|
9/1/2010
|
$158.31
|
PP = $155.52
|
|
MB = $163.30
|
Most Recent Note - 11/2/2010 2:59:39 PM
G - Still holding its ground stubbornly after big volume driven gains on 10/22/10 and 10/26/10 to new new all-time highs. It is extended from a sound base. Its 50 DMA line defines chart support above its prior highs in the $155 area.
>>> The latest Featured Stock Update with an annotated graph appeared on 10/28/2010. Click here.
View all notes |
Alert me of new notes |
CANSLIM.net Company Profile |
SEC |
Zacks Reports |
StockTalk |
News |
Chart |
Request a new note
C
A N
S L
I M
|
Symbol/Exchange
Company Name
Industry Group |
PRICE |
CHANGE
(%Change) |
Day High |
Volume
(% DAV)
(% 50 day avg vol) |
52 Wk Hi
% From Hi |
Featured
Date |
Price
Featured |
Pivot Featured |
|
Max Buy |
CTRP
-
NASDAQ
Ctrip.Com Intl Ltd Adr
LEISURE - Resorts and Casinos
|
$48.36
|
-3.80
-7.28% |
$52.31
|
10,321,626
607.76% of 50 DAV
50 DAV is 1,698,300
|
$53.16
-9.03%
|
9/24/2010
|
$46.75
|
PP = $47.11
|
|
MB = $49.47
|
Most Recent Note - 11/3/2010 12:09:42 PM
G - Down considerably today with heavy volume. Reported earnings +68% on +52% sales revenues for the quarter ended September 30, 2010 versus the year ago period. Prior highs in the $47 area and its 50 DMA line define important chart support to watch.
>>> The latest Featured Stock Update with an annotated graph appeared on 9/28/2010. Click here.
View all notes |
Alert me of new notes |
CANSLIM.net Company Profile |
SEC |
Zacks Reports |
StockTalk |
News |
Chart |
Request a new note
C
A N
S L
I M
|
DECK
-
NASDAQ
Deckers Outdoor Corp
CONSUMER NON-DURABLES - Textile - Apparel Footwear
|
$57.32
|
+0.57
1.00% |
$57.42
|
790,386
74.88% of 50 DAV
50 DAV is 1,055,500
|
$58.90
-2.68%
|
10/27/2010
|
$54.16
|
PP = $54.86
|
|
MB = $57.60
|
Most Recent Note - 11/1/2010 12:25:09 PM
G - Holding its ground following a 10/29/10 breakaway gap with 4 times average volume for a new 52-week high. Reported earnings +24% on +22% sales revenues for the quarter ended September 30, 2010 versus the year ago period. The earnings increases was the smallest percentage improvement in the past 5 quarterly comparisons and borderline with the minimum (+25%) increase the investment system calls for. Color code was changed to green after quickly trading above its "max buy" level.
>>> The latest Featured Stock Update with an annotated graph appeared on 10/27/2010. Click here.
View all notes |
Alert me of new notes |
CANSLIM.net Company Profile |
SEC |
Zacks Reports |
StockTalk |
News |
Chart |
Request a new note
C
A N
S L
I M
|
EBIX
-
NASDAQ
Ebix Inc
COMPUTER SOFTWARE and SERVICES - Business Software and Services
|
$24.72
|
+0.48
1.98% |
$24.97
|
506,312
80.95% of 50 DAV
50 DAV is 625,500
|
$26.36
-6.22%
|
9/23/2010
|
$21.78
|
PP = $22.74
|
|
MB = $23.88
|
Most Recent Note - 11/3/2010 5:52:06 PM
G - Traded up today after a positive reversal on the prior session was a sign of prompt support arriving above its old chart highs. Recent low ($22.12 on 10/26/10) and its 50 DMA line define support, while losses leading to violations would raise concerns and trigger technical sell signals. Due to report earnings on Tuesday, November 9, 2010.
>>> The latest Featured Stock Update with an annotated graph appeared on 9/24/2010. Click here.
View all notes |
Alert me of new notes |
CANSLIM.net Company Profile |
SEC |
Zacks Reports |
StockTalk |
News |
Chart |
Request a new note
C
A N
S L
I M
|
FFIV
-
NASDAQ
F 5 Networks Inc
INTERNET - Internet Software and Services
|
$122.92
|
+5.57
4.75% |
$122.96
|
2,765,812
109.96% of 50 DAV
50 DAV is 2,515,300
|
$119.88
2.54%
|
6/16/2010
|
$74.50
|
PP = $74.10
|
|
MB = $77.81
|
Most Recent Note - 11/3/2010 5:36:28 PM
G - Hit a new high today with a considerable gain on average volume after holding its ground stubbornly following its big 10/27/10 gap up. It may go on to produce more climactic gains, however it did not form a sound new base and may be considered "late stage" after its considerable rally this year.
>>> The latest Featured Stock Update with an annotated graph appeared on 9/13/2010. Click here.
View all notes |
Alert me of new notes |
CANSLIM.net Company Profile |
SEC |
Zacks Reports |
StockTalk |
News |
Chart |
Request a new note
C
A N
S L
I M
|
FOSL
-
NASDAQ
Fossil Inc
CONSUMER DURABLES - Recreational Goods, Other
|
$60.22
|
+0.05
0.08% |
$60.54
|
771,523
102.31% of 50 DAV
50 DAV is 754,100
|
$60.41
-0.31%
|
10/20/2010
|
$54.12
|
PP = $55.61
|
|
MB = $58.39
|
Most Recent Note - 11/2/2010 12:30:06 PM
G - Small gap up today for another new high, getting more extended. Color code was changed to green after a recent streak of gains without great volume conviction. The nearby chart support level to watch is its 50 DMA line. Earnings news is due prior to the market open on Tuesday, November 9, 2010.
>>> The latest Featured Stock Update with an annotated graph appeared on 10/5/2010. Click here.
View all notes |
Alert me of new notes |
CANSLIM.net Company Profile |
SEC |
Zacks Reports |
StockTalk |
News |
Chart |
Request a new note
C
A N
S L
I M
|
Symbol/Exchange
Company Name
Industry Group |
PRICE |
CHANGE
(%Change) |
Day High |
Volume
(% DAV)
(% 50 day avg vol) |
52 Wk Hi
% From Hi |
Featured
Date |
Price
Featured |
Pivot Featured |
|
Max Buy |
HMSY
-
NASDAQ
H M S Holdings Corp
COMPUTER SOFTWARE and SERVICES - Healthcare Information Service
|
$59.50
|
-0.73
-1.21% |
$60.21
|
167,583
80.69% of 50 DAV
50 DAV is 207,700
|
$62.91
-5.42%
|
9/27/2010
|
$57.97
|
PP = $58.36
|
|
MB = $61.28
|
Most Recent Note - 11/2/2010 4:52:09 PM
Y - Small gap up gain today after encouraging signs of prompt support showing up near its 50 DMA line following its latest earnings report. Color code was changed to yellow based on its impressive resilience after distributional pressure caused technical damage.
>>> The latest Featured Stock Update with an annotated graph appeared on 9/27/2010. Click here.
View all notes |
Alert me of new notes |
CANSLIM.net Company Profile |
SEC |
Zacks Reports |
StockTalk |
News |
Chart |
Request a new note
C
A N
S L
I M
|
HS
-
NYSE
Healthspring Inc
HEALTH SERVICES - Health Care Plans
|
$28.09
|
-0.06
-0.21% |
$28.45
|
587,641
76.31% of 50 DAV
50 DAV is 770,100
|
$29.80
-5.74%
|
8/27/2010
|
$19.91
|
PP = $19.75
|
|
MB = $20.74
|
Most Recent Note - 11/1/2010 11:11:38 AM
G - Down today, erasing most of the prior session's gain for a new 52-week high. A "positive reversal" on 10/28/10 followed earnings news after dipping near its 50 DMA line, and the prompt support near its short-term average was impressive. Earnings were +23% with sales revenues +10% for the quarter ended September 30, 2010 versus the year ago period, marking its weakest earnings increase in 5 quarterly comparisons with a worrisome deceleration in sales revenues growth.
>>> The latest Featured Stock Update with an annotated graph appeared on 10/22/2010. Click here.
View all notes |
Alert me of new notes |
CANSLIM.net Company Profile |
SEC |
Zacks Reports |
StockTalk |
News |
Chart |
Request a new note
C
A N
S L
I M
|
IGTE
-
NASDAQ
Igate Corp
COMPUTER SOFTWARE and SERVICES - Information Technology Service
|
$20.61
|
+0.26
1.28% |
$20.93
|
462,358
75.86% of 50 DAV
50 DAV is 609,500
|
$21.10
-2.32%
|
10/26/2010
|
$17.29
|
PP = $19.55
|
|
MB = $20.53
|
Most Recent Note - 11/3/2010 5:55:32 PM
G - Small gain today on light volume for a best-ever close above its "max buy" level. Color code is changed to green. Prior chart highs in the $19 area define initial chart support above its 50 DMA line.
>>> The latest Featured Stock Update with an annotated graph appeared on 9/10/2010. Click here.
View all notes |
Alert me of new notes |
CANSLIM.net Company Profile |
SEC |
Zacks Reports |
StockTalk |
News |
Chart |
Request a new note
C
A N
S L
I M
|
JOBS
-
NASDAQ
Fifty One Job Inc Ads
DIVERSIFIED SERVICES - Staffing and; Outsourcing Service
|
$46.56
|
+0.16
0.34% |
$47.00
|
59,929
32.29% of 50 DAV
50 DAV is 185,600
|
$47.48
-1.94%
|
10/13/2010
|
$42.07
|
PP = $40.60
|
|
MB = $42.63
|
Most Recent Note - 11/1/2010 4:16:35 PM
G - Closed with a small gain today. Wider intra-day price swings have been noted as signs of uncertainty, meanwhile prior highs in the $40 area define support above its 50 DMA line.
>>> The latest Featured Stock Update with an annotated graph appeared on 9/16/2010. Click here.
View all notes |
Alert me of new notes |
CANSLIM.net Company Profile |
SEC |
Zacks Reports |
StockTalk |
News |
Chart |
Request a new note
C
A N
S L
I M
|
LULU
-
NASDAQ
Lululemon Athletica
MANUFACTURING - Textile Manufacturing
|
$44.63
|
-0.13
-0.29% |
$45.16
|
446,066
36.08% of 50 DAV
50 DAV is 1,236,400
|
$48.45
-7.88%
|
10/8/2010
|
$47.66
|
PP = $46.67
|
|
MB = $49.00
|
Most Recent Note - 11/3/2010 6:09:29 PM
Y - Volume totals have been cooling while hovering near old highs in the $45-46 area. Gains to new highs with heavy volume would be a confirming sign of serious institutional accumulation. Meanwhile, recent lows in the $42 area define support to watch above its 50 DMA line.
>>> The latest Featured Stock Update with an annotated graph appeared on 10/8/2010. Click here.
View all notes |
Alert me of new notes |
CANSLIM.net Company Profile |
SEC |
Zacks Reports |
StockTalk |
News |
Chart |
Request a new note
C
A N
S L
I M
|
Symbol/Exchange
Company Name
Industry Group |
PRICE |
CHANGE
(%Change) |
Day High |
Volume
(% DAV)
(% 50 day avg vol) |
52 Wk Hi
% From Hi |
Featured
Date |
Price
Featured |
Pivot Featured |
|
Max Buy |
MRX
-
NYSE
Medicis Pharmaceut Cl A
DRUGS - Biotechnology
|
$29.98
|
+0.11
0.37% |
$30.02
|
648,282
59.88% of 50 DAV
50 DAV is 1,082,600
|
$30.94
-3.10%
|
8/12/2010
|
$26.88
|
PP = $26.71
|
|
MB = $28.05
|
Most Recent Note - 11/2/2010 2:53:17 PM
G - Volume totals have been cooling while consolidating in a tight trading range just above its 50 DMA line. Reporting earnings after the market closes on Thursday, November 4, 2010. In recent weeks Medicis Pharmaceutical Corp said Genzyme Corp had sued it in a U.S. court over its wrinkle treatments, accusing patent violation. Medicis acquired exclusive U.S. and Canadian rights to the Restylane family of products through certain license agreements in March 2003. Also it amended its 2009 complaint against India's Lupin Ltd related to a copycat version of Medicis' acne treatment Solodyn, to include a newly issued patent.
>>> The latest Featured Stock Update with an annotated graph appeared on 10/4/2010. Click here.
View all notes |
Alert me of new notes |
CANSLIM.net Company Profile |
SEC |
Zacks Reports |
StockTalk |
News |
Chart |
Request a new note
C
A N
S L
I M
|
MWIV
-
NASDAQ
M W I Veterinary Supply
HEALTH SERVICES - Medical Instruments and; Supplies
|
$57.51
|
-0.48
-0.83% |
$58.20
|
20,826
36.47% of 50 DAV
50 DAV is 57,100
|
$59.50
-3.34%
|
7/29/2010
|
$52.05
|
PP = $52.09
|
|
MB = $54.69
|
Most Recent Note - 11/1/2010 1:02:04 PM
G - Consolidating near its 52-week high, it recently found support near its 50 DMA line. Any subsequent violation of that classic chart support level or breach of recent lows would raise greater concerns. Due to announce earnings on Thursday, November 4, 2010.
>>> The latest Featured Stock Update with an annotated graph appeared on 11/2/2010. Click here.
View all notes |
Alert me of new notes |
CANSLIM.net Company Profile |
SEC |
Zacks Reports |
StockTalk |
News |
Chart |
Request a new note
C
A N
S L
I M
|
NEM
-
NYSE
Newmont Mining Corp
METALS and MINING - Gold
|
$59.11
|
-0.78
-1.30% |
$59.66
|
9,229,908
142.46% of 50 DAV
50 DAV is 6,479,000
|
$65.50
-9.76%
|
8/31/2010
|
$61.32
|
PP = $63.48
|
|
MB = $66.65
|
Most Recent Note - 11/2/2010 10:37:41 AM
G - Gapped up today, then reversed the early gain and promptly slumped below its 50 DMA line. That important short-term average may act as resistance, and it is now -8% off its 52-week high.
>>> The latest Featured Stock Update with an annotated graph appeared on 9/14/2010. Click here.
View all notes |
Alert me of new notes |
CANSLIM.net Company Profile |
SEC |
Zacks Reports |
StockTalk |
News |
Chart |
Request a new note
C
A N
S L
I M
|
NEOG
-
NASDAQ
Neogen Corp
DRUGS - Diagnostic Substances
|
$35.26
|
+0.29
0.83% |
$35.42
|
84,787
82.16% of 50 DAV
50 DAV is 103,200
|
$36.37
-3.05%
|
9/1/2010
|
$30.79
|
PP = $30.49
|
|
MB = $32.01
|
Most Recent Note - 11/2/2010 2:04:54 PM
Y - Color code is changed to yellow while rallying up from its 10 week moving average. It may be considered buyable up to +5% above its recent high ($36.37 plus 5%) as a secondary buy point following its earlier technical breakout, however a new pivot point is not cited because it did not form a sound new base pattern
>>> The latest Featured Stock Update with an annotated graph appeared on 10/13/2010. Click here.
View all notes |
Alert me of new notes |
CANSLIM.net Company Profile |
SEC |
Zacks Reports |
StockTalk |
News |
Chart |
Request a new note
C
A N
S L
I M
|
NFLX
-
NASDAQ
Netflix Inc
SPECIALTY RETAIL - Music and Video Stores
|
$171.46
|
-0.15
-0.09% |
$174.04
|
3,906,360
70.56% of 50 DAV
50 DAV is 5,536,400
|
$184.74
-7.19%
|
8/10/2010
|
$124.05
|
PP = $124.00
|
|
MB = $130.20
|
Most Recent Note - 11/2/2010 4:48:13 PM
G - Gain today halted a streak of 3 consecutive losses. Now -7% off its 52-week high, it could go on to produce more climactic gains, but it is considered "late stage" and it is extended from a sound base after a considerable rally this year.
>>> The latest Featured Stock Update with an annotated graph appeared on 10/1/2010. Click here.
View all notes |
Alert me of new notes |
CANSLIM.net Company Profile |
SEC |
Zacks Reports |
StockTalk |
News |
Chart |
Request a new note
C
A N
S L
I M
|
Symbol/Exchange
Company Name
Industry Group |
PRICE |
CHANGE
(%Change) |
Day High |
Volume
(% DAV)
(% 50 day avg vol) |
52 Wk Hi
% From Hi |
Featured
Date |
Price
Featured |
Pivot Featured |
|
Max Buy |
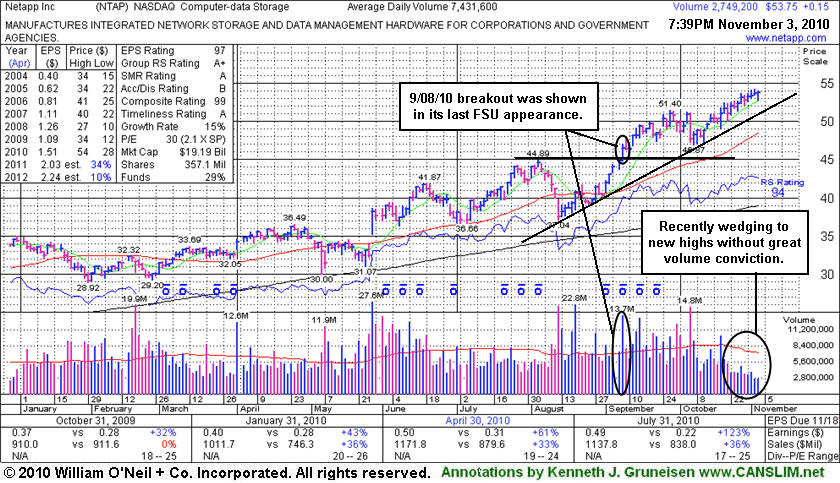
NTAP
-
NASDAQ
Netapp Inc
COMPUTER HARDWARE - Data Storage Devices
|
$53.75
|
+0.15
0.28% |
$53.95
|
2,762,328
36.78% of 50 DAV
50 DAV is 7,511,300
|
$54.19
-0.81%
|
9/8/2010
|
$46.98
|
PP = $44.99
|
|
MB = $47.24
|
Most Recent Note - 11/3/2010 7:51:04 PM
G - Wedged higher for another small gain today with light volume and a new high close. Its recent lows near $47 define an initial chart support level to watch above its 50 DMA line.
>>> The latest Featured Stock Update with an annotated graph appeared on 11/3/2010. Click here.
View all notes |
Alert me of new notes |
CANSLIM.net Company Profile |
SEC |
Zacks Reports |
StockTalk |
News |
Chart |
Request a new note
C
A N
S L
I M
|
ORCL
-
NASDAQ
Oracle Corp
COMPUTER SOFTWARE and SERVICES - Application Software
|
$29.20
|
-0.33
-1.13% |
$29.57
|
29,993,390
74.81% of 50 DAV
50 DAV is 40,093,300
|
$29.71
-1.72%
|
9/20/2010
|
$27.32
|
PP = $26.73
|
|
MB = $28.07
|
Most Recent Note - 11/3/2010 6:13:06 PM
G - Recently wedging to new 52-week highs, getting extended beyond its "max buy" level, without great volume conviction behind gains in the past 2 weeks. It was barely changed on news it agreed to buy Art Technology Group (ARTG +45.12% yesterday) for $1 billion.
>>> The latest Featured Stock Update with an annotated graph appeared on 9/20/2010. Click here.
View all notes |
Alert me of new notes |
CANSLIM.net Company Profile |
SEC |
Zacks Reports |
StockTalk |
News |
Chart |
Request a new note
C
A N
S L
I M
|
PAY
-
NYSE
Verifone Systems Inc
COMPUTER HARDWARE - Transaction Automation Systems
|
$34.50
|
-0.37
-1.06% |
$34.87
|
1,082,535
70.56% of 50 DAV
50 DAV is 1,534,100
|
$34.88
-1.09%
|
8/25/2010
|
$24.30
|
PP = $23.74
|
|
MB = $24.93
|
Most Recent Note - 11/2/2010 2:07:05 PM
G - Small gap up gain today, perched at its all-time highs, extended from a sound base pattern. Its 50 DMA line defines chart support.
>>> The latest Featured Stock Update with an annotated graph appeared on 10/25/2010. Click here.
View all notes |
Alert me of new notes |
CANSLIM.net Company Profile |
SEC |
Zacks Reports |
StockTalk |
News |
Chart |
Request a new note
C
A N
S L
I M
|
PRGO
-
NASDAQ
Perrigo Co
DRUGS - Drug Related Products
|
$63.75
|
-2.57
-3.88% |
$65.99
|
1,606,066
205.91% of 50 DAV
50 DAV is 780,000
|
$68.38
-6.77%
|
9/15/2010
|
$63.73
|
PP = $64.76
|
|
MB = $68.00
|
Most Recent Note - 11/3/2010 5:34:43 PM
G - Sank near its 50 DMA line and prior lows with a second consecutive loss on heavy volume today following a worrisome negative reversal after it hit a new 52-week high on the prior session. Color code is changed to green based on disappointing technical action and weaker earnings growth in the latest quarter. Reported its smallest percentage earnings increase in 5 quarters, after +73%, +56%, +52%, +42%, in the Sept '09, Dec '09, Mar '10, and Jun '10 quarters respectively versus the year ago periods, its earnings were up just +23% for the latest quarter ended September 30, 2010.
>>> The latest Featured Stock Update with an annotated graph appeared on 9/15/2010. Click here.
View all notes |
Alert me of new notes |
CANSLIM.net Company Profile |
SEC |
Zacks Reports |
StockTalk |
News |
Chart |
Request a new note
C
A N
S L
I M
|
RAX
-
NYSE
Rackspace Hosting Inc
INTERNET - Internet Software and; Services
|
$26.51
|
+0.56
2.16% |
$26.62
|
1,520,773
62.50% of 50 DAV
50 DAV is 2,433,300
|
$27.94
-5.12%
|
9/21/2010
|
$22.84
|
PP = $23.61
|
|
MB = $24.79
|
Most Recent Note - 11/3/2010 5:47:19 PM
G - Finished at a new high close today after a considerable rally to a new all-time high on the prior session with heavy volume. Strength in the Internet - Networking group has been reassuring, especially after a gap up gain last week from F5 Networks (FFIV) after earnings news. RAX is due to report earnings on Monday, November 8, 2010, after the close.
>>> The latest Featured Stock Update with an annotated graph appeared on 9/21/2010. Click here.
View all notes |
Alert me of new notes |
CANSLIM.net Company Profile |
SEC |
Zacks Reports |
StockTalk |
News |
Chart |
Request a new note
C
A N
S L
I M
|
Symbol/Exchange
Company Name
Industry Group |
PRICE |
CHANGE
(%Change) |
Day High |
Volume
(% DAV)
(% 50 day avg vol) |
52 Wk Hi
% From Hi |
Featured
Date |
Price
Featured |
Pivot Featured |
|
Max Buy |
ROVI
-
NASDAQ
Rovi Corp
COMPUTER SOFTWARE andamp; SERVICES - Security Software andamp; Services
|
$51.97
|
+0.25
0.48% |
$51.97
|
953,374
59.09% of 50 DAV
50 DAV is 1,613,300
|
$53.26
-2.42%
|
10/29/2010
|
$49.99
|
PP = $53.10
|
|
MB = $55.76
|
Most Recent Note - 11/1/2010 10:21:35 AM
Y - Gapped up today and touched a new 52-week high. Last week it reported earnings +67% on +21% sales revenues for the quarter ended September 30, 2010 versus the year ago period, its biggest percentage increases in the past 5 quarterly comparisons. Color code was changed to yellow with a new pivot point cited based on its 52-week high plus ten cents. A convincing breakout above its pivot point with volume conviction would trigger a new (or add-on) technical buy signal. Meanwhile, support to watch is defined by its 50 DMA line.
>>> The latest Featured Stock Update with an annotated graph appeared on 10/20/2010. Click here.
View all notes |
Alert me of new notes |
CANSLIM.net Company Profile |
SEC |
Zacks Reports |
StockTalk |
News |
Chart |
Request a new note
C
A N
S L
I M
|
SHOO
-
NASDAQ
Steven Madden Limited
CONSUMER NON-DURABLES - Textile - Apparel Footwear
|
$40.53
|
+0.03
0.07% |
$40.95
|
178,230
56.94% of 50 DAV
50 DAV is 313,000
|
$44.85
-9.63%
|
9/15/2010
|
$38.94
|
PP = $40.27
|
|
MB = $42.28
|
Most Recent Note - 11/2/2010 10:16:31 AM
G - Gapped down today following earnings news. After initial weakness it is up from early lows below its 50 DMA line and prior chart highs in the $40 area. Prompt support is an encouraging sign, and a finish near the session high would be reassuring, meanwhile, a weak close may not bode well and could negate all of the bullish action following its latest technical breakout.
>>> The latest Featured Stock Update with an annotated graph appeared on 9/29/2010. Click here.
View all notes |
Alert me of new notes |
CANSLIM.net Company Profile |
SEC |
Zacks Reports |
StockTalk |
News |
Chart |
Request a new note
C
A N
S L
I M
|
SLW
-
NYSE
Silver Wheaton Corp
METALS and; MINING - Silver
|
$29.61
|
-0.12
-0.40% |
$29.91
|
10,370,072
152.30% of 50 DAV
50 DAV is 6,808,900
|
$29.91
-1.00%
|
8/25/2010
|
$21.40
|
PP = $21.99
|
|
MB = $23.09
|
Most Recent Note - 11/3/2010 6:02:48 PM
G - Closed near the session high for a small loss on above average volume today. Perched near its 52-week high, clear of resistance due to overhead supply, but not near any sound base. The high-ranked leader is one of the strongest names in the Mining - Gold/Silver/Gems group currently included on the Featured Stocks list.
>>> The latest Featured Stock Update with an annotated graph appeared on 10/18/2010. Click here.
View all notes |
Alert me of new notes |
CANSLIM.net Company Profile |
SEC |
Zacks Reports |
StockTalk |
News |
Chart |
Request a new note
C
A N
S L
I M
|
SVR
-
NYSE
Syniverse Holdings Inc
TELECOMMUNICATIONS - Diversified Communication Serv
|
$30.53
|
+0.03
0.10% |
$30.56
|
3,689,838
259.14% of 50 DAV
50 DAV is 1,423,900
|
$31.25
-2.30%
|
9/22/2010
|
$23.60
|
PP = $23.87
|
|
MB = $25.06
|
Most Recent Note - 11/3/2010 1:54:43 PM
G - Holding its ground after a considerable gain on 10/28/10 after news Carlyle Group will buy Syniverse Technologies for $31 per share. Color code was changed to green after spiking above its "max buy" level.
>>> The latest Featured Stock Update with an annotated graph appeared on 9/22/2010. Click here.
View all notes |
Alert me of new notes |
CANSLIM.net Company Profile |
SEC |
Zacks Reports |
StockTalk |
News |
Chart |
Request a new note
C
A N
S L
I M
|
UA
-
NYSE
Under Armour Inc Cl A
CONSUMER NON-DURABLES - Textile - Apparel Clothing
|
$46.43
|
-0.37
-0.79% |
$47.38
|
535,078
69.99% of 50 DAV
50 DAV is 764,500
|
$48.59
-4.45%
|
9/9/2010
|
$39.99
|
PP = $40.10
|
|
MB = $42.11
|
Most Recent Note - 11/3/2010 6:07:06 PM
G - Holding its ground with volume totals cooling, perched near its 52-week high and technically strong. It deserves the benefit of the doubt with a favorable backdrop from the M criteria currently favoring 3 out of 4 growth stocks. However, the weaker earnings increase (under the +25% guideline) raises concerns, fundamentally, with respect to the C criteria. Earlier notes acknowledged the downward turn in annual earnings (A criteria) in FY '08, another fundamental concern with respect to the fact-based investment system.
>>> The latest Featured Stock Update with an annotated graph appeared on 9/9/2010. Click here.
View all notes |
Alert me of new notes |
CANSLIM.net Company Profile |
SEC |
Zacks Reports |
StockTalk |
News |
Chart |
Request a new note
C
A N
S L
I M
|
Symbol/Exchange
Company Name
Industry Group |
PRICE |
CHANGE
(%Change) |
Day High |
Volume
(% DAV)
(% 50 day avg vol) |
52 Wk Hi
% From Hi |
Featured
Date |
Price
Featured |
Pivot Featured |
|
Max Buy |
UFPT
-
NASDAQ
U F P Tech Inc
CONSUMER NON-DURABLES - Packaging and Containers
|
$12.23
|
+0.08
0.66% |
$12.83
|
175,719
283.88% of 50 DAV
50 DAV is 61,900
|
$13.32
-8.18%
|
9/16/2010
|
$11.20
|
PP = $11.69
|
|
MB = $12.27
|
Most Recent Note - 11/3/2010 5:59:57 PM
Y - Closed with a small gain on heavy volume after reporting earnings +59% on +10% sales for the quarter ended September 30, 2010 versus the year ago period. Color code was changed to yellow after its healthy consolidation to its 10 week average. It may be considered buyable up to +5% above its recent high ($13.32 plus 5%) as a secondary buy point following its earlier technical breakout, however a new pivot point is not cited because it did not form a sound new base pattern.
>>> The latest Featured Stock Update with an annotated graph appeared on 9/17/2010. Click here.
View all notes |
Alert me of new notes |
CANSLIM.net Company Profile |
SEC |
Zacks Reports |
StockTalk |
News |
Chart |
Request a new note
C
A N
S L
I M
|
ULTA
-
NASDAQ
Ulta Salon Cosm & Frag
SPECIALTY RETAIL - Specialty Retail, Other
|
$31.67
|
+0.86
2.79% |
$31.85
|
254,164
38.51% of 50 DAV
50 DAV is 660,000
|
$32.68
-3.09%
|
9/3/2010
|
$26.36
|
PP = $25.89
|
|
MB = $27.18
|
Most Recent Note - 11/3/2010 5:57:18 PM
G - Posted a second consecutive gain today on light volume. Its 50 DMA line defines support to watch above prior chart highs in the $26 area, meanwhile it is extended from a sound base pattern.
>>> The latest Featured Stock Update with an annotated graph appeared on 11/1/2010. Click here.
View all notes |
Alert me of new notes |
CANSLIM.net Company Profile |
SEC |
Zacks Reports |
StockTalk |
News |
Chart |
Request a new note
C
A N
S L
I M
|
VIT
-
NYSE
Vanceinfo Tech Inc Ads
COMPUTER SOFTWARE and SERVICES - Business Software and Services
|
$37.78
|
+0.41
1.10% |
$37.78
|
488,185
76.66% of 50 DAV
50 DAV is 636,800
|
$37.98
-0.53%
|
7/8/2010
|
$25.20
|
PP = $26.58
|
|
MB = $27.91
|
Most Recent Note - 11/1/2010 11:03:22 AM
G - Hitting another new all-time high today, extended from any sound base pattern. Meanwhile, its 50 DMA line and recent low ($30.55 on 10/08/10) define important chart support to watch.
>>> The latest Featured Stock Update with an annotated graph appeared on 10/21/2010. Click here.
View all notes |
Alert me of new notes |
CANSLIM.net Company Profile |
SEC |
Zacks Reports |
StockTalk |
News |
Chart |
Request a new note
C
A N
S L
I M
|
WCRX
-
NASDAQ
Warner Chilcott Plc
DRUGS - Drug Manufacturers - Other
|
$23.62
|
-0.18
-0.76% |
$23.87
|
1,621,649
56.20% of 50 DAV
50 DAV is 2,885,700
|
$25.32
-6.71%
|
8/23/2010
|
$21.04
|
PP = $20.84
|
|
MB = $21.88
|
Most Recent Note - 10/29/2010 5:50:28 PM
G - Small loss on above average volume today, a sign of distributional pressure. Holding its ground stubbornly since its "negative reversal" on 10/22/10 was noted. Prior chart highs near $23.50 define near-term support above its 50 DMA line. Its currently low P/E Ratio of 8 (only 60% X S&P 500) might attract the interest of "value" players, but the low P/E and Street estimates calling for only +3% earnings growth in FY '11 raise concerns with respect to its future earnings outlook.
>>> The latest Featured Stock Update with an annotated graph appeared on 10/15/2010. Click here.
View all notes |
Alert me of new notes |
CANSLIM.net Company Profile |
SEC |
Zacks Reports |
StockTalk |
News |
Chart |
Request a new note
C
A N
S L
I M
|