You are not logged in.
This means you
CAN ONLY VIEW reports that were published prior to Monday, February 26, 2024.
You
MUST UPGRADE YOUR MEMBERSHIP if you want to see any current reports.
AFTER MARKET UPDATE - MONDAY, OCTOBER 29TH, 2018
Previous After Market Report Next After Market Report >>>
|
|
|
|
DOW |
-245.39 |
24,442.92 |
-0.99% |
|
Volume |
1,078,085,250 |
-4% |
|
Volume |
2,679,699,900 |
-9% |
|
NASDAQ |
-116.92 |
7,050.29 |
-1.63% |
|
Advancers |
1,275 |
43% |
|
Advancers |
1,263 |
41% |
|
S&P 500 |
-17.44 |
2,641.25 |
-0.66% |
|
Decliners |
1,723 |
57% |
|
Decliners |
1,834 |
59% |
|
Russell 2000 |
-6.51 |
1,477.31 |
-0.44% |
|
52 Wk Highs |
19 |
|
|
52 Wk Highs |
24 |
|
|
S&P 600 |
-2.06 |
930.09 |
-0.22% |
|
52 Wk Lows |
403 |
|
|
52 Wk Lows |
348 |
|
|
Since October 10th this commentary has repeatedly warned investors IN BOLD that the market is in a correction, which is a time to reduce exposure to stocks. The Featured Stocks list has been trimmed considerably as weakness in former leaders was noted. Please let us know if you have any input on how we can make it more clear that this is a time for investors to be defensive. Use our inquiry form or call the Help Line 954-785-1121.
RULE #1 is to always limit your losses. Best regards, Ken Gruneisen
|
 |
Indices Reversed Early Gains and Ended Lower Yet Again
Kenneth J. Gruneisen - Passed the CAN SLIM® Master's Exam
Stocks finished lower Monday. The Dow fell 245 points to 24442, while the S&P 500 declined 17 points to 2641. The Nasdaq Composite lost 116 points to 7050. Behind the losses the volume totals reported were lighter on the NYSE and on the Nasdaq exchange versus the prior session. Decliners led advancers by a 3-2 margin on the NYSE and on the Nasdaq exchange. There were only 4 high-ranked companies from the Leaders List that made new 52-week highs and were listed on the BreakOuts Page, versus 2 on the prior session, as market leadership remained very elusive. New 52-week lows totals easily outnumbered new 52-week highs on the NYSE and Nasdaq exchange. Recent reports have noted that the major indices (M criteria) have shown action indicative of a market correction while leadership disappeared. During market corrections investors should have a bias toward selling stocks on a case-by-case basis as technical sell signals occur, raising cash levels while reducing market exposure. The Featured Stocks Page provides the most timely analysis on high-ranked leaders. Charts used courtesy of www.stockcharts.com
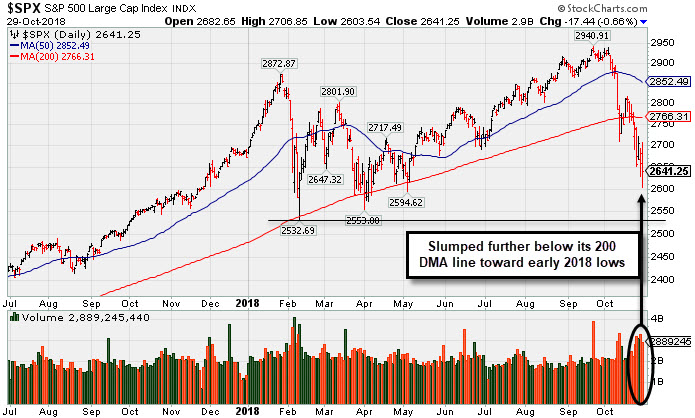
PICTURED: The S&P 500 Index and other major indices fell further on Monday. Technically, the market remains in a "correction" under the fact-based investment system. Members have been reminded repeatedly that new buying efforts are against the rules until a convincing follow-through day occurs. A "follow-through day" of solid gains (at least +1%) from one or more of the major indices, backed by higher volume, and coupled with a leadership expansion (increase in new 52-week highs), are all of the necessary elements required to confirm a new rally. Until then, patience and discipline are paramount.
The major averages gave up early session gains amid a resurgence of trade concerns. A Bloomberg report signaled the Trump administration could announce tariffs on all remaining Chinese imports if nothing comes from next month’s trade discussions between President Trump and Chinese President Xi Jinping.
On the data front, the core PCE Deflator, the Fed’s preferred proxy of inflation, increased 2% year-over-year in September, in line with the central bank’s target. A separate report showed personal spending advanced for the seventh consecutive month, up 0.4% in September. However, personal income rose at the slowest pace since June 2017 during that same period.
Six of 11 S&P 500 sectors closed in negative territory with Tech shares and Industrials leading decliners. The oft-cited “FAANG” group weighed on the market, with Amazon (AMZN -6.33%) and Netflix (NFLX -5.00%) both sinking quickly. Boeing (BA -6.59%) weighed on the Dow. In M&A news, Red Hat (RHT +45.38%) surged after International Business Machines (IBM -4.13%) announced it acquired the software provider for $34 billion.
Treasuries were little changed with the yield on the 10-year note flat at 3.08%. In commodities, WTI crude dropped 1.5% to $66.55/barrel. COMEX gold was down 0.7% to $1,224.50/ounce amid a stronger dollar. |
 Kenneth J. Gruneisen started out as a licensed stockbroker in August 1987, a couple of months prior to the historic stock market crash that took the Dow Jones Industrial Average down -22.6% in a single day. He has published daily fact-based fundamental and technical analysis on high-ranked stocks online for two decades. Through FACTBASEDINVESTING.COM, Kenneth provides educational articles, news, market commentary, and other information regarding proven investment systems that work in good times and bad.
Comments contained in the body of this report are technical opinions only and are not necessarily those of Gruneisen Growth Corp. The material herein has been obtained from sources believed to be reliable and accurate, however, its accuracy and completeness cannot be guaranteed. Our firm, employees, and customers may effect transactions, including transactions contrary to any recommendation herein, or have positions in the securities mentioned herein or options with respect thereto. Any recommendation contained in this report may not be suitable for all investors and it is not to be deemed an offer or solicitation on our part with respect to the purchase or sale of any securities. |
|
 |
Financials Rose But Retail, Tech, and Commodity-Linked Groups Fell
Kenneth J. Gruneisen - Passed the CAN SLIM® Master's Exam
The Retail Index ($RLX -2.43%) lost ground and weighed on the major indices while the Bank Index ($BKX +1.35%) and Broker/Dealer Index ($XBD +0.17%) both managed to post gains. The tech sector had a negative bias as the Biotech Index ($BTK -1.78%), Semiconductor Index ($SOX -1.11%), and the Networking Index ($NWX -1.73%) each posted solid losses. Commodity-linked groups fell as the Integrated Oil Index ($XOI -1.94%) and the Oil Services Index ($OSX -4.27%) both outpaced the Gold & Silver Index ($XAU -0.71%) to the downside.
Charts courtesy of www.stockcharts.com
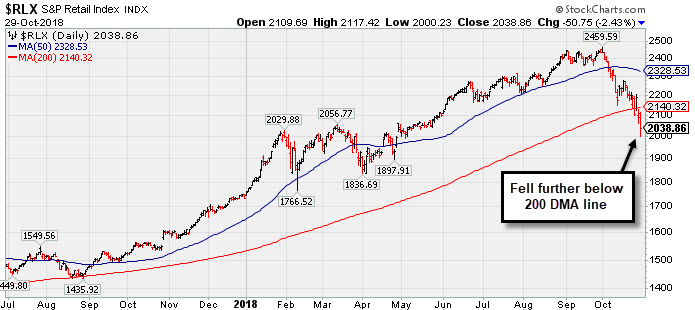 PICTURED: The Retail Index ($RLX -2.43%) slumped further below its 200-day moving average (DMA) line toward prior 2018 lows.
| Oil Services |
$OSX |
117.51 |
-5.24 |
-4.27% |
-21.42% |
| Integrated Oil |
$XOI |
1,323.05 |
-26.18 |
-1.94% |
-0.94% |
| Semiconductor |
$SOX |
1,140.15 |
-12.85 |
-1.11% |
-9.01% |
| Networking |
$NWX |
492.91 |
-8.66 |
-1.73% |
+0.49% |
| Broker/Dealer |
$XBD |
250.43 |
+0.43 |
+0.17% |
-5.58% |
| Retail |
$RLX |
2,038.86 |
-50.75 |
-2.43% |
+17.60% |
| Gold & Silver |
$XAU |
64.70 |
-0.47 |
-0.72% |
-24.12% |
| Bank |
$BKX |
96.10 |
+1.27 |
+1.34% |
-9.94% |
| Biotech |
$BTK |
4,455.92 |
-80.94 |
-1.78% |
+5.54% |
|
|
|
 |
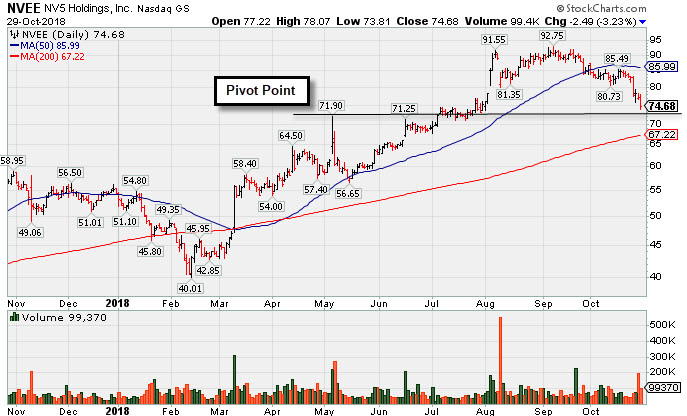
Slumped Further With Losses Backed by Above Average Volume
Kenneth J. Gruneisen - Passed the CAN SLIM® Master's Exam
N V 5 Global Inc (NVEE -$2.49 or -3.23% to $74.68) churned above average volume again today as it suffered another damaging loss. It will be dropped from the Featured Stocks list tonight. A rebound above the 50-day moving average (DMA) line ($85.99) is needed for its outlook to improve.
NVEE priced a new Public Offering on 8/09/18. Such offerings often hinder near-term price progress, yet they tend to attract greater institutional ownership interest. It was last shown in this FSU section on 10/08/18 with an annotated graph under the headline, "Recently Slumped Below 50-Day Moving Average Line". It was highlighted in yellow with new pivot point cited based on its 10/31/17 high plus 10 cents in the 4/09/18 mid-day report (read here).
Recently it reported earnings +63% on +24% sales revenues for the Jun '18 quarter, continuing its strong earnings track record with the 5th quarter in a row above the +25% minimum earnings guideline (C criteria) of the fact-based investment system. Its strong annual earnings (A criteria) history was previously noted.
This Hollywood, FL based Commercial Services / Consulting firm completed new Public Offerings on 5/22/15 and on 5/13/16. Today there still are only 12.6 million shares outstanding (S criteria), which can contribute to greater price volatility in the event of institutional buying or selling. The number of top-rated funds owning its shares rose from 186 in Jun '17 to to 242 in Sep '18, a reassuring sign concerning the I criteria. |
|
|
Color Codes Explained :
Y - Better candidates highlighted by our
staff of experts.
G - Previously featured
in past reports as yellow but may no longer be buyable under the
guidelines.
***Last / Change / Volume data in this table is the closing quote data***
Symbol/Exchange
Company Name
Industry Group |
PRICE |
CHANGE
(%Change) |
Day High |
Volume
(% DAV)
(% 50 day avg vol) |
52 Wk Hi
% From Hi |
Featured
Date |
Price
Featured |
Pivot Featured |
|
Max Buy |
MPX
-
NYSE
Marine Products Corp
AUTOMOTIVE - Recreational Vehicles
|
$20.41
|
+0.15
0.74% |
$21.18
|
56,854
149.62% of 50 DAV
50 DAV is 38,000
|
$24.82
-17.77%
|
10/24/2018
|
$23.00
|
PP = $24.92
|
|
MB = $26.17
|
Most Recent Note - 10/26/2018 5:44:01 PM
G - Color code is changed to green after slumping further below its 50 DMA line ($21.50) today with a 3rd volume-driven loss in the span of 4 sessions. A prompt rebound above the 50 DMA line is needed for its outlook to improve. Finished weak after highlighted in yellow with pivot point cited based on its 9/12/18 high plus 10 cents in the 10/24/18 mid-day report. See the latest FSU analysis for more details and an annotated graph.
>>> FEATURED STOCK ARTICLE : Weak Finish Amid Widely Negative Market Environment - 10/24/2018 |
View all notes |
Set NEW NOTE alert |
Company Profile |
SEC
News |
Chart |
Request a new note
C
A
S
I |
GMED
-
NYSE
Globus Medical Inc Cl A
CHEMICALS - Specialty Chemicals
|
$52.36
|
+0.22
0.42% |
$53.43
|
632,541
96.87% of 50 DAV
50 DAV is 653,000
|
$57.55
-9.02%
|
9/26/2018
|
$56.11
|
PP = $57.65
|
|
MB = $60.53
|
Most Recent Note - 10/25/2018 5:54:22 PM
G - Sputtering below its 50 DMA line ($52.91) after recent volume-driven losses hurt its outlook. A rebound and subsequent gains above the pivot point backed by more than +40% above average volume are needed to trigger a proper technical buy signal.
>>> FEATURED STOCK ARTICLE : Consolidating After Rally at 200-Day Moving Average Line - 10/22/2018 |
View all notes |
Set NEW NOTE alert |
Company Profile |
SEC
News |
Chart |
Request a new note
C
A
S
I |
ZBRA
-
NASDAQ
Zebra Tech Corp Cl A
COMPUTER HARDWARE - Computer Peripherals
|
$155.48
|
-5.12
-3.19% |
$165.13
|
458,556
120.67% of 50 DAV
50 DAV is 380,000
|
$179.47
-13.37%
|
8/7/2018
|
$164.26
|
PP = $161.82
|
|
MB = $169.91
|
 Most Recent Note - 10/29/2018 5:59:10 PM
G - Suffered another damaging loss today with above average volume. Met resistance after rebounding to its 50 DMA line ($168), and overhead supply remains up to the $179 level. Found support in recent weeks after a pullback near its 200 DMA line.
>>> FEATURED STOCK ARTICLE : Zebra Tech Sputtering Near 50-Day Moving Average - 10/23/2018 |
View all notes |
Set NEW NOTE alert |
Company Profile |
SEC
News |
Chart |
Request a new note
C
A
S
I |
CME
-
NASDAQ
C M E Group Inc
DIVERSIFIED SERVICES - Business/Management Services
|
$179.39
|
+0.75
0.42% |
$181.98
|
1,509,510
101.17% of 50 DAV
50 DAV is 1,492,000
|
$183.79
-2.39%
|
10/4/2018
|
$179.29
|
PP = $177.45
|
|
MB = $186.32
|
Most Recent Note - 10/26/2018 5:40:14 PM
Y - Remains above its 50 DMA line ($174.79) after recently reporting earnings +22% on +2% sales revenues for the Sep '18 quarter, below the +25% minimum earnings guideline (C criteria), raising fundamental concerns. Broad market weakness (M criteria) is also a serious concern. The 50 DMA line and prior low ($170.04 on 9/28/18) define important near-term support. See the latest FSU analysis for more details and a new annotated graph.
>>> FEATURED STOCK ARTICLE : Perched Near High After Latest Earnings Report Below +25% Minimum - 10/26/2018 |
View all notes |
Set NEW NOTE alert |
Company Profile |
SEC
News |
Chart |
Request a new note
C
A
S
I |
DPZ
-
NYSE
Dominos Pizza Inc
Retail-Restaurants
|
$256.49
|
-4.75
-1.82% |
$268.27
|
570,511
102.61% of 50 DAV
50 DAV is 556,000
|
$305.34
-16.00%
|
8/13/2018
|
$288.60
|
PP = $293.91
|
|
MB = $308.61
|
Most Recent Note - 10/29/2018 6:01:35 PM
G - Reversed early gains and suffered another loss today on near average volume testing its 200 DMA line ($256.20). A subsequent rebound above the 50 DMA line ($282.42) is needed for its outlook to improve. The prior low ($253.63 on 7/31/18) and 200 DMA line define important near-term support to watch. Reported earnings +54% on +22% sales revenues for the Sep '18 quarter, continuing its strong earnings track record.
>>> FEATURED STOCK ARTICLE : Sank Below 50 DMA Line Ahead of Earnings News - 10/15/2018 |
View all notes |
Set NEW NOTE alert |
Company Profile |
SEC
News |
Chart |
Request a new note
C
A
S
I |
Symbol/Exchange
Company Name
Industry Group |
PRICE |
CHANGE
(%Change) |
Day High |
Volume
(% DAV)
(% 50 day avg vol) |
52 Wk Hi
% From Hi |
Featured
Date |
Price
Featured |
Pivot Featured |
|
Max Buy |
FIVE
-
NASDAQ
Five Below Inc
Retail-DiscountandVariety
|
$111.85
|
+1.48
1.34% |
$115.24
|
636,162
64.91% of 50 DAV
50 DAV is 980,000
|
$136.13
-17.84%
|
7/6/2018
|
$98.90
|
PP = $104.09
|
|
MB = $109.29
|
Most Recent Note - 10/25/2018 5:59:33 PM
G - A rebound above the 50 DMA line ($120) still is needed for its outlook to improve. Sputtering above the prior high ($109.09 on 7/19/18) which defines the next important support level to watch. See the latest FSU analysis for more details and a new annotated graph.
>>> FEATURED STOCK ARTICLE : Sputtering Below 50-Day Moving Average Near Prior High - 10/25/2018 |
View all notes |
Set NEW NOTE alert |
Company Profile |
SEC
News |
Chart |
Request a new note
C
A
S
I |
NVEE
-
NASDAQ
N V 5 Global Inc
Comml Svcs-Consulting
|
$74.68
|
-2.49
-3.23% |
$78.07
|
99,370
132.49% of 50 DAV
50 DAV is 75,000
|
$92.75
-19.48%
|
6/15/2018
|
$7,070.00
|
PP = $72.00
|
|
MB = $75.60
|
Most Recent Note - 10/29/2018 5:56:43 PM
Suffered another damaging volume-driven loss today. A rebound above the 50 DMA line ($85.99) is needed for its outlook to improve. It will be dropped from the Featured Stocks list tonight. See the latest FSU analysis for more details and a new annotated graph.
>>> FEATURED STOCK ARTICLE : Slumped Further With Losses Backed by Above Average Volume - 10/29/2018 |
View all notes |
Set NEW NOTE alert |
Company Profile |
SEC
News |
Chart |
Request a new note
C
A
S
I |
HQY
-
NASDAQ
Healthequity Inc
COMPUTER SOFTWARE and SERVICES - Healthcare Information Service
|
$84.93
|
-0.38
-0.45% |
$87.60
|
781,980
95.13% of 50 DAV
50 DAV is 822,000
|
$99.99
-15.06%
|
8/13/2018
|
$82.39
|
PP = $83.44
|
|
MB = $87.61
|
Most Recent Note - 10/25/2018 6:00:53 PM
G - Posted a big gain today with higher (but still below average) volume. A rebound above the 50 DMA line ($90.36) is needed for its outlook to improve.
>>> FEATURED STOCK ARTICLE : Below 50-Day Moving Average Which May Act as Resistance - 10/16/2018 |
View all notes |
Set NEW NOTE alert |
Company Profile |
SEC
News |
Chart |
Request a new note
C
A
S
I |
OLLI
-
NASDAQ
Ollie's Bargain Outlet
Retail-DiscountandVariety
|
$88.67
|
+0.42
0.48% |
$91.60
|
765,912
114.49% of 50 DAV
50 DAV is 669,000
|
$97.61
-9.16%
|
7/12/2018
|
$74.43
|
PP = $77.60
|
|
MB = $81.48
|
Most Recent Note - 10/25/2018 5:52:52 PM
G - Still finding support near the 50 DMA line ($88.40) and above the recent low ($84.66 on 10/11/18). Well above prior highs in the $77 area. Fundamentals remain strong.
>>> FEATURED STOCK ARTICLE : Encountered Distributional Pressure After a Great Rally - 10/9/2018 |
View all notes |
Set NEW NOTE alert |
Company Profile |
SEC
News |
Chart |
Request a new note
C
A
S
I |
|
|
|
THESE ARE NOT BUY RECOMMENDATIONS!
Comments contained in the body of this report are technical
opinions only. The material herein has been obtained
from sources believed to be reliable and accurate, however,
its accuracy and completeness cannot be guaranteed.
This site is not an investment advisor, hence it does
not endorse or recommend any securities or other investments.
Any recommendation contained in this report may not
be suitable for all investors and it is not to be deemed
an offer or solicitation on our part with respect to
the purchase or sale of any securities. All trademarks,
service marks and trade names appearing in this report
are the property of their respective owners, and are
likewise used for identification purposes only.
This report is a service available
only to active Paid Premium Members.
You may opt-out of receiving report notifications
at any time. Questions or comments may be submitted
by writing to Premium Membership Services 665 S.E. 10 Street, Suite 201 Deerfield Beach, FL 33441-5634 or by calling 1-800-965-8307
or 954-785-1121.
|
|
|