***Last / Change / Volume data in this table is the closing quote data***
Symbol/Exchange
Company Name
Industry Group |
PRICE |
CHANGE
(%Change) |
Day High |
Volume
(% DAV)
(% 50 day avg vol) |
52 Wk Hi
% From Hi |
Featured
Date |
Price
Featured |
Pivot Featured |
|
Max Buy |
ABV
-
NYSE
Comp De Bebidas Adr
FOOD and BEVERAGE - Beverages - Brewers
|
$133.65
|
-3.19
-2.33% |
$136.58
|
1,162,798
174.59% of 50 DAV
50 DAV is 666,000
|
$143.53
-6.88%
|
6/29/2010
|
$104.74
|
PP = $109.33
|
|
MB = $114.80
|
 Most Recent Note - 10/27/2010 4:57:07 PM
G - Down today with even higher above average volume. Extended from a sound base, its 50 DMA line ($121.90 now) defines support.
>>> The latest Featured Stock Update with an annotated graph appeared on 10/11/2010. Click here.
View all notes |
Alert me of new notes |
CANSLIM.net Company Profile |
SEC |
Zacks Reports |
StockTalk |
News |
Chart |
Request a new note
C
A N
S L
I M


|
ARUN
-
NASDAQ
Aruba Networks Inc
COMPUTER HARDWARE - Networking andamp; Communication Dev
|
$21.86
|
+1.62
8.00% |
$21.93
|
4,002,827
160.66% of 50 DAV
50 DAV is 2,491,500
|
$22.80
-4.12%
|
8/30/2010
|
$18.12
|
PP = $18.51
|
|
MB = $19.44
|
Most Recent Note - 10/27/2010 5:05:51 PM
G - Considerable gain today with above average volume, finishing near the session high just 38 cents off its best-ever close. Found great support near its 50 DMA line.
>>> The latest Featured Stock Update with an annotated graph appeared on 10/26/2010. Click here.
View all notes |
Alert me of new notes |
CANSLIM.net Company Profile |
SEC |
Zacks Reports |
StockTalk |
News |
Chart |
Request a new note
C
A N
S L
I M
|
BIDU
-
NASDAQ
Baidu Inc Ads
INTERNET - Internet Information Providers
|
$112.87
|
+0.25
0.22% |
$113.46
|
10,157,146
91.39% of 50 DAV
50 DAV is 11,113,600
|
$113.36
-0.43%
|
9/17/2010
|
$85.73
|
PP = $88.42
|
|
MB = $92.84
|
Most Recent Note - 10/26/2010 5:31:26 PM
G - Up today with above average volume for a 4th consecutive gain and another new all-time high. The nearest support is recent chart lows near $95-96 which come into play above its 50 DMA line.
>>> The latest Featured Stock Update with an annotated graph appeared on 10/7/2010. Click here.
View all notes |
Alert me of new notes |
CANSLIM.net Company Profile |
SEC |
Zacks Reports |
StockTalk |
News |
Chart |
Request a new note
C
A N
S L
I M
|
CACC
-
NASDAQ
Credit Acceptance Corp
FINANCIAL SERVICES - Credit Services
|
$58.33
|
-0.34
-0.58% |
$59.19
|
11,103
36.76% of 50 DAV
50 DAV is 30,200
|
$63.45
-8.07%
|
7/29/2010
|
$52.04
|
PP = $54.07
|
|
MB = $56.77
|
Most Recent Note - 10/26/2010 10:25:16 AM
G - It is hovering -8% off its 52-week high and its 50 DMA line has acted as resistance while volume totals have been cooling noticeably in recent weeks. Reports earnings on Monday, November 1, 2010, after the market close. Its $55.07 low (on 10/04/10) defines the nearest chart support level to watch above its long ago chart highs ($53.97).
>>> The latest Featured Stock Update with an annotated graph appeared on 9/30/2010. Click here.
View all notes |
Alert me of new notes |
CANSLIM.net Company Profile |
SEC |
Zacks Reports |
StockTalk |
News |
Chart |
Request a new note
C
A N
S L
I M
|
CMG
-
NYSE
Chipotle Mexican Grill
LEISURE - Restaurants
|
$212.30
|
-0.56
-0.26% |
$212.33
|
814,721
112.56% of 50 DAV
50 DAV is 723,800
|
$215.38
-1.43%
|
9/1/2010
|
$158.31
|
PP = $155.52
|
|
MB = $163.30
|
Most Recent Note - 10/26/2010 5:26:24 PM
G - Hit a new all-time high today with a gain backed by 2 times average volume, getting more extended from a sound base. Its 50 DMA line defines chart support above its prior highs in the $155 area.
>>> The latest Featured Stock Update with an annotated graph appeared on 9/1/2010. Click here.
View all notes |
Alert me of new notes |
CANSLIM.net Company Profile |
SEC |
Zacks Reports |
StockTalk |
News |
Chart |
Request a new note
C
A N
S L
I M
|
Symbol/Exchange
Company Name
Industry Group |
PRICE |
CHANGE
(%Change) |
Day High |
Volume
(% DAV)
(% 50 day avg vol) |
52 Wk Hi
% From Hi |
Featured
Date |
Price
Featured |
Pivot Featured |
|
Max Buy |
CTRP
-
NASDAQ
Ctrip.Com Intl Ltd Adr
LEISURE - Resorts and Casinos
|
$50.53
|
-0.76
-1.48% |
$51.11
|
1,837,470
111.75% of 50 DAV
50 DAV is 1,644,200
|
$52.90
-4.48%
|
9/24/2010
|
$46.75
|
PP = $47.11
|
|
MB = $49.47
|
Most Recent Note - 10/25/2010 5:10:24 PM
G - Gain today with above average volume, rallying further beyond its "max buy" level. Prior highs in the $47 area define support to watch above its 50 DMA line.
>>> The latest Featured Stock Update with an annotated graph appeared on 9/28/2010. Click here.
View all notes |
Alert me of new notes |
CANSLIM.net Company Profile |
SEC |
Zacks Reports |
StockTalk |
News |
Chart |
Request a new note
C
A N
S L
I M
|
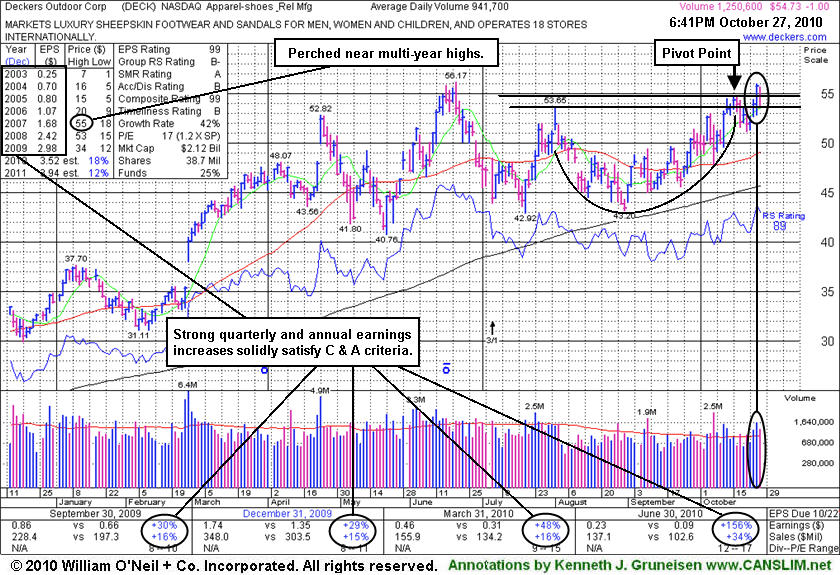
DECK
-
NASDAQ
Deckers Outdoor Corp
CONSUMER NON-DURABLES - Textile - Apparel Footwear
|
$54.73
|
-1.00
-1.79% |
$55.57
|
1,278,542
138.84% of 50 DAV
50 DAV is 920,900
|
$56.12
-2.47%
|
10/27/2010
|
$54.16
|
PP = $54.86
|
|
MB = $57.60
|
Most Recent Note - 10/27/2010 12:51:38 PM
Y - Within close striking distance of its 52-week high, pulling back today. Reporting earnings on Thursday, October 28, 2010. Color code is changed to yellow after its a breakout from a saucer-with-handle pattern with above average volume on the prior session. Pivot point cited is based upon its 10/15/10 high plus ten cents. It was dropped from the Featured Stocks list on 7/20/10 and found support above its 200 DMA line in the interim. Do not be confused when reviewing prior reports after the stock split 3:1 effective as of 7/06/10.
>>> The latest Featured Stock Update with an annotated graph appeared on 10/27/2010. Click here.
View all notes |
Alert me of new notes |
CANSLIM.net Company Profile |
SEC |
Zacks Reports |
StockTalk |
News |
Chart |
Request a new note
C
A N
S L
I M
|
EBIX
-
NASDAQ
Ebix Inc
COMPUTER SOFTWARE and SERVICES - Business Software and Services
|
$24.64
|
+0.69
2.88% |
$24.74
|
1,207,968
206.88% of 50 DAV
50 DAV is 583,900
|
$25.61
-3.79%
|
9/23/2010
|
$21.78
|
PP = $22.74
|
|
MB = $23.88
|
Most Recent Note - 10/27/2010 12:55:36 PM
G - Churning near prior highs today while up for a 3rd consecutive session. Support to watch is its 50 DMA line ($21.34 now).
>>> The latest Featured Stock Update with an annotated graph appeared on 9/24/2010. Click here.
View all notes |
Alert me of new notes |
CANSLIM.net Company Profile |
SEC |
Zacks Reports |
StockTalk |
News |
Chart |
Request a new note
C
A N
S L
I M
|
FFIV
-
NASDAQ
F 5 Networks Inc
INTERNET - Internet Software and Services
|
$117.58
|
+15.04
14.67% |
$118.99
|
9,952,566
449.63% of 50 DAV
50 DAV is 2,213,500
|
$112.05
4.94%
|
6/16/2010
|
$74.50
|
PP = $74.10
|
|
MB = $77.81
|
Most Recent Note - 10/27/2010 1:15:40 PM
G - Gapped up today for a considerable gain and a new high while posting its 6th consecutive gain with ever-increasing volume. Reported +58% earnings on +45% sales revenues for the period ended September 30, 2010 versus the year ago period. It may go on to produce more climactic gains, however it did not form a sound new base and may be considered "late stage" after its considerable rally this year.
>>> The latest Featured Stock Update with an annotated graph appeared on 9/13/2010. Click here.
View all notes |
Alert me of new notes |
CANSLIM.net Company Profile |
SEC |
Zacks Reports |
StockTalk |
News |
Chart |
Request a new note
C
A N
S L
I M
|
FOSL
-
NASDAQ
Fossil Inc
CONSUMER DURABLES - Recreational Goods, Other
|
$58.51
|
+0.57
0.98% |
$58.56
|
577,432
76.88% of 50 DAV
50 DAV is 751,100
|
$58.75
-0.41%
|
10/20/2010
|
$54.12
|
PP = $55.61
|
|
MB = $58.39
|
Most Recent Note - 10/27/2010 5:19:38 PM
G - Color code is changed to green after inching above its "max buy" level with a 6th consecutive gain. Volume conviction has been lacking while wedging to new all-time highs. The nearby chart support level to watch is its 50 DMA line.
>>> The latest Featured Stock Update with an annotated graph appeared on 10/5/2010. Click here.
View all notes |
Alert me of new notes |
CANSLIM.net Company Profile |
SEC |
Zacks Reports |
StockTalk |
News |
Chart |
Request a new note
C
A N
S L
I M
|
Symbol/Exchange
Company Name
Industry Group |
PRICE |
CHANGE
(%Change) |
Day High |
Volume
(% DAV)
(% 50 day avg vol) |
52 Wk Hi
% From Hi |
Featured
Date |
Price
Featured |
Pivot Featured |
|
Max Buy |
HMSY
-
NASDAQ
H M S Holdings Corp
COMPUTER SOFTWARE and SERVICES - Healthcare Information Service
|
$59.31
|
-0.99
-1.64% |
$60.00
|
470,488
275.46% of 50 DAV
50 DAV is 170,800
|
$62.91
-5.72%
|
9/27/2010
|
$57.97
|
PP = $58.36
|
|
MB = $61.28
|
Most Recent Note - 10/27/2010 11:24:57 AM
Y - Slumping near prior highs in the $58 area and its 50 DMA line previously noted as chart support levels to watch. Since a "negative reversal" on 10/15/10 after hitting a new all-time high, its waning Relative Strength rating has raised concerns. Scheduled to report earnings after Thursday's close.
>>> The latest Featured Stock Update with an annotated graph appeared on 9/27/2010. Click here.
View all notes |
Alert me of new notes |
CANSLIM.net Company Profile |
SEC |
Zacks Reports |
StockTalk |
News |
Chart |
Request a new note
C
A N
S L
I M
|
HS
-
NYSE
Healthspring Inc
HEALTH SERVICES - Health Care Plans
|
$26.54
|
-1.46
-5.21% |
$27.63
|
601,398
85.86% of 50 DAV
50 DAV is 700,400
|
$28.10
-5.53%
|
8/27/2010
|
$19.91
|
PP = $19.75
|
|
MB = $20.74
|
Most Recent Note - 10/27/2010 11:18:24 AM
G - Pulling back on light volume after recently wedging up to new all-time highs with gains on light volume. After 5 consecutive weekly gains, it has not formed a recent sound base. Support to watch is its 50 DMA line (now $23.90). Earnings news is due on Thursday, October 28, 2010.
>>> The latest Featured Stock Update with an annotated graph appeared on 10/22/2010. Click here.
View all notes |
Alert me of new notes |
CANSLIM.net Company Profile |
SEC |
Zacks Reports |
StockTalk |
News |
Chart |
Request a new note
C
A N
S L
I M
|
IGTE
-
NASDAQ
Igate Corp
COMPUTER SOFTWARE and SERVICES - Information Technology Service
|
$20.31
|
+0.06
0.30% |
$20.68
|
575,865
119.08% of 50 DAV
50 DAV is 483,600
|
$20.63
-1.55%
|
10/26/2010
|
$17.29
|
PP = $19.55
|
|
MB = $20.53
|
Most Recent Note - 10/26/2010 10:15:18 AM
Y - Considerable gain today with volume running at an above average pace as it has rallied to a new 52-week high. New pivot point is cited based on its 9/20/10 high plus ten cents, after more than 5 weeks of consolidation just above its 50 DMA line. A strong close on heavier volume would be a reassuring sign of institutional buying demand. More damaging losses leading to violation of its 50 DMA line or recent chart low ($16.75 on 10/07/10) would raise concerns and trigger technical sell signals.
>>> The latest Featured Stock Update with an annotated graph appeared on 9/10/2010. Click here.
View all notes |
Alert me of new notes |
CANSLIM.net Company Profile |
SEC |
Zacks Reports |
StockTalk |
News |
Chart |
Request a new note
C
A N
S L
I M
|
JOBS
-
NASDAQ
Fifty One Job Inc Ads
DIVERSIFIED SERVICES - Staffing and; Outsourcing Service
|
$44.42
|
+0.02
0.05% |
$45.05
|
172,449
90.48% of 50 DAV
50 DAV is 190,600
|
$47.48
-6.44%
|
10/13/2010
|
$42.07
|
PP = $40.60
|
|
MB = $42.63
|
Most Recent Note - 10/26/2010 5:24:52 PM
G - Wider intra-day price swings are a sign of uncertainty, meanwhile prior highs in the $40 area define support above its 50 DMA line.
>>> The latest Featured Stock Update with an annotated graph appeared on 9/16/2010. Click here.
View all notes |
Alert me of new notes |
CANSLIM.net Company Profile |
SEC |
Zacks Reports |
StockTalk |
News |
Chart |
Request a new note
C
A N
S L
I M
|
LFT
-
NYSE
Longtop Financl Tech Ads
COMPUTER SOFTWARE and SERVICES - Business Software and Services
|
$37.51
|
-0.94
-2.44% |
$38.51
|
377,449
76.10% of 50 DAV
50 DAV is 496,000
|
$41.77
-10.20%
|
10/14/2010
|
$39.97
|
PP = $41.87
|
|
MB = $43.96
|
Most Recent Note - 10/27/2010 4:54:20 PM
G - Slumped near its 50 DMA line - an important level to watch. Gains with above average volume for a new high close are needed for its outlook to improve, technically.
>>> The latest Featured Stock Update with an annotated graph appeared on 10/14/2010. Click here.
View all notes |
Alert me of new notes |
CANSLIM.net Company Profile |
SEC |
Zacks Reports |
StockTalk |
News |
Chart |
Request a new note
C
A N
S L
I M
|
Symbol/Exchange
Company Name
Industry Group |
PRICE |
CHANGE
(%Change) |
Day High |
Volume
(% DAV)
(% 50 day avg vol) |
52 Wk Hi
% From Hi |
Featured
Date |
Price
Featured |
Pivot Featured |
|
Max Buy |
LULU
-
NASDAQ
Lululemon Athletica
MANUFACTURING - Textile Manufacturing
|
$44.66
|
-0.99
-2.17% |
$45.54
|
879,307
73.52% of 50 DAV
50 DAV is 1,196,000
|
$48.45
-7.82%
|
10/8/2010
|
$47.66
|
PP = $46.67
|
|
MB = $49.00
|
Most Recent Note - 10/27/2010 5:17:07 PM
Y - Down today with lighter volume. Its color code was changed to yellow while hovering near old highs in the $45-46 area. Recent lows in the $42 area define support to watch above its 50 DMA line. Subsequent gains to new highs with volume would be welcomed as a confirming sign of serious institutional accumulation.
>>> The latest Featured Stock Update with an annotated graph appeared on 10/8/2010. Click here.
View all notes |
Alert me of new notes |
CANSLIM.net Company Profile |
SEC |
Zacks Reports |
StockTalk |
News |
Chart |
Request a new note
C
A N
S L
I M
|
MRX
-
NYSE
Medicis Pharmaceut Cl A
DRUGS - Biotechnology
|
$30.04
|
-0.42
-1.38% |
$30.45
|
997,657
92.32% of 50 DAV
50 DAV is 1,080,600
|
$30.94
-2.91%
|
8/12/2010
|
$26.88
|
PP = $26.71
|
|
MB = $28.05
|
Most Recent Note - 10/26/2010 6:03:22 PM
G - Consolidating in a tight trading range in recent weeks just above its 50 DMA line. That short-term average and recent chart lows in the $29 area define important support.
>>> The latest Featured Stock Update with an annotated graph appeared on 10/4/2010. Click here.
View all notes |
Alert me of new notes |
CANSLIM.net Company Profile |
SEC |
Zacks Reports |
StockTalk |
News |
Chart |
Request a new note
C
A N
S L
I M
|
MWIV
-
NASDAQ
M W I Veterinary Supply
HEALTH SERVICES - Medical Instruments and; Supplies
|
$57.89
|
+0.95
1.67% |
$57.90
|
104,423
173.17% of 50 DAV
50 DAV is 60,300
|
$59.50
-2.71%
|
7/29/2010
|
$52.05
|
PP = $52.09
|
|
MB = $54.69
|
Most Recent Note - 10/27/2010 5:14:44 PM
G - Closed at the session high with a gain backed by above average volume today. Due to announce earnings in early-November. Recently found support near its 50 DMA line, but any subsequent violation of that classic chart support level or breach of recent lows would raise greater concerns.
>>> The latest Featured Stock Update with an annotated graph appeared on 9/7/2010. Click here.
View all notes |
Alert me of new notes |
CANSLIM.net Company Profile |
SEC |
Zacks Reports |
StockTalk |
News |
Chart |
Request a new note
C
A N
S L
I M
|
NEM
-
NYSE
Newmont Mining Corp
METALS and MINING - Gold
|
$58.40
|
-1.06
-1.78% |
$59.06
|
8,497,930
133.74% of 50 DAV
50 DAV is 6,354,100
|
$65.50
-10.84%
|
8/31/2010
|
$61.32
|
PP = $63.48
|
|
MB = $66.65
|
Most Recent Note - 10/27/2010 11:14:23 AM
G - Slumping further below its 50 DMA line and -11.7% off its 52-week high, it gapped down today amid broad-based weakness in the Mining - Gold/Silver/Gems group. Many leaders in the group have sputtered in recent weeks while gold and silver bullion prices hit new highs.
>>> The latest Featured Stock Update with an annotated graph appeared on 9/14/2010. Click here.
View all notes |
Alert me of new notes |
CANSLIM.net Company Profile |
SEC |
Zacks Reports |
StockTalk |
News |
Chart |
Request a new note
C
A N
S L
I M
|
NEOG
-
NASDAQ
Neogen Corp
DRUGS - Diagnostic Substances
|
$33.89
|
-0.50
-1.45% |
$34.57
|
68,925
66.66% of 50 DAV
50 DAV is 103,400
|
$36.37
-6.82%
|
9/1/2010
|
$30.79
|
PP = $30.49
|
|
MB = $32.01
|
Most Recent Note - 10/25/2010 4:38:50 PM
G - Ended near the session low today, reversing for a loss on heavy volume after initially gapping up. Extended from a sound base, its 50 DMA line defines initial support above prior highs in the $30 area.
>>> The latest Featured Stock Update with an annotated graph appeared on 10/13/2010. Click here.
View all notes |
Alert me of new notes |
CANSLIM.net Company Profile |
SEC |
Zacks Reports |
StockTalk |
News |
Chart |
Request a new note
C
A N
S L
I M
|
Symbol/Exchange
Company Name
Industry Group |
PRICE |
CHANGE
(%Change) |
Day High |
Volume
(% DAV)
(% 50 day avg vol) |
52 Wk Hi
% From Hi |
Featured
Date |
Price
Featured |
Pivot Featured |
|
Max Buy |
NFLX
-
NASDAQ
Netflix Inc
SPECIALTY RETAIL - Music and Video Stores
|
$178.50
|
+0.88
0.50% |
$184.74
|
9,242,652
167.67% of 50 DAV
50 DAV is 5,512,500
|
$179.56
-0.59%
|
8/10/2010
|
$124.05
|
PP = $124.00
|
|
MB = $130.20
|
Most Recent Note - 10/27/2010 1:41:32 PM
G - It finished strong on the prior session, and reversed into the red after early gains today for new all-time highs. It could go on to produce more climactic gains. However, while now trading +67% above its 200 DMA line, it may be considered "late stage" and extended from a sound base after a considerable rally this year.
>>> The latest Featured Stock Update with an annotated graph appeared on 10/1/2010. Click here.
View all notes |
Alert me of new notes |
CANSLIM.net Company Profile |
SEC |
Zacks Reports |
StockTalk |
News |
Chart |
Request a new note
C
A N
S L
I M
|
NTAP
-
NASDAQ
Netapp Inc
COMPUTER HARDWARE - Data Storage Devices
|
$53.08
|
+0.77
1.47% |
$53.66
|
4,960,290
60.54% of 50 DAV
50 DAV is 8,193,600
|
$52.71
0.70%
|
9/8/2010
|
$46.98
|
PP = $44.99
|
|
MB = $47.24
|
Most Recent Note - 10/26/2010 6:06:44 PM
G - Gain today with light volume for a new high close. Its recent lows near $47 define an initial chart support level to watch above its 50 DMA line.
>>> The latest Featured Stock Update with an annotated graph appeared on 9/8/2010. Click here.
View all notes |
Alert me of new notes |
CANSLIM.net Company Profile |
SEC |
Zacks Reports |
StockTalk |
News |
Chart |
Request a new note
C
A N
S L
I M
|
ORCL
-
NASDAQ
Oracle Corp
COMPUTER SOFTWARE and SERVICES - Application Software
|
$28.70
|
+0.07
0.24% |
$28.82
|
33,850,294
86.30% of 50 DAV
50 DAV is 39,222,900
|
$29.29
-2.01%
|
9/20/2010
|
$27.32
|
PP = $26.73
|
|
MB = $28.07
|
Most Recent Note - 10/26/2010 4:10:50 PM
G - Below average volume has been behind small losses this week. Stubbornly holding its ground after getting extended beyond its "max buy" level with recent volume-driven gains.
>>> The latest Featured Stock Update with an annotated graph appeared on 9/20/2010. Click here.
View all notes |
Alert me of new notes |
CANSLIM.net Company Profile |
SEC |
Zacks Reports |
StockTalk |
News |
Chart |
Request a new note
C
A N
S L
I M
|
PAY
-
NYSE
Verifone Systems Inc
COMPUTER HARDWARE - Transaction Automation Systems
|
$32.42
|
-0.27
-0.83% |
$32.58
|
1,049,489
68.98% of 50 DAV
50 DAV is 1,521,400
|
$33.80
-4.08%
|
8/25/2010
|
$24.30
|
PP = $23.74
|
|
MB = $24.93
|
Most Recent Note - 10/25/2010 4:29:43 PM
G - Hit a new 52-week high today, and volume totals were above average behind 3 of its 4 consecutive gains. It is extended from a sound base pattern. Its 50 DMA and recent lows near $27 define chart support.
>>> The latest Featured Stock Update with an annotated graph appeared on 10/25/2010. Click here.
View all notes |
Alert me of new notes |
CANSLIM.net Company Profile |
SEC |
Zacks Reports |
StockTalk |
News |
Chart |
Request a new note
C
A N
S L
I M
|
PRGO
-
NASDAQ
Perrigo Co
DRUGS - Drug Related Products
|
$66.53
|
+0.15
0.23% |
$67.15
|
519,593
63.54% of 50 DAV
50 DAV is 817,700
|
$67.94
-2.08%
|
9/15/2010
|
$63.73
|
PP = $64.76
|
|
MB = $68.00
|
Most Recent Note - 10/25/2010 5:12:45 PM
Y - Light volume consolidation above its pivot point and below its "max buy" level continues. More damaging losses would raise concerns, meanwhile its 50 DMA line defines important chart support.
>>> The latest Featured Stock Update with an annotated graph appeared on 9/15/2010. Click here.
View all notes |
Alert me of new notes |
CANSLIM.net Company Profile |
SEC |
Zacks Reports |
StockTalk |
News |
Chart |
Request a new note
C
A N
S L
I M
|
Symbol/Exchange
Company Name
Industry Group |
PRICE |
CHANGE
(%Change) |
Day High |
Volume
(% DAV)
(% 50 day avg vol) |
52 Wk Hi
% From Hi |
Featured
Date |
Price
Featured |
Pivot Featured |
|
Max Buy |
RAX
-
NYSE
Rackspace Hosting Inc
INTERNET - Internet Software and; Services
|
$25.16
|
+0.88
3.62% |
$25.68
|
2,625,697
108.76% of 50 DAV
50 DAV is 2,414,300
|
$26.50
-5.06%
|
9/21/2010
|
$22.84
|
PP = $23.61
|
|
MB = $24.79
|
Most Recent Note - 10/27/2010 11:00:48 AM
G - Approaching prior highs with a considerable gain amid strength in the Internet - Networking group today after a solid earnings report and gap up gain from F5 Networks (FFIV). Color code is changed to green today after weeks of opportunity to accumulate shares below its "max buy" level. Reporting earnings on Monday, November 8, 2010, after the close.
>>> The latest Featured Stock Update with an annotated graph appeared on 9/21/2010. Click here.
View all notes |
Alert me of new notes |
CANSLIM.net Company Profile |
SEC |
Zacks Reports |
StockTalk |
News |
Chart |
Request a new note
C
A N
S L
I M
|
ROVI
-
NASDAQ
Rovi Corp
COMPUTER SOFTWARE andamp; SERVICES - Security Software andamp; Services
|
$50.00
|
-0.47
-0.93% |
$50.86
|
1,454,546
96.87% of 50 DAV
50 DAV is 1,501,600
|
$53.00
-5.66%
|
8/31/2010
|
$43.31
|
PP = $45.06
|
|
MB = $47.31
|
Most Recent Note - 10/26/2010 5:52:42 PM
G - Gain today with average volume matched its best close in 3 weeks. Due to report earnings on Thursday, October 28, 2010 after the close. Support to watch is defined by recent lows in the $47.50 area while it is consolidating in a healthy fashion above prior highs and its 50 DMA line.
>>> The latest Featured Stock Update with an annotated graph appeared on 10/20/2010. Click here.
View all notes |
Alert me of new notes |
CANSLIM.net Company Profile |
SEC |
Zacks Reports |
StockTalk |
News |
Chart |
Request a new note
C
A N
S L
I M
|
SHOO
-
NASDAQ
Steven Madden Limited
CONSUMER NON-DURABLES - Textile - Apparel Footwear
|
$42.76
|
-0.54
-1.25% |
$43.30
|
224,590
71.87% of 50 DAV
50 DAV is 312,500
|
$44.85
-4.66%
|
9/15/2010
|
$38.94
|
PP = $40.27
|
|
MB = $42.28
|
Most Recent Note - 10/25/2010 5:16:29 PM
G - Rallying back above its "max buy" level and its color code is changed to green. Found support above prior highs in the $40 area while recently enduring mild distributional pressure More damaging losses would raise concerns.
>>> The latest Featured Stock Update with an annotated graph appeared on 9/29/2010. Click here.
View all notes |
Alert me of new notes |
CANSLIM.net Company Profile |
SEC |
Zacks Reports |
StockTalk |
News |
Chart |
Request a new note
C
A N
S L
I M
|
SLW
-
NYSE
Silver Wheaton Corp
METALS and; MINING - Silver
|
$26.94
|
-0.37
-1.35% |
$27.00
|
6,181,131
94.38% of 50 DAV
50 DAV is 6,549,200
|
$28.39
-5.11%
|
8/25/2010
|
$21.40
|
PP = $21.99
|
|
MB = $23.09
|
Most Recent Note - 10/27/2010 11:11:16 AM
G - Gapped down today amid broad-based weakness in the Mining - Gold/Silver/Gems group. Many leaders in the group have sputtered in recent weeks while gold and silver bullion prices hit new highs. Its 50 DMA line and recent chart low define chart support to watch in the $25 area.
>>> The latest Featured Stock Update with an annotated graph appeared on 10/18/2010. Click here.
View all notes |
Alert me of new notes |
CANSLIM.net Company Profile |
SEC |
Zacks Reports |
StockTalk |
News |
Chart |
Request a new note
C
A N
S L
I M
|
SVR
-
NYSE
Syniverse Holdings Inc
TELECOMMUNICATIONS - Diversified Communication Serv
|
$23.79
|
-0.01
-0.04% |
$23.84
|
338,695
49.59% of 50 DAV
50 DAV is 683,000
|
$24.24
-1.86%
|
9/22/2010
|
$23.60
|
PP = $23.87
|
|
MB = $25.06
|
Most Recent Note - 10/26/2010 5:47:52 PM
Y - With volume totals cooling it is still perched within close striking distance of its 52-week high, but its waning Relative Strength rating is a concern. It found prompt support near its 50 DMA line after a recent bout of distribution. Confirming gains for a new high close with heavy volume would be a bullish sign, meanwhile the recent chart low ($21.47) defines important support to watch.
>>> The latest Featured Stock Update with an annotated graph appeared on 9/22/2010. Click here.
View all notes |
Alert me of new notes |
CANSLIM.net Company Profile |
SEC |
Zacks Reports |
StockTalk |
News |
Chart |
Request a new note
C
A N
S L
I M
|
Symbol/Exchange
Company Name
Industry Group |
PRICE |
CHANGE
(%Change) |
Day High |
Volume
(% DAV)
(% 50 day avg vol) |
52 Wk Hi
% From Hi |
Featured
Date |
Price
Featured |
Pivot Featured |
|
Max Buy |
UA
-
NYSE
Under Armour Inc Cl A
CONSUMER NON-DURABLES - Textile - Apparel Clothing
|
$46.80
|
-1.18
-2.46% |
$47.81
|
938,752
125.85% of 50 DAV
50 DAV is 745,900
|
$48.59
-3.68%
|
9/9/2010
|
$39.99
|
PP = $40.10
|
|
MB = $42.11
|
Most Recent Note - 10/27/2010 2:00:50 PM
G - Gapped down today and held its ground on the prior session following a report of earnings +21% on +22% sales revenues for the quarter ended September 30, 2010 versus the year ago period. It remains near its 52-week high, in healthy shape technically, and may deserve the benefit of the doubt with a favorable backdrop from the M criteria currently favoring 3 out of 4 growth stocks. However, the weaker earnings increase (under the +25% guideline) raises concerns, fundamentally, with respect to the C criteria. Earlier notes acknowledged the downward turn in annual earnings (A criteria) in FY '08, another fundamental concern with respect to the fact-based investment system.
.
>>> The latest Featured Stock Update with an annotated graph appeared on 9/9/2010. Click here.
View all notes |
Alert me of new notes |
CANSLIM.net Company Profile |
SEC |
Zacks Reports |
StockTalk |
News |
Chart |
Request a new note
C
A N
S L
I M
|
UFPT
-
NASDAQ
U F P Tech Inc
CONSUMER NON-DURABLES - Packaging and Containers
|
$12.00
|
-0.01
-0.08% |
$12.10
|
56,420
92.64% of 50 DAV
50 DAV is 60,900
|
$13.32
-9.91%
|
9/16/2010
|
$11.20
|
PP = $11.69
|
|
MB = $12.27
|
Most Recent Note - 10/25/2010 4:23:17 PM
G - Loss with average volume today, closing below its "max buy" level at the session low. The lack of meaningful progress since its early-October breakout is cause for concern, as some overhead supply has been created in recent weeks that may now act as resistance. Prior highs and its 50 DMA line in the $11 area define chart support to watch.
>>> The latest Featured Stock Update with an annotated graph appeared on 9/17/2010. Click here.
View all notes |
Alert me of new notes |
CANSLIM.net Company Profile |
SEC |
Zacks Reports |
StockTalk |
News |
Chart |
Request a new note
C
A N
S L
I M
|
ULTA
-
NASDAQ
Ulta Salon Cosm & Frag
SPECIALTY RETAIL - Specialty Retail, Other
|
$31.59
|
-0.74
-2.29% |
$32.25
|
464,087
70.10% of 50 DAV
50 DAV is 662,000
|
$32.68
-3.33%
|
9/3/2010
|
$26.36
|
PP = $25.89
|
|
MB = $27.18
|
Most Recent Note - 10/27/2010 5:00:46 PM
G - No overhead supply remains to act as resistance, but it is extended from a sound base pattern. Its 50 DMA line defines support to watch above prior chart highs in the $26 area..
>>> The latest Featured Stock Update with an annotated graph appeared on 9/3/2010. Click here.
View all notes |
Alert me of new notes |
CANSLIM.net Company Profile |
SEC |
Zacks Reports |
StockTalk |
News |
Chart |
Request a new note
C
A N
S L
I M
|
VIT
-
NYSE
Vanceinfo Tech Inc Ads
COMPUTER SOFTWARE and SERVICES - Business Software and Services
|
$36.65
|
+0.11
0.30% |
$36.72
|
532,553
79.95% of 50 DAV
50 DAV is 666,100
|
$36.89
-0.65%
|
7/8/2010
|
$25.20
|
PP = $26.58
|
|
MB = $27.91
|
Most Recent Note - 10/26/2010 6:05:23 PM
G - Hit another new all-time high today with volume slightly above average. It has not formed a recent sound base pattern but patient investors may watch for it to eventually offer an ideal add-on buy point. Meanwhile, its 50 DMA line and recent low ($30.55 on 10/08/10) define important chart support to watch.
>>> The latest Featured Stock Update with an annotated graph appeared on 10/21/2010. Click here.
View all notes |
Alert me of new notes |
CANSLIM.net Company Profile |
SEC |
Zacks Reports |
StockTalk |
News |
Chart |
Request a new note
C
A N
S L
I M
|
WCRX
-
NASDAQ
Warner Chilcott Plc
DRUGS - Drug Manufacturers - Other
|
$24.24
|
-0.13
-0.53% |
$24.32
|
2,349,171
82.41% of 50 DAV
50 DAV is 2,850,700
|
$25.32
-4.27%
|
8/23/2010
|
$21.04
|
PP = $20.84
|
|
MB = $21.88
|
Most Recent Note - 10/27/2010 5:30:02 PM
G - Holding its ground stubbornly with volume totals cooling since its "negative reversal" on 10/22/10 was noted. Prior chart highs near $23.50 define near-term support above its 50 DMA line. Its currently low P/E Ratio of 8 (only 60% X S&P 500) might attract the interest of "value" players, but the low P/E and Street estimates calling for only +3% earnings growth in FY '11 raise concerns with respect to its future earnings outlook.
>>> The latest Featured Stock Update with an annotated graph appeared on 10/15/2010. Click here.
View all notes |
Alert me of new notes |
CANSLIM.net Company Profile |
SEC |
Zacks Reports |
StockTalk |
News |
Chart |
Request a new note
C
A N
S L
I M
|
Symbol/Exchange
Company Name
Industry Group |
PRICE |
CHANGE
(%Change) |
Day High |
Volume
(% DAV)
(% 50 day avg vol) |
52 Wk Hi
% From Hi |
Featured
Date |
Price
Featured |
Pivot Featured |
|
Max Buy |