You are not logged in.
This means you
CAN ONLY VIEW reports that were published prior to Monday, April 14, 2025.
You
MUST UPGRADE YOUR MEMBERSHIP if you want to see any current reports.
AFTER MARKET UPDATE - THURSDAY, OCTOBER 25TH, 2012
Previous After Market Report Next After Market Report >>>
|
|
|
|
DOW |
+26.34 |
13,103.68 |
+0.20% |
|
Volume |
696,012,790 |
+7% |
|
Volume |
1,822,108,580 |
-4% |
|
NASDAQ |
+4.42 |
2,986.12 |
+0.15% |
|
Advancers |
1,800 |
58% |
|
Advancers |
1,434 |
55% |
|
S&P 500 |
+4.22 |
1,412.97 |
+0.30% |
|
Decliners |
1,190 |
38% |
|
Decliners |
1,041 |
40% |
|
Russell 2000 |
+3.17 |
816.82 |
+0.39% |
|
52 Wk Highs |
94 |
|
|
52 Wk Highs |
46 |
|
|
S&P 600 |
+1.47 |
456.40 |
+0.32% |
|
52 Wk Lows |
42 |
|
|
52 Wk Lows |
56 |
|
|
 |
Major Averages Halted Slide and Edged Higher
Kenneth J. Gruneisen - Passed the CAN SLIM® Master's Exam
The major averages managed to gain ground in a volatile trading session on Thursday. The volume totals were reported mixed, slightly higher on the NYSE and slightly lower on the Nasdaq exchange versus the prior session's totals. Breadth was positive as advancers led decliner by a 3-2 margin on the NYSE and by a 7-5 margin on the Nasdaq exchange. The total number of stocks hitting new 52-week highs outnumbered new 52-week lows on the NYSE, but on the Nasdaq exchange new lows again outnumbered new highs. Leadership was limited to 26 high-ranked companies from the CANSLIM.net Leaders List making new 52-week highs and appearing on the CANSLIM.net BreakOuts Page, down from the prior session total of 30 stocks. There were gains for 11 of the 17 high-ranked companies currently included on the Featured Stocks Page, a list of noteworthy leaders that has recently been getting trimmed.
Investors also digested a batch of mixed economic data. The employment situation improved as jobless claims fell last week to 369,000 and durable goods orders jumped 9.9% in September. On the downside, pending home sales gained 0.3% which failed to meet expectations for an advance of 2.5%.
Earnings results helped stocks snap a string of losses. Procter & Gamble Co (PG +2.92%) gained ground as a reduction in manufacturing costs led the company to a better than expected profit tally. Aetna Inc's (AET +1.09%) earnings report also topped street estimates to push its shares up. In tech land, Zynga Inc (ZNGA +12.26%), Symantec Corp (SYMC +6.67%), and Akamai Technologies Inc (AKAM +6.73%) each tallied gains following their latest quarterly results. However, losses in materials limited the major average's gains. Cliffs Natural Resources (CLF -10.52%) led the group lower as it dropped sharply after earnings fell short of expectations. Profit tallies remained in focus after the close with reports out from Apple Inc (AAPL -1.18%) and Amazon.com Inc (AMZN -2.24%).
In fixed-income, Treasuries fell and the government's 7-year note auction received weaker than average demand. The 10-year note was down 10/32 to yield 1.83% and the 30-year bond lost 15/32 to yield 2.98%.
During market corrections the M criteria argues against new buying efforts and urges investors to take a defensive stance to protect precious capital. That stance can change back to a bullish stance where buying is encouraged when at least one of the three major averages produces a solid follow-through day (FTD). A FTD confirming a new rally requires substantial gains on higher (ideally above average) volume, coupled with healthy leadership and a respectable number of stocks hitting new 52-week highs. Historic studies have shown that a FTD occurring between Days 4-7 of a new rally effort has often signaled the beginning of the most substantial market rallies.
Investors should always limit losses if ever any stock falls more than -7% from their purchase price. Following strict sell rules is precisely how this fact-based investment system prompts investors to reduce exposure and protect cash during market downturns. Keep a watchlist of strong acting stocks with all-key criteria in anticipation of the next confirmed uptrend. See the noteworthy candidates included on the Featured Stocks Page.
Watch for an announcement via email concerning the Q3 2012 WEBCAST. The webcast will also be available via an updated link highlighted at the top of the Premium Member Homepage.
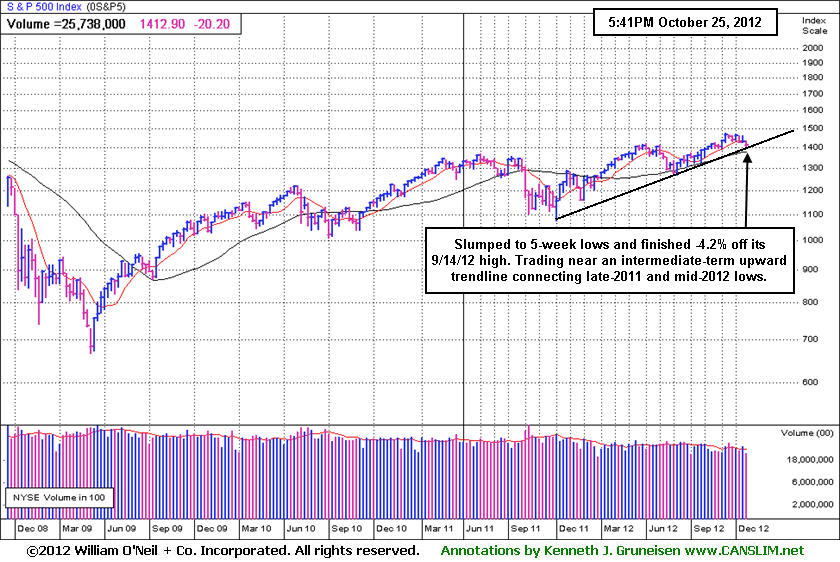
PICTURED: The S&P 500 Index slumped to 5-week lows and finished -4.2% off its 9/14/12 high. It is trading near an intermediate-term upward trendline connecting late-2011 and mid-2012 lows. Subsequent deterioration would not bode well for the broader market outlook. Further weakness would be a signal for investors to reduce market exposure if they are not already entirely in cash. In this commentary we will continue to watch closely for an eventual rally and confirming gains within the ideal window for a proper FTD, meanwhile caution and patience are required.
|
 Kenneth J. Gruneisen started out as a licensed stockbroker in August 1987, a couple of months prior to the historic stock market crash that took the Dow Jones Industrial Average down -22.6% in a single day. He has published daily fact-based fundamental and technical analysis on high-ranked stocks online for two decades. Through FACTBASEDINVESTING.COM, Kenneth provides educational articles, news, market commentary, and other information regarding proven investment systems that work in good times and bad.
Comments contained in the body of this report are technical opinions only and are not necessarily those of Gruneisen Growth Corp. The material herein has been obtained from sources believed to be reliable and accurate, however, its accuracy and completeness cannot be guaranteed. Our firm, employees, and customers may effect transactions, including transactions contrary to any recommendation herein, or have positions in the securities mentioned herein or options with respect thereto. Any recommendation contained in this report may not be suitable for all investors and it is not to be deemed an offer or solicitation on our part with respect to the purchase or sale of any securities. |
|
 |
Defensive, Tech, Energy and Financial Groups Rose; Retail Lagged
Kenneth J. Gruneisen - Passed the CAN SLIM® Master's Exam
The Semiconductor Index ($SOX +1.38%) led the tech sector higher while the Networking Index ($NWX +0.34%), Biotechnology Index ($BTK +0.33%), and the Internet Index ($IIX +0.14%) posted smaller gains. The Retail Index ($RLX -0.45%) suffered a modest loss while influential gains from the Broker/Dealer Index ($XBD +1.39%) and the Bank Index ($BKX +0.59%) helped underpin the major averages while they attempted to rally.
Gains in energy-related shares gave the Oil Services Index ($OSX +0.57%) and the Integrated Oil Index ($XOI +0.98%) a boost. The Gold & Silver Index ($XAU +2.70%) rallied and the Healthcare Index ($HMO +0.72%) also rose.
Charts courtesy www.stockcharts.com
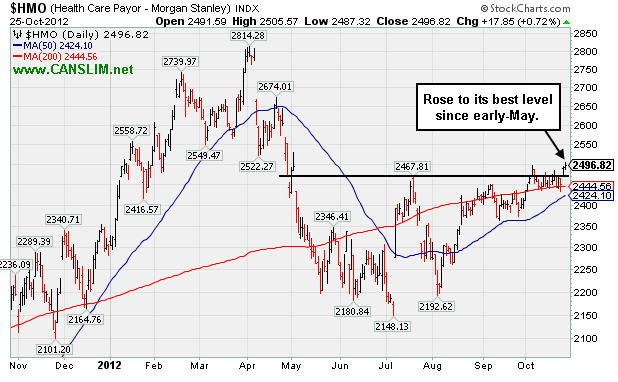
PICTURED: The Healthcare Index ($HMO +0.72%) rose to levels not seen since May.
| Oil Services |
$OSX |
221.39 |
+1.26 |
+0.57% |
+2.36% |
| Healthcare |
$HMO |
2,496.82 |
+17.85 |
+0.72% |
+9.43% |
| Integrated Oil |
$XOI |
1,226.10 |
+11.95 |
+0.98% |
-0.24% |
| Semiconductor |
$SOX |
365.48 |
+4.96 |
+1.38% |
+0.29% |
| Networking |
$NWX |
194.59 |
+0.66 |
+0.34% |
-9.56% |
| Internet |
$IIX |
302.11 |
+0.43 |
+0.14% |
+7.23% |
| Broker/Dealer |
$XBD |
84.39 |
+1.16 |
+1.39% |
+1.34% |
| Retail |
$RLX |
633.86 |
-2.85 |
-0.45% |
+21.15% |
| Gold & Silver |
$XAU |
184.14 |
+4.84 |
+2.70% |
+1.94% |
| Bank |
$BKX |
49.70 |
+0.29 |
+0.59% |
+26.21% |
| Biotech |
$BTK |
1,455.85 |
+4.75 |
+0.33% |
+33.39% |
|
|
|
 |
Cardinal Financial Flies Against Tough Market Headwinds
Kenneth J. Gruneisen - Passed the CAN SLIM® Master's Exam
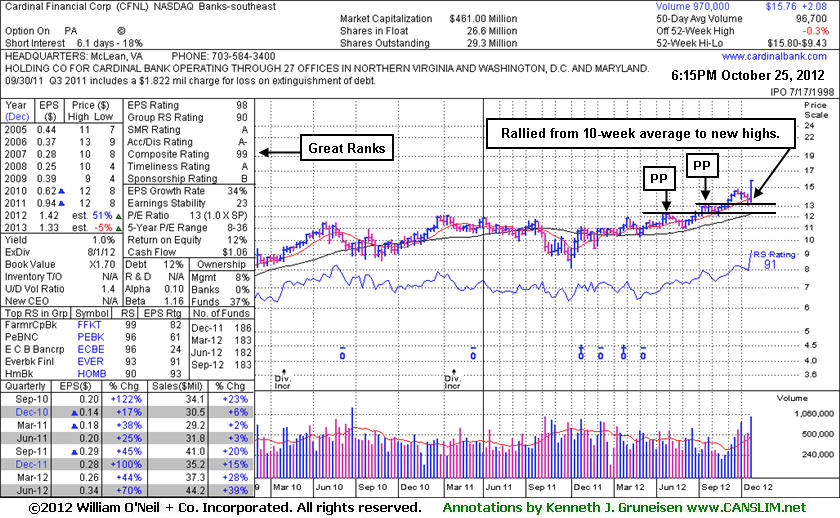
Cardinal Financial Corp (CFNL +$0.78 or +5.21% to $15.76) tallied a 3rd consecutive big gain with heavy volume and finished near the session high at a new 52-week high. Its color code was changed to green after rallying more than +5% above its latest highs (9/24/12 high of $14.79). Market conditions (M criteria) argue against any new buying efforts until a new confirmed rally in the broader market, however this outlier has rallied impressively against a mostly negative backdrop.
It was last shown in this FSU section on 9/25/12 with an annotated graph under the headline, "Extended From Prior Base Following Volume-Driven Gains". As we have explained before, in the Certification they teach that a valid secondary buy point exists from when a stock successfully tests its 10-week moving average (WMA) line up to +5% above its latest highs following an earlier technical breakout. In the mid-day report on Wednesday 10/24/12 (read here) it was noted - "CFNL is tallying another considerable gain with heavy volume today, spiking to a new 52-week high. Color code is changed to yellow however no new pivot point is cited, yet a valid secondary buy point otherwise exists from its recently successful test of support at its 10-week moving average (WMA) line up to +5% above its latest highs (9/24/12 high of $14.79 plus another +5%)."
Now it is extended from its prior base and outside of the proper range for its secondary buy point noted. The annotated weekly graph below illustrates 2 prior pivot points cited in ongoing analysis while it has rallied +22.8% from $12.85 when first featured in the 7/20/12 mid-day report (read here). It may go on to produce bigger gains, but keep in mind that the fact-based investment system argues for locking in gains when you have a solid +20% gain. Sometimes it is not worth it to stick around wait for sell signals and technical damage to mount, especially when the market direction is negative and the M criteria is arguing that 3 out of 4 stocks may be expected to decline.
The high-ranked leader hailing from the Banks - Southeast industry group reported earnings +70% on +39% sales revenues for the quarter ended June 30, 2012 versus the year ago period. Sequentially, its recent quarterly comparisons show encouraging sales revenues acceleration. It has earned high ranks and matches favorably with the C and A criteria. The number of top-rated funds owning its shares rose from 172 in Sep '11 to 183 in Sep '12, a slightly reassuring sign concerning the I criteria. Its current Up/Down Volume Ratio of 1.4 is an unbiased indication its shares have been under accumulation over the past 50 days. Its small supply (S criteria) of only 29.3 millions shares outstanding is a favorable characteristic, yet it can contribute to greater price volatility in the event of institutional accumulation or distributional pressure.
|
|
|
Color Codes Explained :
Y - Better candidates highlighted by our
staff of experts.
G - Previously featured
in past reports as yellow but may no longer be buyable under the
guidelines.
***Last / Change / Volume data in this table is the closing quote data***
Symbol/Exchange
Company Name
Industry Group |
PRICE |
CHANGE
(%Change) |
Day High |
Volume
(% DAV)
(% 50 day avg vol) |
52 Wk Hi
% From Hi |
Featured
Date |
Price
Featured |
Pivot Featured |
|
Max Buy |
ASPS
-
NASDAQ
Altisource Ptf Sltns Sa
REAL ESTATE - Property Management/Developmen
|
$115.90
|
-8.43
-6.78% |
$127.50
|
965,791
497.83% of 50 DAV
50 DAV is 194,000
|
$129.72
-10.65%
|
9/24/2012
|
$87.24
|
PP = $92.39
|
|
MB = $97.01
|
 Most Recent Note - 10/25/2012 11:56:58 AM
G - Perched at 52-week and all-time highs today following a considerable volume-driven gain on the prior session. Previously noted - "Very extended from its prior base, its prior highs in the $92 area define initial support to watch on pullbacks."
>>> The latest Featured Stock Update with an annotated graph appeared on 10/12/2012. Click here.
View all notes |
Alert me of new notes |
CANSLIM.net Company Profile |
SEC |
Zacks Reports |
StockTalk |
News |
Chart |
Request a new note
C
A N
S L
I M


|
BRLI
-
NASDAQ
Bio Reference Labs Inc
HEALTH SERVICES - Medical Laboratories and Researc
|
$28.97
|
-0.50
-1.70% |
$29.85
|
343,777
105.88% of 50 DAV
50 DAV is 324,700
|
$32.86
-11.84%
|
10/3/2012
|
$30.90
|
PP = $30.25
|
|
MB = $31.76
|
Most Recent Note - 10/23/2012 6:32:57 PM
G - Damaging loss today with above average volume briefly undercut prior highs in the $30 area and tested support near its 50 DMA line. Further technical deterioration would raise more serious concerns.
>>> The latest Featured Stock Update with an annotated graph appeared on 10/8/2012. Click here.
View all notes |
Alert me of new notes |
CANSLIM.net Company Profile |
SEC |
Zacks Reports |
StockTalk |
News |
Chart |
Request a new note
C
A N
S L
I M
|
CFNL
-
NASDAQ
Cardinal Financial Corp
BANKING - Regional - Southeast Banks
|
$15.76
|
+0.78
5.21% |
$15.80
|
239,374
247.54% of 50 DAV
50 DAV is 96,700
|
$15.37
2.54%
|
8/17/2012
|
$12.84
|
PP = $13.31
|
|
MB = $13.98
|
Most Recent Note - 10/25/2012 6:53:39 PM
G - Tallied a 3rd consecutive big gain with heavy volume and finished near the session high at a new 52-week high. Color code was changed to green after rallying more than +5% above its latest highs (9/24/12 high of $14.79). See the latest FSU analysis for more details and a new annotated weekly graph.
>>> The latest Featured Stock Update with an annotated graph appeared on 10/25/2012. Click here.
View all notes |
Alert me of new notes |
CANSLIM.net Company Profile |
SEC |
Zacks Reports |
StockTalk |
News |
Chart |
Request a new note
C
A N
S L
I M
|
CMCSA
-
NASDAQ
Comcast Corp Cl A
MEDIA - CATV Systems
|
$36.36
|
-0.06
-0.16% |
$36.90
|
10,891,566
92.31% of 50 DAV
50 DAV is 11,799,500
|
$37.60
-3.30%
|
6/11/2012
|
$29.94
|
PP = $30.98
|
|
MB = $32.53
|
Most Recent Note - 10/24/2012 7:23:53 PM
G - Upward trendline and 50 DMA line define near term support where violations would trigger technical sell signals. Fundamental concerns have been repeatedly noted - "Due to sub par sales and earnings growth in the Jun '12 quarter." See the latest FSU analysis for more details and a new annotated graph.
>>> The latest Featured Stock Update with an annotated graph appeared on 10/24/2012. Click here.
View all notes |
Alert me of new notes |
CANSLIM.net Company Profile |
SEC |
Zacks Reports |
StockTalk |
News |
Chart |
Request a new note
C
A N
S L
I M
|
DVA
-
NYSE
Davita Inc
HEALTH SERVICES - Specialized Health Services
|
$111.41
|
+0.59
0.53% |
$112.79
|
752,898
97.25% of 50 DAV
50 DAV is 774,200
|
$113.48
-1.82%
|
9/5/2012
|
$102.92
|
PP = $100.62
|
|
MB = $105.65
|
Most Recent Note - 10/24/2012 4:03:29 PM
G - Hovering near its 52-week high, extended from its latest sound base. Prior highs near $100 and its 50 DMA line define near-term support to watch on pullbacks where violations may trigger technical sell signals.
>>> The latest Featured Stock Update with an annotated graph appeared on 10/10/2012. Click here.
View all notes |
Alert me of new notes |
CANSLIM.net Company Profile |
SEC |
Zacks Reports |
StockTalk |
News |
Chart |
Request a new note
C
A N
S L
I M
|
Symbol/Exchange
Company Name
Industry Group |
PRICE |
CHANGE
(%Change) |
Day High |
Volume
(% DAV)
(% 50 day avg vol) |
52 Wk Hi
% From Hi |
Featured
Date |
Price
Featured |
Pivot Featured |
|
Max Buy |
GPX
-
NYSE
G P Strategies Corp
DIVERSIFIED SERVICES - Education and Training Services
|
$19.38
|
+0.54
2.87% |
$19.45
|
36,384
61.25% of 50 DAV
50 DAV is 59,400
|
$20.67
-6.24%
|
10/8/2012
|
$20.00
|
PP = $20.77
|
|
MB = $21.81
|
Most Recent Note - 10/24/2012 4:06:49 PM
G - Gains have lacked volume conviction since violating its 50 DMA line, and its slump below its previously noted low ($18.82 on 10/04/12) raised more serious concerns and triggered a technical sell signal. Gains above its 50 DMA line are needed for its outlook to improve
>>> The latest Featured Stock Update with an annotated graph appeared on 10/16/2012. Click here.
View all notes |
Alert me of new notes |
CANSLIM.net Company Profile |
SEC |
Zacks Reports |
StockTalk |
News |
Chart |
Request a new note
C
A N
S L
I M
|
LKQ
-
NASDAQ
L K Q Corp
WHOLESALE - Auto Parts
|
$20.05
|
-0.07
-0.35% |
$20.61
|
6,374,838
442.27% of 50 DAV
50 DAV is 1,441,400
|
$21.22
-5.49%
|
8/9/2012
|
$18.97
|
PP = $18.72
|
|
MB = $19.66
|
Most Recent Note - 10/25/2012 12:18:38 PM
G - Reported earnings +6% on +30% sales revenues for the Sep '12 quarter, below the +25% minimum earnings guideline (C criteria), raising fundamental concerns. Pulled back near its 50 DMA line today yet showed resilience thus far. Still perched near its 52-week high, and no resistance remains due to overhead supply.
>>> The latest Featured Stock Update with an annotated graph appeared on 10/19/2012. Click here.
View all notes |
Alert me of new notes |
CANSLIM.net Company Profile |
SEC |
Zacks Reports |
StockTalk |
News |
Chart |
Request a new note
C
A N
S L
I M
|
MIDD
-
NASDAQ
Middleby Corp
MANUFACTURING - Diversified Machinery
|
$123.41
|
+0.75
0.61% |
$124.02
|
41,612
54.82% of 50 DAV
50 DAV is 75,900
|
$124.23
-0.66%
|
10/8/2012
|
$118.46
|
PP = $122.67
|
|
MB = $128.80
|
Most Recent Note - 10/22/2012 6:52:50 PM
Y - Finished just -0.9% off its 52-week high today. Volume totals have been below average in recent weeks while stubbornly holding its ground. Subsequent volume-driven gains above the pivot point may trigger a new (or add-on) technical buy signal. Its 50 DMA line and recent lows define near-term chart support to watch. See the latest FSU analysis for more details and a new annotated graph.
>>> The latest Featured Stock Update with an annotated graph appeared on 10/22/2012. Click here.
View all notes |
Alert me of new notes |
CANSLIM.net Company Profile |
SEC |
Zacks Reports |
StockTalk |
News |
Chart |
Request a new note
C
A N
S L
I M
|
N
-
NYSE
Netsuite Inc
DIVERSIFIED SERVICES - Business/Management Services
|
$56.91
|
-1.84
-3.13% |
$59.89
|
731,609
160.16% of 50 DAV
50 DAV is 456,800
|
$64.70
-12.04%
|
8/20/2012
|
$55.88
|
PP = $59.32
|
|
MB = $62.29
|
Most Recent Note - 10/25/2012 6:50:47 PM
G - Encountered resistance at its 50 DMA line and slumped with higher volume today for another damaging loss. The next chart support is at its 200 DMA line and prior highs in the $52 area
>>> The latest Featured Stock Update with an annotated graph appeared on 9/24/2012. Click here.
View all notes |
Alert me of new notes |
CANSLIM.net Company Profile |
SEC |
Zacks Reports |
StockTalk |
News |
Chart |
Request a new note
C
A N
S L
I M
|
NSM
-
NYSE
Nationstar Mtg Hldgs Inc
FINANCIAL SERVICES - Credit Services
|
$32.12
|
+0.61
1.94% |
$32.12
|
1,668,295
115.25% of 50 DAV
50 DAV is 1,447,600
|
$37.20
-13.66%
|
8/29/2012
|
$27.96
|
PP = $28.85
|
|
MB = $30.29
|
Most Recent Note - 10/25/2012 6:52:28 PM
G - Tallied a gain today on near average volume following a damaging loss on heavy volume that briefly violated its 50 DMA line on the prior session.
>>> The latest Featured Stock Update with an annotated graph appeared on 10/11/2012. Click here.
View all notes |
Alert me of new notes |
CANSLIM.net Company Profile |
SEC |
Zacks Reports |
StockTalk |
News |
Chart |
Request a new note
C
A N
S L
I M
|
Symbol/Exchange
Company Name
Industry Group |
PRICE |
CHANGE
(%Change) |
Day High |
Volume
(% DAV)
(% 50 day avg vol) |
52 Wk Hi
% From Hi |
Featured
Date |
Price
Featured |
Pivot Featured |
|
Max Buy |
OSIS
-
NASDAQ
O S I Systems Inc
ELECTRONICS - Semiconductor Equipment and Mate
|
$80.89
|
+1.80
2.28% |
$80.98
|
90,846
75.20% of 50 DAV
50 DAV is 120,800
|
$80.92
-0.04%
|
9/5/2012
|
$74.39
|
PP = $75.10
|
|
MB = $78.86
|
Most Recent Note - 10/23/2012 6:38:54 PM
G - Rallied with +44% above average volume today for a best-ever close, bucking a negative market backdrop. Found support at its 50 DMA line this week, and its color code is changed to green while getting extended from its prior base.
>>> The latest Featured Stock Update with an annotated graph appeared on 10/18/2012. Click here.
View all notes |
Alert me of new notes |
CANSLIM.net Company Profile |
SEC |
Zacks Reports |
StockTalk |
News |
Chart |
Request a new note
C
A N
S L
I M
|
RNF
-
NYSE
Rentech Nitrogen Ptnr Lp
CHEMICALS - Agricultural Chemicals
|
$37.67
|
+1.27
3.49% |
$37.67
|
339,491
91.73% of 50 DAV
50 DAV is 370,100
|
$40.05
-5.94%
|
7/27/2012
|
$29.58
|
PP = $30.60
|
|
MB = $32.13
|
Most Recent Note - 10/23/2012 1:09:16 PM
G - Consolidating near its 50 DMA line defining important near-term support after the previously noted upward trendline violation. Gains have lacked volume conviction after it halted its slide.
>>> The latest Featured Stock Update with an annotated graph appeared on 10/4/2012. Click here.
View all notes |
Alert me of new notes |
CANSLIM.net Company Profile |
SEC |
Zacks Reports |
StockTalk |
News |
Chart |
Request a new note
C
A N
S L
I M
|
TDG
-
NYSE
Transdigm Group Inc
AEROSPACE/DEFENSE - Aerospace/Defense Products and; Services
|
$135.11
|
+3.69
2.81% |
$135.34
|
701,221
140.13% of 50 DAV
50 DAV is 500,400
|
$139.31
-3.02%
|
8/16/2012
|
$132.23
|
PP = $136.44
|
|
MB = $143.26
|
Most Recent Note - 10/23/2012 6:30:51 PM
G - Gapped down today and undercut its 50 DMA line following a special dividend, yet it promptly rebounded back above that important short-term average. See latest FSU analysis for more details and a new annotated graph.
>>> The latest Featured Stock Update with an annotated graph appeared on 10/23/2012. Click here.
View all notes |
Alert me of new notes |
CANSLIM.net Company Profile |
SEC |
Zacks Reports |
StockTalk |
News |
Chart |
Request a new note
C
A N
S L
I M
|
ULTA
-
NASDAQ
Ulta Salon Cosm & Frag
SPECIALTY RETAIL - Specialty Retail, Other
|
$92.27
|
-0.87
-0.93% |
$93.84
|
489,416
63.98% of 50 DAV
50 DAV is 765,000
|
$103.52
-10.87%
|
9/4/2012
|
$93.17
|
PP = $98.52
|
|
MB = $103.45
|
Most Recent Note - 10/24/2012 4:09:17 PM
G - Sputtering below its 50 DMA line with losses this week on lighter volume. A rebound above that important short-term average is needed for its outlook to improve. The latest FSU analysis discussed its waning Relative Strength under the headline "Relative Strength Line Did Not Provide Confirmation - Friday, October 05, 2012".
>>> The latest Featured Stock Update with an annotated graph appeared on 10/5/2012. Click here.
View all notes |
Alert me of new notes |
CANSLIM.net Company Profile |
SEC |
Zacks Reports |
StockTalk |
News |
Chart |
Request a new note
C
A N
S L
I M
|
ULTI
-
NASDAQ
Ultimate Software Group
INTERNET - Internet Software and Services
|
$96.67
|
+0.38
0.39% |
$97.40
|
52,802
35.80% of 50 DAV
50 DAV is 147,500
|
$106.40
-9.14%
|
8/27/2012
|
$98.36
|
PP = $99.19
|
|
MB = $104.15
|
Most Recent Note - 10/24/2012 4:10:36 PM
G - Halted its slide after recently undercutting prior lows in the $96 area and violating its 50 DMA line triggering technical sell signals. A rebound above its 50 DMA line is needed for its outlook to improve
>>> The latest Featured Stock Update with an annotated graph appeared on 9/27/2012. Click here.
View all notes |
Alert me of new notes |
CANSLIM.net Company Profile |
SEC |
Zacks Reports |
StockTalk |
News |
Chart |
Request a new note
C
A N
S L
I M
|
Symbol/Exchange
Company Name
Industry Group |
PRICE |
CHANGE
(%Change) |
Day High |
Volume
(% DAV)
(% 50 day avg vol) |
52 Wk Hi
% From Hi |
Featured
Date |
Price
Featured |
Pivot Featured |
|
Max Buy |
VSI
-
NYSE
Vitamin Shoppe Inc
SPECIALTY RETAIL - Specialty Retail, Other
|
$57.37
|
+0.79
1.40% |
$57.56
|
234,369
81.27% of 50 DAV
50 DAV is 288,400
|
$61.83
-7.21%
|
10/15/2012
|
$57.82
|
PP = $60.08
|
|
MB = $63.08
|
Most Recent Note - 10/24/2012 4:12:54 PM
G - Volume was below average while its slumped below its 50 DMA line today and its color code was changed to green. A rebound above that important short-term average would help its stance, and subsequent volume-driven gains are needed to trigger a new technical buy signal.
>>> The latest Featured Stock Update with an annotated graph appeared on 10/15/2012. Click here.
View all notes |
Alert me of new notes |
CANSLIM.net Company Profile |
SEC |
Zacks Reports |
StockTalk |
News |
Chart |
Request a new note
C
A N
S L
I M
|
WPI
-
NYSE
Watson Pharmaceuticals
DRUGS - Drugs - Generic
|
$86.89
|
+0.99
1.15% |
$87.69
|
560,636
61.94% of 50 DAV
50 DAV is 905,200
|
$89.90
-3.35%
|
8/24/2012
|
$82.90
|
PP = $81.10
|
|
MB = $85.16
|
Most Recent Note - 10/23/2012 6:41:14 PM
G - Retreating from its 52-week high with another loss on below average volume. Its 50 DMA line defines important near-term support to watch.
>>> The latest Featured Stock Update with an annotated graph appeared on 9/28/2012. Click here.
View all notes |
Alert me of new notes |
CANSLIM.net Company Profile |
SEC |
Zacks Reports |
StockTalk |
News |
Chart |
Request a new note
C
A N
S L
I M
|
|
|
|
THESE ARE NOT BUY RECOMMENDATIONS!
Comments contained in the body of this report are technical
opinions only. The material herein has been obtained
from sources believed to be reliable and accurate, however,
its accuracy and completeness cannot be guaranteed.
This site is not an investment advisor, hence it does
not endorse or recommend any securities or other investments.
Any recommendation contained in this report may not
be suitable for all investors and it is not to be deemed
an offer or solicitation on our part with respect to
the purchase or sale of any securities. All trademarks,
service marks and trade names appearing in this report
are the property of their respective owners, and are
likewise used for identification purposes only.
This report is a service available
only to active Paid Premium Members.
You may opt-out of receiving report notifications
at any time. Questions or comments may be submitted
by writing to Premium Membership Services 665 S.E. 10 Street, Suite 201 Deerfield Beach, FL 33441-5634 or by calling 1-800-965-8307
or 954-785-1121.
|
|
|

