You are not logged in.
This means you
CAN ONLY VIEW reports that were published prior to Monday, April 7, 2025.
You
MUST UPGRADE YOUR MEMBERSHIP if you want to see any current reports.
AFTER MARKET UPDATE - WEDNESDAY, OCTOBER 24TH, 2012
Previous After Market Report Next After Market Report >>>
|
|
|
|
DOW |
-25.19 |
13,077.34 |
-0.19% |
|
Volume |
650,195,490 |
-3% |
|
Volume |
1,900,758,290 |
+8% |
|
NASDAQ |
-8.76 |
2,981.70 |
-0.29% |
|
Advancers |
1,324 |
43% |
|
Advancers |
1,082 |
42% |
|
S&P 500 |
-4.36 |
1,408.75 |
-0.31% |
|
Decliners |
1,662 |
53% |
|
Decliners |
1,358 |
53% |
|
Russell 2000 |
-2.55 |
813.65 |
-0.31% |
|
52 Wk Highs |
67 |
|
|
52 Wk Highs |
37 |
|
|
S&P 600 |
-1.47 |
454.93 |
-0.32% |
|
52 Wk Lows |
41 |
|
|
52 Wk Lows |
57 |
|
|
 |
Major Averages Finished Lower After Initial Push Higher
Kenneth J. Gruneisen - Passed the CAN SLIM® Master's Exam
The major averages finished lower after an initial push higher on Wednesday. The volume totals were reported mixed, lighter on the NYSE and slightly heavier on the Nasdaq exchange versus the prior session's totals. Breadth was slightly negative as decliners led advancers by an 8-7 margin on the NYSE and by a 7-5 margin on the Nasdaq exchange. The total number of stocks hitting new 52-week highs outnumbered new 52-week lows on the NYSE, but on the Nasdaq exchange new lows outnumbered new highs. Leadership improved meaningfully as 30 high-ranked companies from the CANSLIM.net Leaders List made new 52-week highs and appeared on the CANSLIM.net BreakOuts Page, up from the prior session total of merely 5 stocks. There were gains for 6 of the 17 high-ranked companies currently included on the Featured Stocks Page, a list of noteworthy leaders that has recently been getting trimmed.
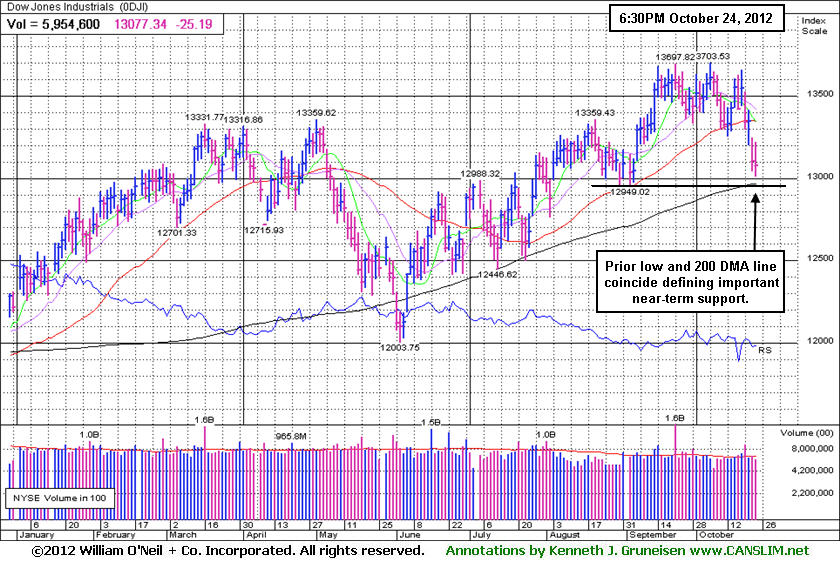
Stocks erased an early advance after the FOMC statement tempered enthusiasm surrounding earlier economic reports. The Fed said the economy continues to grow at only a modest pace and inflation picked up due to higher commodity prices. As a result, investors overlooked encouraging data as Chinese manufacturing output climbed to a three-month high and U.S. home sales for September increased at the fastest pace in two years.
Mixed earnings reports added to the cautious tone. Facebook Inc (FB +19.13%) rallied after its quarterly results topped analyst's expectations, thanks to a ramp up in mobile ads. On the downside, Netflix Inc (NFLX -11.88%) gave up ground after lowering both its domestic and international growth forecasts. AT&T Inc (T -0.89%) edged lower after falling short of revenue and new subscription estimates. Profit tallies remained in focus after the close with reports out from Zynga Inc (ZNGA -3.23%) , Symantec Corp (SYMC +0.06%) and Akamai Technologies Inc (AKAM -1.04%).
In fixed-income, Treasuries held onto losses after the government's auction of $35 billion in 5-year notes. The 10-year note was down 8/32 to yield 1.79% and the 30-year bond lost 28/32 to yield 2.95%.
During market corrections the M criteria argues against new buying efforts and urges investors to take a defensive stance to protect precious capital. That stance can change back to a bullish stance where buying is encouraged when at least one of the three major averages produces a solid follow-through day (FTD). A FTD confirming a new rally requires substantial gains on higher (ideally above average) volume, coupled with healthy leadership and a respectable number of stocks hitting new 52-week highs. Historic studies have shown that a FTD occurring between Days 4-7 of a new rally effort has often signaled the beginning of the most substantial market rallies.
Investors should always limit losses if ever any stock falls more than -7% from their purchase price. Following strict sell rules is precisely how this fact-based investment system prompts investors to reduce exposure and protect cash during market downturns. Keep a watchlist of strong acting stocks with all-key criteria in anticipation of the next confirmed uptrend. See the noteworthy candidates included on the Featured Stocks Page.
Watch for an announcement via email concerning the Q3 2012 WEBCAST. The webcast will also be available via an updated link highlighted at the top of the Premium Member Homepage.
PICTURED: The Dow Jones Industrial Average is slumping toward its 200-day moving average (DMA) line and prior lows, continuing the previously noted market correction (M criteria). It found support near that important long-term average back in early-June. It would be an encouraging sign to see it make a stand near the 200 DMA line again, but subsequent deterioration would not bode well for the broader market outlook. Further weakness would be a signal for investors to reduce market exposure if they are not already entirely in cash. In this commentary we will continue to watch closely for an eventual rally and confirming gains within the ideal window for a proper FTD, meanwhile caution and patience are required.
|
 Kenneth J. Gruneisen started out as a licensed stockbroker in August 1987, a couple of months prior to the historic stock market crash that took the Dow Jones Industrial Average down -22.6% in a single day. He has published daily fact-based fundamental and technical analysis on high-ranked stocks online for two decades. Through FACTBASEDINVESTING.COM, Kenneth provides educational articles, news, market commentary, and other information regarding proven investment systems that work in good times and bad.
Comments contained in the body of this report are technical opinions only and are not necessarily those of Gruneisen Growth Corp. The material herein has been obtained from sources believed to be reliable and accurate, however, its accuracy and completeness cannot be guaranteed. Our firm, employees, and customers may effect transactions, including transactions contrary to any recommendation herein, or have positions in the securities mentioned herein or options with respect thereto. Any recommendation contained in this report may not be suitable for all investors and it is not to be deemed an offer or solicitation on our part with respect to the purchase or sale of any securities. |
|
 |
Tech Sector Weak; Gold & Silver Index Violates 50-Day Line
Kenneth J. Gruneisen - Passed the CAN SLIM® Master's Exam
The Internet Index ($IIX -2.25%), Networking Index ($NWX -1.70%), and Semiconductor Index ($SOX -1.51%) led the tech sector lower while the Biotechnology Index ($BTK -0.58%) suffered a smaller loss. The Healthcare Index ($HMO +1.15%) was a standout gainer while another defensive group, the Gold & Silver Index ($XAU -1.70%), was hit again with a loss. Weakness in the Oil Services Index ($OSX -1.67%) and the Retail Index ($RLX -1.04%) also created a negative drag. Financial shares were quiet as the Bank Index ($BKX -0.28%) edged lower and the Broker/Dealer Index ($XBD +0.32%) rose.
Charts courtesy www.stockcharts.com
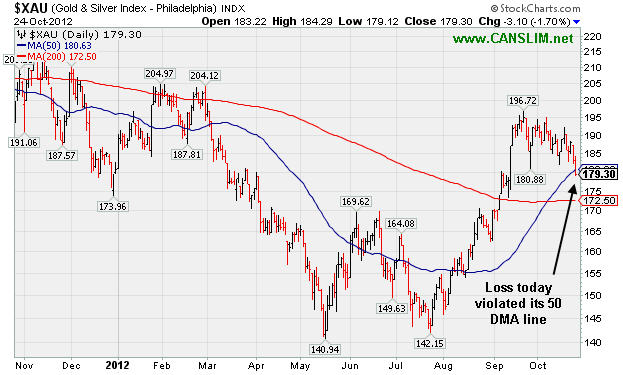
PICTURED: The Gold & Silver Index ($XAU -1.70%) fell to 4-week lows and violated its 50-day moving average (DMA) line.
| Oil Services |
$OSX |
220.13 |
-3.73 |
-1.67% |
+1.78% |
| Healthcare |
$HMO |
2,478.98 |
+28.07 |
+1.15% |
+8.65% |
| Integrated Oil |
$XOI |
1,214.15 |
-0.82 |
-0.07% |
-1.22% |
| Semiconductor |
$SOX |
360.52 |
-5.53 |
-1.51% |
-1.08% |
| Networking |
$NWX |
193.93 |
-3.35 |
-1.70% |
-9.87% |
| Internet |
$IIX |
301.68 |
-6.96 |
-2.25% |
+7.08% |
| Broker/Dealer |
$XBD |
83.23 |
+0.26 |
+0.32% |
-0.05% |
| Retail |
$RLX |
636.71 |
-6.70 |
-1.04% |
+21.70% |
| Gold & Silver |
$XAU |
179.30 |
-3.10 |
-1.70% |
-0.74% |
| Bank |
$BKX |
49.41 |
-0.14 |
-0.28% |
+25.47% |
| Biotech |
$BTK |
1,451.10 |
-8.40 |
-0.58% |
+32.95% |
|
|
|
 |
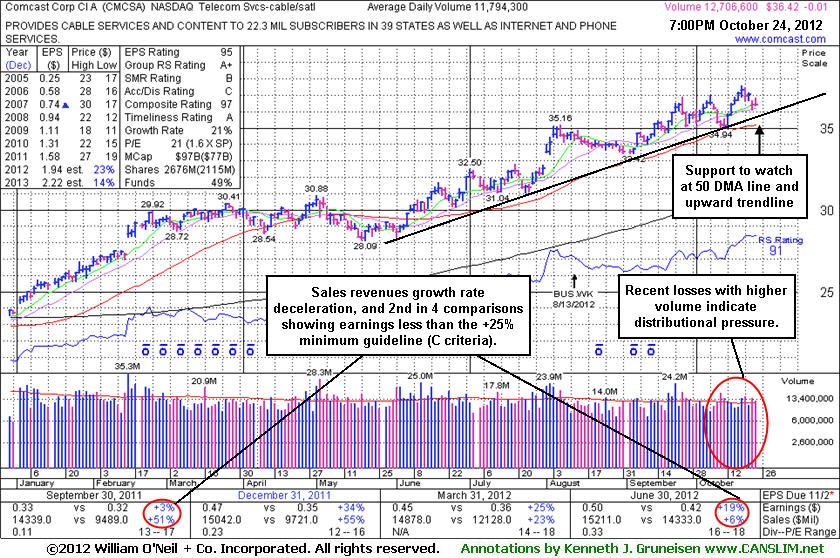
Trendline and 50-Day Moving Average Define Near-Term Support
Kenneth J. Gruneisen - Passed the CAN SLIM® Master's Exam
Comcast Corp Cl A (CMCSA -$0.17 or -0.48% to $34.19) is consolidating only -3.1% off its 52-week high with no resistance remaining due to overhead supply. The upward trendline connecting its June-October lows and its 50-day moving average (DMA) line define near-term support levels to watch where violations would trigger technical sell signals. Fundamental concerns have been repeatedly noted - "Due to sub par sales and earnings growth in the Jun '12 quarter."
Its last appearance in this FSU section with an annotated daily graph was on 9/21/12 under the headline, "Technically Strong, But Fundamental Flaws Raised Concerns". In the weeks that followed it gradually worked its way higher despite several down days marked by higher than average volume. That action is indicative of distributional pressure. Fundamental concerns were raised by sub par sales and earnings growth in the Jun '12 quarter. It recently reported earnings +19% on +6% sales revenues for the Jun '12 quarter, below the fact-based investment system's +25% minimum guideline for the C criteria.
Those who own it may give it the benefit of the doubt until there are any technical sell signals. However, buy candidates' earnings increases should be above the +25% guideline (C criteria) in 3 of the past 4 comparisons and, most ideally, they show signs of recent acceleration. In this case, decelerating sales revenues and earnings increases in the recent sequential quarters is cause for concern, fundamentally. Investors might find better odds in a buy candidate without any fundamental shortcomings.
Its annual earnings (A criteria) history has been strong and leadership from other firms in the Telecom Services - Cable/Satellite industry group is a reassuring sign concerning the L criteria. The number of top-rated funds owning its shares rose from 1,916 in Jun '11 to 2,149 in Sep '12, a reassuring sign concerning the I criteria. Its huge supply of 2.093 billion shares in the float could make it less likely to be a great sprinter, meanwhile, the S criteria calls for investors to usually look at small-cap or mid-cap companies.
|
|
|
Color Codes Explained :
Y - Better candidates highlighted by our
staff of experts.
G - Previously featured
in past reports as yellow but may no longer be buyable under the
guidelines.
***Last / Change / Volume data in this table is the closing quote data***
Symbol/Exchange
Company Name
Industry Group |
PRICE |
CHANGE
(%Change) |
Day High |
Volume
(% DAV)
(% 50 day avg vol) |
52 Wk Hi
% From Hi |
Featured
Date |
Price
Featured |
Pivot Featured |
|
Max Buy |
ASPS
-
NASDAQ
Altisource Ptf Sltns Sa
REAL ESTATE - Property Management/Developmen
|
$124.33
|
+14.57
13.27% |
$129.72
|
937,760
531.31% of 50 DAV
50 DAV is 176,500
|
$118.48
4.94%
|
9/24/2012
|
$87.24
|
PP = $92.39
|
|
MB = $97.01
|
 Most Recent Note - 10/24/2012 1:30:50 PM
G - Powering to new 52-week and all-time highs today with a considerable volume-driven gain. Previously noted - "Very extended from its prior base, its prior highs in the $92 area define initial support to watch on pullbacks."
>>> The latest Featured Stock Update with an annotated graph appeared on 10/12/2012. Click here.
View all notes |
Alert me of new notes |
CANSLIM.net Company Profile |
SEC |
Zacks Reports |
StockTalk |
News |
Chart |
Request a new note
C
A N
S L
I M


|
BRLI
-
NASDAQ
Bio Reference Labs Inc
HEALTH SERVICES - Medical Laboratories and Researc
|
$29.47
|
-0.53
-1.77% |
$30.10
|
443,457
139.15% of 50 DAV
50 DAV is 318,700
|
$32.86
-10.32%
|
10/3/2012
|
$30.90
|
PP = $30.25
|
|
MB = $31.76
|
Most Recent Note - 10/23/2012 6:32:57 PM
G - Damaging loss today with above average volume briefly undercut prior highs in the $30 area and tested support near its 50 DMA line. Further technical deterioration would raise more serious concerns.
>>> The latest Featured Stock Update with an annotated graph appeared on 10/8/2012. Click here.
View all notes |
Alert me of new notes |
CANSLIM.net Company Profile |
SEC |
Zacks Reports |
StockTalk |
News |
Chart |
Request a new note
C
A N
S L
I M
|
CFNL
-
NASDAQ
Cardinal Financial Corp
BANKING - Regional - Southeast Banks
|
$14.98
|
+0.81
5.71% |
$15.37
|
497,076
565.50% of 50 DAV
50 DAV is 87,900
|
$14.79
1.28%
|
8/17/2012
|
$12.84
|
PP = $13.31
|
|
MB = $13.98
|
Most Recent Note - 10/24/2012 12:15:57 PM
Y - Market conditions (M criteria) argue against any new buying efforts until a new confirmed rally in the broader market. CFNL is tallying another considerable gain with heavy volume today, spiking to a new 52-week high. Color code is changed to yellow however no new pivot point is cited, yet a valid secondary buy point otherwise exists from its recently successful test of support at its 10-week moving average (WMA) line up to +5% above its latest highs (9/24/12 high of $14.79 plus another +5%).
>>> The latest Featured Stock Update with an annotated graph appeared on 9/25/2012. Click here.
View all notes |
Alert me of new notes |
CANSLIM.net Company Profile |
SEC |
Zacks Reports |
StockTalk |
News |
Chart |
Request a new note
C
A N
S L
I M
|
CMCSA
-
NASDAQ
Comcast Corp Cl A
MEDIA - CATV Systems
|
$36.42
|
-0.01
-0.03% |
$36.85
|
12,721,591
107.86% of 50 DAV
50 DAV is 11,794,300
|
$37.60
-3.14%
|
6/11/2012
|
$29.94
|
PP = $30.98
|
|
MB = $32.53
|
Most Recent Note - 10/24/2012 7:23:53 PM
G - Upward trendline and 50 DMA line define near term support where violations would trigger technical sell signals. Fundamental concerns have been repeatedly noted - "Due to sub par sales and earnings growth in the Jun '12 quarter." See the latest FSU analysis for more details and a new annotated graph.
>>> The latest Featured Stock Update with an annotated graph appeared on 10/24/2012. Click here.
View all notes |
Alert me of new notes |
CANSLIM.net Company Profile |
SEC |
Zacks Reports |
StockTalk |
News |
Chart |
Request a new note
C
A N
S L
I M
|
DVA
-
NYSE
Davita Inc
HEALTH SERVICES - Specialized Health Services
|
$110.82
|
-0.56
-0.50% |
$112.00
|
925,939
120.36% of 50 DAV
50 DAV is 769,300
|
$113.48
-2.34%
|
9/5/2012
|
$102.92
|
PP = $100.62
|
|
MB = $105.65
|
Most Recent Note - 10/24/2012 4:03:29 PM
G - Hovering near its 52-week high, extended from its latest sound base. Prior highs near $100 and its 50 DMA line define near-term support to watch on pullbacks where violations may trigger technical sell signals.
>>> The latest Featured Stock Update with an annotated graph appeared on 10/10/2012. Click here.
View all notes |
Alert me of new notes |
CANSLIM.net Company Profile |
SEC |
Zacks Reports |
StockTalk |
News |
Chart |
Request a new note
C
A N
S L
I M
|
Symbol/Exchange
Company Name
Industry Group |
PRICE |
CHANGE
(%Change) |
Day High |
Volume
(% DAV)
(% 50 day avg vol) |
52 Wk Hi
% From Hi |
Featured
Date |
Price
Featured |
Pivot Featured |
|
Max Buy |
GPX
-
NYSE
G P Strategies Corp
DIVERSIFIED SERVICES - Education and Training Services
|
$18.84
|
+0.17
0.91% |
$18.96
|
16,549
27.31% of 50 DAV
50 DAV is 60,600
|
$20.67
-8.85%
|
10/8/2012
|
$20.00
|
PP = $20.77
|
|
MB = $21.81
|
Most Recent Note - 10/24/2012 4:06:49 PM
G - Gains have lacked volume conviction since violating its 50 DMA line, and its slump below its previously noted low ($18.82 on 10/04/12) raised more serious concerns and triggered a technical sell signal. Gains above its 50 DMA line are needed for its outlook to improve
>>> The latest Featured Stock Update with an annotated graph appeared on 10/16/2012. Click here.
View all notes |
Alert me of new notes |
CANSLIM.net Company Profile |
SEC |
Zacks Reports |
StockTalk |
News |
Chart |
Request a new note
C
A N
S L
I M
|
LKQ
-
NASDAQ
L K Q Corp
WHOLESALE - Auto Parts
|
$20.12
|
-0.18
-0.89% |
$20.51
|
1,631,604
113.33% of 50 DAV
50 DAV is 1,439,700
|
$21.22
-5.16%
|
8/9/2012
|
$18.97
|
PP = $18.72
|
|
MB = $19.66
|
Most Recent Note - 10/19/2012 6:22:23 PM
G - Perched near its all-time high today. Recently rallied well above its "max buy" level with no resistance remaining due to overhead supply. See latest FSU analysis for more details and a new annotated graph.
>>> The latest Featured Stock Update with an annotated graph appeared on 10/19/2012. Click here.
View all notes |
Alert me of new notes |
CANSLIM.net Company Profile |
SEC |
Zacks Reports |
StockTalk |
News |
Chart |
Request a new note
C
A N
S L
I M
|
MIDD
-
NASDAQ
Middleby Corp
MANUFACTURING - Diversified Machinery
|
$122.66
|
-0.01
-0.01% |
$124.23
|
61,058
78.48% of 50 DAV
50 DAV is 77,800
|
$123.95
-1.04%
|
10/8/2012
|
$118.46
|
PP = $122.67
|
|
MB = $128.80
|
Most Recent Note - 10/22/2012 6:52:50 PM
Y - Finished just -0.9% off its 52-week high today. Volume totals have been below average in recent weeks while stubbornly holding its ground. Subsequent volume-driven gains above the pivot point may trigger a new (or add-on) technical buy signal. Its 50 DMA line and recent lows define near-term chart support to watch. See the latest FSU analysis for more details and a new annotated graph.
>>> The latest Featured Stock Update with an annotated graph appeared on 10/22/2012. Click here.
View all notes |
Alert me of new notes |
CANSLIM.net Company Profile |
SEC |
Zacks Reports |
StockTalk |
News |
Chart |
Request a new note
C
A N
S L
I M
|
N
-
NYSE
Netsuite Inc
DIVERSIFIED SERVICES - Business/Management Services
|
$58.75
|
+0.98
1.70% |
$59.06
|
378,233
82.46% of 50 DAV
50 DAV is 458,700
|
$64.70
-9.20%
|
8/20/2012
|
$55.88
|
PP = $59.32
|
|
MB = $62.29
|
Most Recent Note - 10/22/2012 6:54:40 PM
G - Color code is changed to green after violating its prior highs in the $59 area and sinking below its 50 DMA line with higher volume today triggering technical sell signals.
>>> The latest Featured Stock Update with an annotated graph appeared on 9/24/2012. Click here.
View all notes |
Alert me of new notes |
CANSLIM.net Company Profile |
SEC |
Zacks Reports |
StockTalk |
News |
Chart |
Request a new note
C
A N
S L
I M
|
NSM
-
NYSE
Nationstar Mtg Hldgs Inc
FINANCIAL SERVICES - Credit Services
|
$31.51
|
-3.35
-9.61% |
$34.80
|
11,657,832
919.46% of 50 DAV
50 DAV is 1,267,900
|
$37.20
-15.30%
|
8/29/2012
|
$27.96
|
PP = $28.85
|
|
MB = $30.29
|
Most Recent Note - 10/24/2012 10:38:59 AM
G - Abruptly reversed recent gains, undercutting prior lows and violating the previously noted upward trendline today while slumping to its 50 DMA line with a damaging loss on heavy volume.
>>> The latest Featured Stock Update with an annotated graph appeared on 10/11/2012. Click here.
View all notes |
Alert me of new notes |
CANSLIM.net Company Profile |
SEC |
Zacks Reports |
StockTalk |
News |
Chart |
Request a new note
C
A N
S L
I M
|
Symbol/Exchange
Company Name
Industry Group |
PRICE |
CHANGE
(%Change) |
Day High |
Volume
(% DAV)
(% 50 day avg vol) |
52 Wk Hi
% From Hi |
Featured
Date |
Price
Featured |
Pivot Featured |
|
Max Buy |
OSIS
-
NASDAQ
O S I Systems Inc
ELECTRONICS - Semiconductor Equipment and Mate
|
$79.09
|
-0.53
-0.67% |
$80.92
|
133,883
109.11% of 50 DAV
50 DAV is 122,700
|
$79.90
-1.01%
|
9/5/2012
|
$74.39
|
PP = $75.10
|
|
MB = $78.86
|
Most Recent Note - 10/23/2012 6:38:54 PM
G - Rallied with +44% above average volume today for a best-ever close, bucking a negative market backdrop. Found support at its 50 DMA line this week, and its color code is changed to green while getting extended from its prior base.
>>> The latest Featured Stock Update with an annotated graph appeared on 10/18/2012. Click here.
View all notes |
Alert me of new notes |
CANSLIM.net Company Profile |
SEC |
Zacks Reports |
StockTalk |
News |
Chart |
Request a new note
C
A N
S L
I M
|
RNF
-
NYSE
Rentech Nitrogen Ptnr Lp
CHEMICALS - Agricultural Chemicals
|
$36.40
|
+0.16
0.44% |
$36.82
|
180,114
48.09% of 50 DAV
50 DAV is 374,500
|
$40.05
-9.11%
|
7/27/2012
|
$29.58
|
PP = $30.60
|
|
MB = $32.13
|
Most Recent Note - 10/23/2012 1:09:16 PM
G - Consolidating near its 50 DMA line defining important near-term support after the previously noted upward trendline violation. Gains have lacked volume conviction after it halted its slide.
>>> The latest Featured Stock Update with an annotated graph appeared on 10/4/2012. Click here.
View all notes |
Alert me of new notes |
CANSLIM.net Company Profile |
SEC |
Zacks Reports |
StockTalk |
News |
Chart |
Request a new note
C
A N
S L
I M
|
TDG
-
NYSE
Transdigm Group Inc
AEROSPACE/DEFENSE - Aerospace/Defense Products and; Services
|
$131.42
|
+0.15
0.11% |
$133.56
|
351,632
70.85% of 50 DAV
50 DAV is 496,300
|
$139.31
-5.66%
|
8/16/2012
|
$132.23
|
PP = $136.44
|
|
MB = $143.26
|
Most Recent Note - 10/23/2012 6:30:51 PM
G - Gapped down today and undercut its 50 DMA line following a special dividend, yet it promptly rebounded back above that important short-term average. See latest FSU analysis for more details and a new annotated graph.
>>> The latest Featured Stock Update with an annotated graph appeared on 10/23/2012. Click here.
View all notes |
Alert me of new notes |
CANSLIM.net Company Profile |
SEC |
Zacks Reports |
StockTalk |
News |
Chart |
Request a new note
C
A N
S L
I M
|
ULTA
-
NASDAQ
Ulta Salon Cosm & Frag
SPECIALTY RETAIL - Specialty Retail, Other
|
$93.14
|
-0.90
-0.96% |
$94.78
|
626,333
80.12% of 50 DAV
50 DAV is 781,700
|
$103.52
-10.03%
|
9/4/2012
|
$93.17
|
PP = $98.52
|
|
MB = $103.45
|
Most Recent Note - 10/24/2012 4:09:17 PM
G - Sputtering below its 50 DMA line with losses this week on lighter volume. A rebound above that important short-term average is needed for its outlook to improve. The latest FSU analysis discussed its waning Relative Strength under the headline "Relative Strength Line Did Not Provide Confirmation - Friday, October 05, 2012".
>>> The latest Featured Stock Update with an annotated graph appeared on 10/5/2012. Click here.
View all notes |
Alert me of new notes |
CANSLIM.net Company Profile |
SEC |
Zacks Reports |
StockTalk |
News |
Chart |
Request a new note
C
A N
S L
I M
|
ULTI
-
NASDAQ
Ultimate Software Group
INTERNET - Internet Software and Services
|
$96.29
|
-0.93
-0.96% |
$97.97
|
98,867
66.94% of 50 DAV
50 DAV is 147,700
|
$106.40
-9.50%
|
8/27/2012
|
$98.36
|
PP = $99.19
|
|
MB = $104.15
|
Most Recent Note - 10/24/2012 4:10:36 PM
G - Halted its slide after recently undercutting prior lows in the $96 area and violating its 50 DMA line triggering technical sell signals. A rebound above its 50 DMA line is needed for its outlook to improve
>>> The latest Featured Stock Update with an annotated graph appeared on 9/27/2012. Click here.
View all notes |
Alert me of new notes |
CANSLIM.net Company Profile |
SEC |
Zacks Reports |
StockTalk |
News |
Chart |
Request a new note
C
A N
S L
I M
|
Symbol/Exchange
Company Name
Industry Group |
PRICE |
CHANGE
(%Change) |
Day High |
Volume
(% DAV)
(% 50 day avg vol) |
52 Wk Hi
% From Hi |
Featured
Date |
Price
Featured |
Pivot Featured |
|
Max Buy |
VSI
-
NYSE
Vitamin Shoppe Inc
SPECIALTY RETAIL - Specialty Retail, Other
|
$56.58
|
-1.28
-2.21% |
$57.96
|
167,651
56.79% of 50 DAV
50 DAV is 295,200
|
$61.83
-8.48%
|
10/15/2012
|
$57.82
|
PP = $60.08
|
|
MB = $63.08
|
Most Recent Note - 10/24/2012 4:12:54 PM
G - Volume was below average while its slumped below its 50 DMA line today and its color code was changed to green. A rebound above that important short-term average would help its stance, and subsequent volume-driven gains are needed to trigger a new technical buy signal.
>>> The latest Featured Stock Update with an annotated graph appeared on 10/15/2012. Click here.
View all notes |
Alert me of new notes |
CANSLIM.net Company Profile |
SEC |
Zacks Reports |
StockTalk |
News |
Chart |
Request a new note
C
A N
S L
I M
|
WPI
-
NYSE
Watson Pharmaceuticals
DRUGS - Drugs - Generic
|
$85.90
|
-0.11
-0.13% |
$87.07
|
758,092
83.28% of 50 DAV
50 DAV is 910,300
|
$89.90
-4.45%
|
8/24/2012
|
$82.90
|
PP = $81.10
|
|
MB = $85.16
|
Most Recent Note - 10/23/2012 6:41:14 PM
G - Retreating from its 52-week high with another loss on below average volume. Its 50 DMA line defines important near-term support to watch.
>>> The latest Featured Stock Update with an annotated graph appeared on 9/28/2012. Click here.
View all notes |
Alert me of new notes |
CANSLIM.net Company Profile |
SEC |
Zacks Reports |
StockTalk |
News |
Chart |
Request a new note
C
A N
S L
I M
|
|
|
|
THESE ARE NOT BUY RECOMMENDATIONS!
Comments contained in the body of this report are technical
opinions only. The material herein has been obtained
from sources believed to be reliable and accurate, however,
its accuracy and completeness cannot be guaranteed.
This site is not an investment advisor, hence it does
not endorse or recommend any securities or other investments.
Any recommendation contained in this report may not
be suitable for all investors and it is not to be deemed
an offer or solicitation on our part with respect to
the purchase or sale of any securities. All trademarks,
service marks and trade names appearing in this report
are the property of their respective owners, and are
likewise used for identification purposes only.
This report is a service available
only to active Paid Premium Members.
You may opt-out of receiving report notifications
at any time. Questions or comments may be submitted
by writing to Premium Membership Services 665 S.E. 10 Street, Suite 201 Deerfield Beach, FL 33441-5634 or by calling 1-800-965-8307
or 954-785-1121.
|
|
|

