You are not logged in.
This means you
CAN ONLY VIEW reports that were published prior to Monday, April 14, 2025.
You
MUST UPGRADE YOUR MEMBERSHIP if you want to see any current reports.
AFTER MARKET UPDATE - TUESDAY, OCTOBER 23RD, 2012
Previous After Market Report Next After Market Report >>>
|
|
|
|
DOW |
-243.36 |
13,102.53 |
-1.82% |
|
Volume |
670,856,850 |
+6% |
|
Volume |
1,758,120,130 |
+9% |
|
NASDAQ |
-26.50 |
2,990.46 |
-0.88% |
|
Advancers |
806 |
26% |
|
Advancers |
884 |
34% |
|
S&P 500 |
-20.71 |
1,413.11 |
-1.44% |
|
Decliners |
2,236 |
71% |
|
Decliners |
1,593 |
61% |
|
Russell 2000 |
-4.32 |
816.20 |
-0.53% |
|
52 Wk Highs |
31 |
|
|
52 Wk Highs |
22 |
|
|
S&P 600 |
-1.97 |
456.40 |
-0.43% |
|
52 Wk Lows |
41 |
|
|
52 Wk Lows |
88 |
|
|
 |
Breadth Negative and Volume Swells As Market Correction Worsens
Kenneth J. Gruneisen - Passed the CAN SLIM® Master's Exam
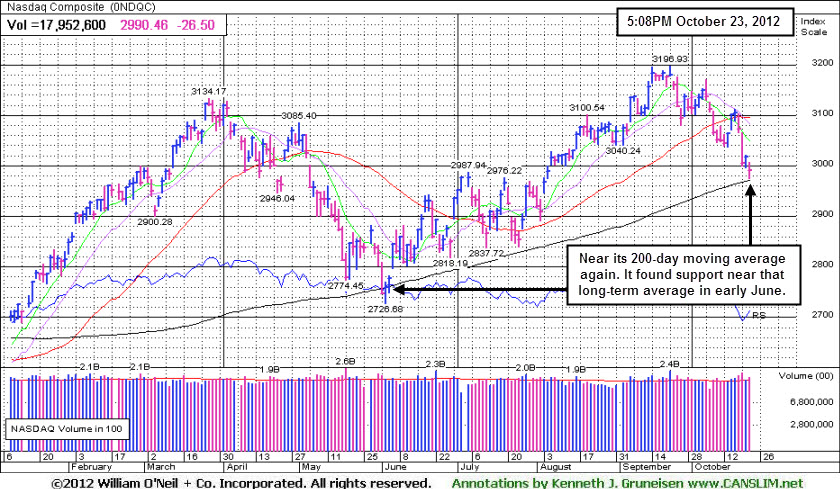
The major averages finished near their worst levels of the session with large losses on Tuesday. The Dow experienced its biggest loss since June as it closed down 243 points to 13,102. The S&P 500 Index lost 20 points to 1,413 and the Nasdaq Composite Index gave up 26 points to 2,990. The volume totals were reported higher on the NYSE and on the Nasdaq exchange versus the prior session's totals, a sign that institutional investors were more aggressively unloading stocks. Breadth was negative as decliners led advancers by an 11-4 margin on the NYSE and by nearly 2-1 on the Nasdaq exchange. The total number of stocks hitting new 52-week lows continued to shrink. New 52-week highs still led new lows on the NYSE. On the Nasdaq exchange 4 times as many stocks hit new 52-week lows versus new 52-week highs. Leadership waned, and only 5 high-ranked companies from the CANSLIM.net Leaders List made new 52-week highs and appeared on the CANSLIM.net BreakOuts Page, down from the prior session total of 13 stocks. There were gains for 6 of the 17 high-ranked companies currently included on the Featured Stocks Page, a list of noteworthy leaders that has recently been getting trimmed.
Another round of disappointing profit tallies pushed stocks lower. Material stocks paced the decline as E. I. du Pont de Nemours and Company (DD -9.06%) shares were slashed due to weak earnings and full-year guidance. Other Dow components also fell short of expectations. 3M Co (MMM -4.11%) dropped after revenue came in lighter than anticipated. On the upside, United Parcel Service Inc (UPS +3.03%) gained after its results met expectations and offered a tighter guidance range due to improved fourth-quarter confidence.
Technology was also in focus. Yahoo! Inc's (YHOO +5.71%) new CEO delivered an encouraging turnaround strategy and its shares rose against the market's negative backdrop. Meanwhile, Apple Inc (AAPL -3.26%) fell following the unveiling of new products. Facebook Inc (FB +0.93%) garnered attention with its earnings report after the close. The world's biggest social media company posted a loss of $59 million, or 2 cents per share. That's down from earnings of $227 million, or 10 cents per share a year ago, when Facebook was still privately held.
In fixed-income, Treasuries held onto gains after the government's auction of 2-year notes received record demand. The 10-year note was up 17/32 to yield 1.75% and the 30-year bond gained nearly a full point and a half to yield 2.90%.
During market corrections the M criteria argues against new buying efforts and urges investors to take a defensive stance to protect precious capital. That stance can change back to a bullish stance where buying is encouraged when at least one of the three major averages produces a solid follow-through day (FTD). A FTD confirming a new rally requires substantial gains on higher (ideally above average) volume, coupled with healthy leadership and a respectable number of stocks hitting new 52-week highs. Historic studies have shown that a FTD occurring between Days 4-7 of a new rally effort has often signaled the beginning of the most substantial market rallies.
Investors should always limit losses if ever any stock falls more than -7% from their purchase price. Following strict sell rules is precisely how this fact-based investment system prompts investors to reduce exposure and protect cash during market downturns. Keep a watchlist of strong acting stocks with all-key criteria in anticipation of the next confirmed uptrend. See the noteworthy candidates included on the Featured Stocks Page.
Watch for an announcement via email concerning the Q3 2012 WEBCAST. The webcast will also be available via an updated link highlighted at the top of the Premium Member Homepage.
PICTURED: The Nasdaq Composite Index sank near its 200-day moving average (DMA) line, continuing the previously noted market correction (M criteria). It found support near that important long-term average back in early-June. It would be an encouraging sign to see it make a stand near the 200 DMA line again, but subsequent deterioration would not bode well for the broader market outlook. In this commentary we will continue to watch closely for an eventual rally and confirming gains within the ideal window for a proper FTD, meanwhile caution and patience are required.
|
 Kenneth J. Gruneisen started out as a licensed stockbroker in August 1987, a couple of months prior to the historic stock market crash that took the Dow Jones Industrial Average down -22.6% in a single day. He has published daily fact-based fundamental and technical analysis on high-ranked stocks online for two decades. Through FACTBASEDINVESTING.COM, Kenneth provides educational articles, news, market commentary, and other information regarding proven investment systems that work in good times and bad.
Comments contained in the body of this report are technical opinions only and are not necessarily those of Gruneisen Growth Corp. The material herein has been obtained from sources believed to be reliable and accurate, however, its accuracy and completeness cannot be guaranteed. Our firm, employees, and customers may effect transactions, including transactions contrary to any recommendation herein, or have positions in the securities mentioned herein or options with respect thereto. Any recommendation contained in this report may not be suitable for all investors and it is not to be deemed an offer or solicitation on our part with respect to the purchase or sale of any securities. |
|
 |
Commodity-Linked Groups and Financial Indexes Fell
Kenneth J. Gruneisen - Passed the CAN SLIM® Master's Exam
Commodity-linked groups led decliners as the Gold & Silver Index ($XAU -3.01%), Integrated Oil Index ($XOI -2.59%), and Oil Services Index ($OSX -1.96%) sank. Financial shares also had a negative bias as the Bank Index ($BKX -1.73%) and Broker/Dealer Index ($XBD -1.32%) tumbled. The Healthcare Index ($HMO -0.80%) suffered a small loss and the Biotechnology Index ($BTK -2.24%) was stuck with a larger loss. The rest of the tech sector finished near the flat line as the Networking Index ($NWX -0.18%), Internet Index ($IIX +0.09%), and Semiconductor Index ($SOX +0.15%) were little changed on the session and the Retail Index ($RLX -0.07%) held its ground.
Charts courtesy www.stockcharts.com
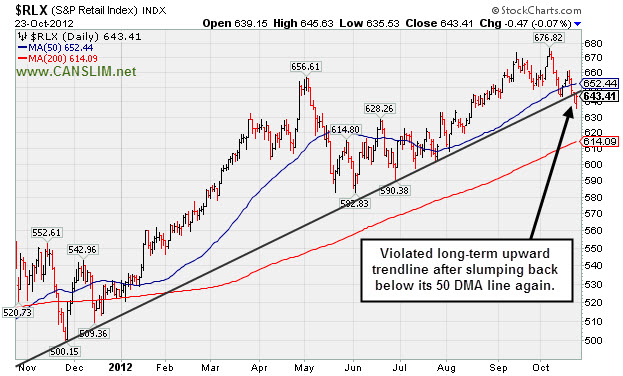
PICTURED: The Retail Index ($RLX -0.07%) finished nearly unchanged on Tuesday after early weakness. After slumping back below its 50-day moving average (DMA) line again with recent losses, its violation of a long-term upward trendline suggests that the previously strong trend in retail issues may be shifting.
| Oil Services |
$OSX |
223.86 |
-4.48 |
-1.96% |
+3.50% |
| Healthcare |
$HMO |
2,450.90 |
-19.65 |
-0.80% |
+7.42% |
| Integrated Oil |
$XOI |
1,214.97 |
-32.35 |
-2.59% |
-1.15% |
| Semiconductor |
$SOX |
366.05 |
+0.54 |
+0.15% |
+0.44% |
| Networking |
$NWX |
197.28 |
-0.35 |
-0.18% |
-8.31% |
| Internet |
$IIX |
308.64 |
+0.29 |
+0.09% |
+9.55% |
| Broker/Dealer |
$XBD |
82.97 |
-1.11 |
-1.32% |
-0.36% |
| Retail |
$RLX |
643.41 |
-0.47 |
-0.07% |
+22.98% |
| Gold & Silver |
$XAU |
182.40 |
-5.67 |
-3.01% |
+0.97% |
| Bank |
$BKX |
49.55 |
-0.87 |
-1.73% |
+25.83% |
| Biotech |
$BTK |
1,459.49 |
-33.46 |
-2.24% |
+33.72% |
|
|
|
 |
Resilient Near 50-Day Moving Average Line Following Special Dividend
Kenneth J. Gruneisen - Passed the CAN SLIM® Master's Exam
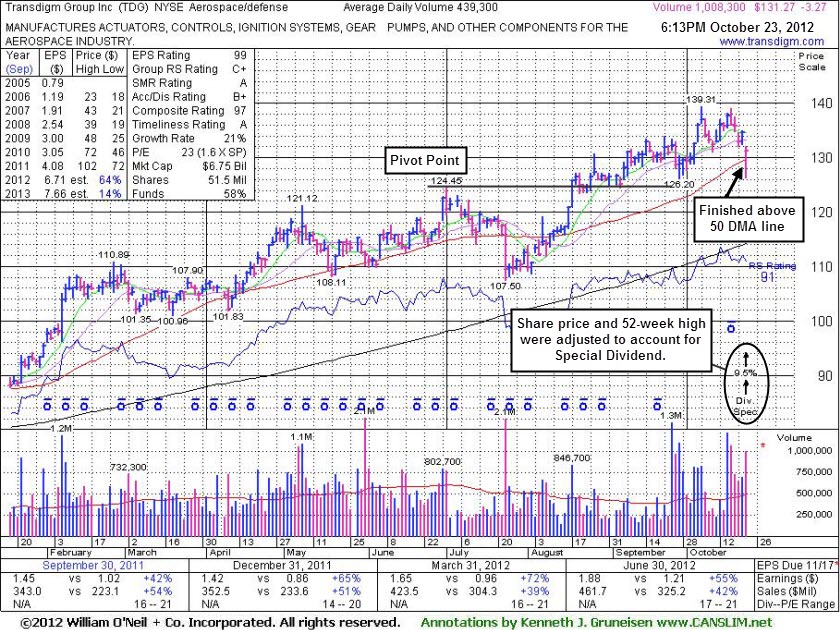
Transdigm Group Inc (TDG -$3.27 or -2.43% to $131.27) gapped down today and raised concerns as it undercut its 50-day moving average (DMA) line, then it promptly rebounded back above that important short-term average. Recently it was noted as extended from its prior base. It was also noted when churning heavy volume without making meaningful price progress, price/volume action that has often been noted in past examples as a sign of distributional pressure. Members may review prior analysis via the "view all notes" link on any stocks highlighted in CANSLIM.net reports.
On Monday its board of directors approved a special dividend of $12.85 a share. TransDigm will pay the dividend Nov. 5 to shareholders of record Oct. 25. The high-ranked Aerospace/Defense firm's last appearance in this FSU section was on 9/20/12 with an annotated graph under the headline, "Volume Light While Consolidating Under "Max Buy" Level" while hovering near new 52-week and all-time highs. Since then it stubbornly held its ground above prior highs and went on to rally further into new high territory. On the annotated graph below you will see that prices have been adjusted to account for the one-time dividend. Do not be confused when looking back at prior reports and data provided which may have not yet been adjusted accordingly.
Its current Up/Down Volume ratio of 1.9 is an unbiased indication that its shares were under accumulation over the past 50 days. The number of top-rated funds owning its share rose from 387 in Sep '11 to 518 in Sep '12, a reassuring trend concerning the I criteria. It reported earnings +55% on +42% sales revenues for the quarter ended June 30, 2012 versus the year ago period. Earnings comparisons above the +25% minimum guideline for earnings growth have solidly satisfied the C criteria. Its strong annual earnings history also satisfies the A criteria. In recent years it had rebounded and rallied to new highs following a deep consolidation after it was dropped from the Featured Stocks list 1/17/08.
|
|
|
Color Codes Explained :
Y - Better candidates highlighted by our
staff of experts.
G - Previously featured
in past reports as yellow but may no longer be buyable under the
guidelines.
***Last / Change / Volume data in this table is the closing quote data***
Symbol/Exchange
Company Name
Industry Group |
PRICE |
CHANGE
(%Change) |
Day High |
Volume
(% DAV)
(% 50 day avg vol) |
52 Wk Hi
% From Hi |
Featured
Date |
Price
Featured |
Pivot Featured |
|
Max Buy |
ASPS
-
NASDAQ
Altisource Ptf Sltns Sa
REAL ESTATE - Property Management/Developmen
|
$109.76
|
-2.27
-2.03% |
$111.00
|
272,196
156.61% of 50 DAV
50 DAV is 173,800
|
$118.48
-7.36%
|
9/24/2012
|
$87.24
|
PP = $92.39
|
|
MB = $97.01
|
 Most Recent Note - 10/23/2012 1:17:16 PM
G - Pulling back further today, slumping -5.4% off its 52-week high. Very extended from its prior base, its prior highs in the $92 area define initial support to watch on pullbacks.
>>> The latest Featured Stock Update with an annotated graph appeared on 10/12/2012. Click here.
View all notes |
Alert me of new notes |
CANSLIM.net Company Profile |
SEC |
Zacks Reports |
StockTalk |
News |
Chart |
Request a new note
C
A N
S L
I M


|
BRLI
-
NASDAQ
Bio Reference Labs Inc
HEALTH SERVICES - Medical Laboratories and Researc
|
$30.00
|
-0.98
-3.16% |
$30.88
|
619,725
200.36% of 50 DAV
50 DAV is 309,300
|
$32.86
-8.70%
|
10/3/2012
|
$30.90
|
PP = $30.25
|
|
MB = $31.76
|
Most Recent Note - 10/23/2012 6:32:57 PM
G - Damaging loss today with above average volume briefly undercut prior highs in the $30 area and tested support near its 50 DMA line. Further technical deterioration would raise more serious concerns.
>>> The latest Featured Stock Update with an annotated graph appeared on 10/8/2012. Click here.
View all notes |
Alert me of new notes |
CANSLIM.net Company Profile |
SEC |
Zacks Reports |
StockTalk |
News |
Chart |
Request a new note
C
A N
S L
I M
|
CFNL
-
NASDAQ
Cardinal Financial Corp
BANKING - Regional - Southeast Banks
|
$14.17
|
+0.50
3.66% |
$14.24
|
184,376
216.40% of 50 DAV
50 DAV is 85,200
|
$14.79
-4.19%
|
8/17/2012
|
$12.84
|
PP = $13.31
|
|
MB = $13.98
|
Most Recent Note - 10/23/2012 6:34:43 PM
G - Tallied a considerable gain today with heavy volume, and it recently found prompt support near its 50 DMA line. Subsequent deterioration below that short-term average would raise more serious concerns.
>>> The latest Featured Stock Update with an annotated graph appeared on 9/25/2012. Click here.
View all notes |
Alert me of new notes |
CANSLIM.net Company Profile |
SEC |
Zacks Reports |
StockTalk |
News |
Chart |
Request a new note
C
A N
S L
I M
|
CMCSA
-
NASDAQ
Comcast Corp Cl A
MEDIA - CATV Systems
|
$36.43
|
-0.60
-1.62% |
$36.69
|
14,041,879
119.56% of 50 DAV
50 DAV is 11,744,800
|
$37.60
-3.11%
|
6/11/2012
|
$29.94
|
PP = $30.98
|
|
MB = $32.53
|
Most Recent Note - 10/19/2012 12:28:36 PM
G - Pulling back today after a streak of 5 consecutive gains to new 52-week high territory. Found support while consolidating above prior highs in the $35 area and its 50 DMA line. Violations would trigger technical sell signals. Fundamental concerns have been repeatedly noted - "Due to sub par sales and earnings growth in the Jun '12 quarter."
>>> The latest Featured Stock Update with an annotated graph appeared on 9/21/2012. Click here.
View all notes |
Alert me of new notes |
CANSLIM.net Company Profile |
SEC |
Zacks Reports |
StockTalk |
News |
Chart |
Request a new note
C
A N
S L
I M
|
DVA
-
NYSE
Davita Inc
HEALTH SERVICES - Specialized Health Services
|
$111.38
|
-0.62
-0.55% |
$112.45
|
760,327
99.36% of 50 DAV
50 DAV is 765,200
|
$113.48
-1.85%
|
9/5/2012
|
$102.92
|
PP = $100.62
|
|
MB = $105.65
|
Most Recent Note - 10/18/2012 10:22:20 AM
G - Hitting another new 52-week high today, getting more extended from its latest sound base. Prior highs near $100 and its 50 DMA line define near-term support to watch on pullbacks where violations may trigger technical sell signals.
>>> The latest Featured Stock Update with an annotated graph appeared on 10/10/2012. Click here.
View all notes |
Alert me of new notes |
CANSLIM.net Company Profile |
SEC |
Zacks Reports |
StockTalk |
News |
Chart |
Request a new note
C
A N
S L
I M
|
Symbol/Exchange
Company Name
Industry Group |
PRICE |
CHANGE
(%Change) |
Day High |
Volume
(% DAV)
(% 50 day avg vol) |
52 Wk Hi
% From Hi |
Featured
Date |
Price
Featured |
Pivot Featured |
|
Max Buy |
GPX
-
NYSE
G P Strategies Corp
DIVERSIFIED SERVICES - Education and Training Services
|
$18.67
|
+0.15
0.81% |
$18.70
|
19,049
30.05% of 50 DAV
50 DAV is 63,400
|
$20.67
-9.68%
|
10/8/2012
|
$20.00
|
PP = $20.77
|
|
MB = $21.81
|
Most Recent Note - 10/18/2012 4:39:01 PM
G - Slumped below its 50 DMA line today on light volume and finished at the session low and near recent lows. Losses exceeding its recent low ($18.82 on 10/04/12) would raise more serious concerns and trigger technical sell signals. Volume driven gains above the pivot point have not triggered a new (or add-on) technical buy signal.
>>> The latest Featured Stock Update with an annotated graph appeared on 10/16/2012. Click here.
View all notes |
Alert me of new notes |
CANSLIM.net Company Profile |
SEC |
Zacks Reports |
StockTalk |
News |
Chart |
Request a new note
C
A N
S L
I M
|
LKQ
-
NASDAQ
L K Q Corp
WHOLESALE - Auto Parts
|
$20.30
|
-0.16
-0.78% |
$20.72
|
1,356,325
94.10% of 50 DAV
50 DAV is 1,441,400
|
$21.22
-4.31%
|
8/9/2012
|
$18.97
|
PP = $18.72
|
|
MB = $19.66
|
Most Recent Note - 10/19/2012 6:22:23 PM
G - Perched near its all-time high today. Recently rallied well above its "max buy" level with no resistance remaining due to overhead supply. See latest FSU analysis for more details and a new annotated graph.
>>> The latest Featured Stock Update with an annotated graph appeared on 10/19/2012. Click here.
View all notes |
Alert me of new notes |
CANSLIM.net Company Profile |
SEC |
Zacks Reports |
StockTalk |
News |
Chart |
Request a new note
C
A N
S L
I M
|
MIDD
-
NASDAQ
Middleby Corp
MANUFACTURING - Diversified Machinery
|
$122.67
|
-0.13
-0.11% |
$123.09
|
47,709
59.56% of 50 DAV
50 DAV is 80,100
|
$123.95
-1.03%
|
10/8/2012
|
$118.46
|
PP = $122.67
|
|
MB = $128.80
|
Most Recent Note - 10/22/2012 6:52:50 PM
Y - Finished just -0.9% off its 52-week high today. Volume totals have been below average in recent weeks while stubbornly holding its ground. Subsequent volume-driven gains above the pivot point may trigger a new (or add-on) technical buy signal. Its 50 DMA line and recent lows define near-term chart support to watch. See the latest FSU analysis for more details and a new annotated graph.
>>> The latest Featured Stock Update with an annotated graph appeared on 10/22/2012. Click here.
View all notes |
Alert me of new notes |
CANSLIM.net Company Profile |
SEC |
Zacks Reports |
StockTalk |
News |
Chart |
Request a new note
C
A N
S L
I M
|
N
-
NYSE
Netsuite Inc
DIVERSIFIED SERVICES - Business/Management Services
|
$57.77
|
-0.18
-0.31% |
$57.91
|
570,527
125.75% of 50 DAV
50 DAV is 453,700
|
$64.70
-10.71%
|
8/20/2012
|
$55.88
|
PP = $59.32
|
|
MB = $62.29
|
Most Recent Note - 10/22/2012 6:54:40 PM
G - Color code is changed to green after violating its prior highs in the $59 area and sinking below its 50 DMA line with higher volume today triggering technical sell signals.
>>> The latest Featured Stock Update with an annotated graph appeared on 9/24/2012. Click here.
View all notes |
Alert me of new notes |
CANSLIM.net Company Profile |
SEC |
Zacks Reports |
StockTalk |
News |
Chart |
Request a new note
C
A N
S L
I M
|
NSM
-
NYSE
Nationstar Mtg Hldgs Inc
FINANCIAL SERVICES - Credit Services
|
$34.86
|
+0.52
1.51% |
$36.46
|
3,121,737
256.09% of 50 DAV
50 DAV is 1,219,000
|
$37.20
-6.29%
|
8/29/2012
|
$27.96
|
PP = $28.85
|
|
MB = $30.29
|
Most Recent Note - 10/23/2012 12:26:47 PM
G - Rallying near its 52-week high today with a considerable volume-driven gain, bucking broad-based market (bad M criteria) weakness. It did not form a sound new base or secondary buy point, however it found support after slumping near a previously noted steep upward trendline connecting July-September lows defining near-term support above its 50 DMA line.
>>> The latest Featured Stock Update with an annotated graph appeared on 10/11/2012. Click here.
View all notes |
Alert me of new notes |
CANSLIM.net Company Profile |
SEC |
Zacks Reports |
StockTalk |
News |
Chart |
Request a new note
C
A N
S L
I M
|
Symbol/Exchange
Company Name
Industry Group |
PRICE |
CHANGE
(%Change) |
Day High |
Volume
(% DAV)
(% 50 day avg vol) |
52 Wk Hi
% From Hi |
Featured
Date |
Price
Featured |
Pivot Featured |
|
Max Buy |
OSIS
-
NASDAQ
O S I Systems Inc
ELECTRONICS - Semiconductor Equipment and Mate
|
$79.62
|
+2.79
3.63% |
$79.86
|
176,859
144.02% of 50 DAV
50 DAV is 122,800
|
$79.90
-0.35%
|
9/5/2012
|
$74.39
|
PP = $75.10
|
|
MB = $78.86
|
Most Recent Note - 10/23/2012 6:38:54 PM
G - Rallied with +44% above average volume today for a best-ever close, bucking a negative market backdrop. Found support at its 50 DMA line this week, and its color code is changed to green while getting extended from its prior base.
>>> The latest Featured Stock Update with an annotated graph appeared on 10/18/2012. Click here.
View all notes |
Alert me of new notes |
CANSLIM.net Company Profile |
SEC |
Zacks Reports |
StockTalk |
News |
Chart |
Request a new note
C
A N
S L
I M
|
RNF
-
NYSE
Rentech Nitrogen Ptnr Lp
CHEMICALS - Agricultural Chemicals
|
$36.24
|
-0.28
-0.77% |
$37.00
|
251,403
65.85% of 50 DAV
50 DAV is 381,800
|
$40.05
-9.51%
|
7/27/2012
|
$29.58
|
PP = $30.60
|
|
MB = $32.13
|
Most Recent Note - 10/23/2012 1:09:16 PM
G - Consolidating near its 50 DMA line defining important near-term support after the previously noted upward trendline violation. Gains have lacked volume conviction after it halted its slide.
>>> The latest Featured Stock Update with an annotated graph appeared on 10/4/2012. Click here.
View all notes |
Alert me of new notes |
CANSLIM.net Company Profile |
SEC |
Zacks Reports |
StockTalk |
News |
Chart |
Request a new note
C
A N
S L
I M
|
TDG
-
NYSE
Transdigm Group Inc
AEROSPACE/DEFENSE - Aerospace/Defense Products and; Services
|
$131.27
|
-3.27
-2.43% |
$132.15
|
1,008,774
229.63% of 50 DAV
50 DAV is 439,300
|
$152.62
-13.99%
|
8/16/2012
|
$132.23
|
PP = $136.44
|
|
MB = $143.26
|
Most Recent Note - 10/23/2012 6:30:51 PM
G - Gapped down today and undercut its 50 DMA line following a special dividend, yet it promptly rebounded back above that important short-term average. See latest FSU analysis for more details and a new annotated graph.
>>> The latest Featured Stock Update with an annotated graph appeared on 10/23/2012. Click here.
View all notes |
Alert me of new notes |
CANSLIM.net Company Profile |
SEC |
Zacks Reports |
StockTalk |
News |
Chart |
Request a new note
C
A N
S L
I M
|
ULTA
-
NASDAQ
Ulta Salon Cosm & Frag
SPECIALTY RETAIL - Specialty Retail, Other
|
$94.04
|
-0.97
-1.02% |
$94.69
|
471,745
59.81% of 50 DAV
50 DAV is 788,700
|
$103.52
-9.16%
|
9/4/2012
|
$93.17
|
PP = $98.52
|
|
MB = $103.45
|
Most Recent Note - 10/18/2012 1:13:56 PM
G - Color code is changed to green while encountering distributional pressure and sputtering near its 50 DMA line. Its Relative Strength Rating has slumped to 77, below the 80+ minimum rank for ideal buy candidates under the fact-based investment system. The latest FSU analysis discussed its waning Relative Strength under the headline "Relative Strength Line Did Not Provide Confirmation - Friday, October 05, 2012".
>>> The latest Featured Stock Update with an annotated graph appeared on 10/5/2012. Click here.
View all notes |
Alert me of new notes |
CANSLIM.net Company Profile |
SEC |
Zacks Reports |
StockTalk |
News |
Chart |
Request a new note
C
A N
S L
I M
|
ULTI
-
NASDAQ
Ultimate Software Group
INTERNET - Internet Software and Services
|
$97.22
|
+1.12
1.17% |
$97.58
|
134,690
92.06% of 50 DAV
50 DAV is 146,300
|
$106.40
-8.63%
|
8/27/2012
|
$98.36
|
PP = $99.19
|
|
MB = $104.15
|
Most Recent Note - 10/22/2012 12:57:44 PM
G - Up from today's earlier lows following 5 consecutive losses. Raised concerns as it undercut prior lows in the $96 area after violating its 50 DMA line, triggering technical sell signals. A rebound above its 50 DMA line is needed for its outlook to improve
>>> The latest Featured Stock Update with an annotated graph appeared on 9/27/2012. Click here.
View all notes |
Alert me of new notes |
CANSLIM.net Company Profile |
SEC |
Zacks Reports |
StockTalk |
News |
Chart |
Request a new note
C
A N
S L
I M
|
Symbol/Exchange
Company Name
Industry Group |
PRICE |
CHANGE
(%Change) |
Day High |
Volume
(% DAV)
(% 50 day avg vol) |
52 Wk Hi
% From Hi |
Featured
Date |
Price
Featured |
Pivot Featured |
|
Max Buy |
VSI
-
NYSE
Vitamin Shoppe Inc
SPECIALTY RETAIL - Specialty Retail, Other
|
$57.86
|
+0.23
0.40% |
$58.47
|
140,863
46.46% of 50 DAV
50 DAV is 303,200
|
$61.83
-6.41%
|
10/15/2012
|
$57.82
|
PP = $60.08
|
|
MB = $63.08
|
Most Recent Note - 10/19/2012 4:48:44 PM
Y - Volume totals have been below average in recent weeks while consolidating near its 50 DMA line. Color code was changed to yellow while still building on a new base, and subsequent volume-driven gains are needed to trigger a new technical buy signal.
>>> The latest Featured Stock Update with an annotated graph appeared on 10/15/2012. Click here.
View all notes |
Alert me of new notes |
CANSLIM.net Company Profile |
SEC |
Zacks Reports |
StockTalk |
News |
Chart |
Request a new note
C
A N
S L
I M
|
WPI
-
NYSE
Watson Pharmaceuticals
DRUGS - Drugs - Generic
|
$86.01
|
-1.43
-1.64% |
$87.32
|
725,495
79.47% of 50 DAV
50 DAV is 912,900
|
$89.90
-4.33%
|
8/24/2012
|
$82.90
|
PP = $81.10
|
|
MB = $85.16
|
Most Recent Note - 10/23/2012 6:41:14 PM
G - Retreating from its 52-week high with another loss on below average volume. Its 50 DMA line defines important near-term support to watch.
>>> The latest Featured Stock Update with an annotated graph appeared on 9/28/2012. Click here.
View all notes |
Alert me of new notes |
CANSLIM.net Company Profile |
SEC |
Zacks Reports |
StockTalk |
News |
Chart |
Request a new note
C
A N
S L
I M
|
|
|
|
THESE ARE NOT BUY RECOMMENDATIONS!
Comments contained in the body of this report are technical
opinions only. The material herein has been obtained
from sources believed to be reliable and accurate, however,
its accuracy and completeness cannot be guaranteed.
This site is not an investment advisor, hence it does
not endorse or recommend any securities or other investments.
Any recommendation contained in this report may not
be suitable for all investors and it is not to be deemed
an offer or solicitation on our part with respect to
the purchase or sale of any securities. All trademarks,
service marks and trade names appearing in this report
are the property of their respective owners, and are
likewise used for identification purposes only.
This report is a service available
only to active Paid Premium Members.
You may opt-out of receiving report notifications
at any time. Questions or comments may be submitted
by writing to Premium Membership Services 665 S.E. 10 Street, Suite 201 Deerfield Beach, FL 33441-5634 or by calling 1-800-965-8307
or 954-785-1121.
|
|
|

