Symbol/Exchange
Company Name
Industry Group |
PRICE |
CHANGE
(%Change) |
Day High |
Volume
(% DAV)
(% 50 day avg vol) |
52 Wk Hi
% From Hi |
Featured
Date |
Price
Featured |
Pivot Featured |
|
Max Buy |
ABV
-
NYSE
Comp De Bebidas Adr
FOOD and BEVERAGE - Beverages - Brewers
|
$140.88
|
+1.19
0.85% |
$140.96
|
1,071,506
170.98% of 50 DAV
50 DAV is 626,700
|
$141.97
-0.77%
|
6/29/2010
|
$104.74
|
PP = $109.33
|
|
MB = $114.80
|
 Most Recent Note - 10/22/2010 2:48:11 PM
G - This Brazil-based beverage firm is hovering near its 52-week high after a streak of 15 gains in 16 sessions marked by above average volume. It is very extended from a sound base, and its 50 DMA line ($119.93 now) defines support.
>>> The latest Featured Stock Update with an annotated graph appeared on 10/11/2010. Click here.
View all notes |
Alert me of new notes |
CANSLIM.net Company Profile |
SEC |
Zacks Reports |
StockTalk |
News |
Chart |
Request a new note
C
A N
S L
I M


|
ARUN
-
NASDAQ
Aruba Networks Inc
COMPUTER HARDWARE - Networking andamp; Communication Dev
|
$20.53
|
+1.22
6.32% |
$20.58
|
2,178,762
89.31% of 50 DAV
50 DAV is 2,439,600
|
$22.80
-9.96%
|
8/30/2010
|
$18.12
|
PP = $18.51
|
|
MB = $19.44
|
Most Recent Note - 10/22/2010 2:09:58 PM
G - Considerable gain today without great volume conviction, rallying up from its 50 DMA line after trading below it this week. Slumped near its prior low noted as an important support level to watch along with its short-term average. More damaging losses leading to technical violations would raise concerns.
>>> The latest Featured Stock Update with an annotated graph appeared on 9/2/2010. Click here.
View all notes |
Alert me of new notes |
CANSLIM.net Company Profile |
SEC |
Zacks Reports |
StockTalk |
News |
Chart |
Request a new note
C
A N
S L
I M
|
BIDU
-
NASDAQ
Baidu Inc Ads
INTERNET - Internet Information Providers
|
$107.28
|
+4.80
4.68% |
$109.32
|
31,718,236
306.73% of 50 DAV
50 DAV is 10,340,600
|
$107.19
0.08%
|
9/17/2010
|
$85.73
|
PP = $88.42
|
|
MB = $92.84
|
Most Recent Note - 10/22/2010 12:43:00 PM
G - Gapped up today and hit a new all-time high with another gain backed by above average volume. Gains from its previously identified base were not substantial enough for its 3 very tight weekly closes to be considered an advanced "3-weeks tight" type pattern being cleared now, yet it may go on to produce more climactic gains. The nearest support is prior highs and its 50 DMA line in the $88-90 area.
>>> The latest Featured Stock Update with an annotated graph appeared on 10/7/2010. Click here.
View all notes |
Alert me of new notes |
CANSLIM.net Company Profile |
SEC |
Zacks Reports |
StockTalk |
News |
Chart |
Request a new note
C
A N
S L
I M
|
CACC
-
NASDAQ
Credit Acceptance Corp
FINANCIAL SERVICES - Credit Services
|
$58.15
|
+0.37
0.64% |
$58.15
|
10,280
31.63% of 50 DAV
50 DAV is 32,500
|
$63.45
-8.35%
|
7/29/2010
|
$52.04
|
PP = $54.07
|
|
MB = $56.77
|
Most Recent Note - 10/21/2010 3:04:14 PM
G - Down on light volume today, -10% off its 52-week high. Slumping near prior low closes and its $55.07 on 10/04/10 noted previously as the nearest chart support level to watch above its long ago chart highs ($53.97).
>>> The latest Featured Stock Update with an annotated graph appeared on 9/30/2010. Click here.
View all notes |
Alert me of new notes |
CANSLIM.net Company Profile |
SEC |
Zacks Reports |
StockTalk |
News |
Chart |
Request a new note
C
A N
S L
I M
|
CMG
-
NYSE
Chipotle Mexican Grill
LEISURE - Restaurants
|
$205.77
|
+26.52
14.79% |
$207.85
|
4,100,281
672.62% of 50 DAV
50 DAV is 609,600
|
$184.47
11.55%
|
9/1/2010
|
$158.31
|
PP = $155.52
|
|
MB = $163.30
|
Most Recent Note - 10/22/2010 12:47:23 PM
G - Considerable gap up gain with heavy volume today for a new all-time high following another strong earnings report. Its 50 DMA line defines chart support above its prior highs in the $155 area.
>>> The latest Featured Stock Update with an annotated graph appeared on 9/1/2010. Click here.
View all notes |
Alert me of new notes |
CANSLIM.net Company Profile |
SEC |
Zacks Reports |
StockTalk |
News |
Chart |
Request a new note
C
A N
S L
I M
|
Symbol/Exchange
Company Name
Industry Group |
PRICE |
CHANGE
(%Change) |
Day High |
Volume
(% DAV)
(% 50 day avg vol) |
52 Wk Hi
% From Hi |
Featured
Date |
Price
Featured |
Pivot Featured |
|
Max Buy |
CTRP
-
NASDAQ
Ctrip.Com Intl Ltd Adr
LEISURE - Resorts and Casinos
|
$50.93
|
-0.08
-0.16% |
$51.07
|
1,056,344
60.91% of 50 DAV
50 DAV is 1,734,400
|
$51.38
-0.88%
|
9/24/2010
|
$46.75
|
PP = $47.11
|
|
MB = $49.47
|
Most Recent Note - 10/20/2010 4:47:47 PM
G - Gain today with lighter volume, closing back above its "max buy" level. Prior highs in the $47 area define support to watch above its 50 DMA line.
>>> The latest Featured Stock Update with an annotated graph appeared on 9/28/2010. Click here.
View all notes |
Alert me of new notes |
CANSLIM.net Company Profile |
SEC |
Zacks Reports |
StockTalk |
News |
Chart |
Request a new note
C
A N
S L
I M
|
EBIX
-
NASDAQ
Ebix Inc
COMPUTER SOFTWARE and SERVICES - Business Software and Services
|
$23.40
|
+0.10
0.43% |
$23.50
|
231,027
39.22% of 50 DAV
50 DAV is 589,000
|
$25.61
-8.63%
|
9/23/2010
|
$21.78
|
PP = $22.74
|
|
MB = $23.88
|
Most Recent Note - 10/21/2010 2:23:35 PM
Y - Slumping near recent lows today without heavy volume behind its loss. Consolidating in a healthy manner with volume totals cooling since its negative reversal on 10/06/10. Tight closes in the past 3 weeks (best viewed on its weekly chart) are not considered an advanced "3-weeks tight" type pattern due to its lack of significant progress above the pivot point recently cited. (JOBS was recently noted as a better example of a "3 weeks tight" pattern.)
>>> The latest Featured Stock Update with an annotated graph appeared on 9/24/2010. Click here.
View all notes |
Alert me of new notes |
CANSLIM.net Company Profile |
SEC |
Zacks Reports |
StockTalk |
News |
Chart |
Request a new note
C
A N
S L
I M
|
EGO
-
NYSE
Eldorado Gold Corp
METALS and MINING - Gold
|
$16.78
|
+0.27
1.64% |
$16.83
|
4,020,811
83.12% of 50 DAV
50 DAV is 4,837,500
|
$20.23
-17.05%
|
8/19/2010
|
$18.25
|
PP = $19.17
|
|
MB = $20.13
|
Most Recent Note - 10/21/2010 12:09:03 PM
G - Weak action today has it slumping -18% off its 9/15/10 high. Based on technical deterioration it will be dropped from the Featured Stocks list tonight. It may find support near its 200 DMA, while a subsequent rebound above its 50 DMA would help its outlook.
>>> The latest Featured Stock Update with an annotated graph appeared on 10/12/2010. Click here.
View all notes |
Alert me of new notes |
CANSLIM.net Company Profile |
SEC |
Zacks Reports |
StockTalk |
News |
Chart |
Request a new note
C
A N
S L
I M
|
FFIV
-
NASDAQ
F 5 Networks Inc
INTERNET - Internet Software and Services
|
$98.45
|
+5.63
6.07% |
$98.52
|
3,672,532
168.84% of 50 DAV
50 DAV is 2,175,100
|
$112.05
-12.14%
|
6/16/2010
|
$74.50
|
PP = $74.10
|
|
MB = $77.81
|
Most Recent Note - 10/22/2010 2:11:58 PM
G - Solid gain with above average volume today helped it rebound above its 50 DMA line, a reassuring sign.
>>> The latest Featured Stock Update with an annotated graph appeared on 9/13/2010. Click here.
View all notes |
Alert me of new notes |
CANSLIM.net Company Profile |
SEC |
Zacks Reports |
StockTalk |
News |
Chart |
Request a new note
C
A N
S L
I M
|
FOSL
-
NASDAQ
Fossil Inc
CONSUMER DURABLES - Recreational Goods, Other
|
$56.58
|
+0.95
1.71% |
$56.63
|
529,165
65.92% of 50 DAV
50 DAV is 802,700
|
$55.93
1.16%
|
10/20/2010
|
$54.12
|
PP = $55.61
|
|
MB = $58.39
|
Most Recent Note - 10/21/2010 12:01:29 PM
Y - Volume thus far into the session is not heavy, yet a strong close with great volume conviction could trigger a new (or add-on) buy signal. Its early gain helped it reach a new all-time high, and while it may be considered an advanced "late stage" base and riskier candidate, no overhead supply remains to act as resistance. Color code was changed to yellow with a new pivot point cited while considering it an advanced "3-weeks tight" type set-up pattern. The nearby chart support level to watch is its 50 DMA line.
>>> The latest Featured Stock Update with an annotated graph appeared on 10/5/2010. Click here.
View all notes |
Alert me of new notes |
CANSLIM.net Company Profile |
SEC |
Zacks Reports |
StockTalk |
News |
Chart |
Request a new note
C
A N
S L
I M
|
Symbol/Exchange
Company Name
Industry Group |
PRICE |
CHANGE
(%Change) |
Day High |
Volume
(% DAV)
(% 50 day avg vol) |
52 Wk Hi
% From Hi |
Featured
Date |
Price
Featured |
Pivot Featured |
|
Max Buy |
HMSY
-
NASDAQ
H M S Holdings Corp
COMPUTER SOFTWARE and SERVICES - Healthcare Information Service
|
$60.58
|
+0.24
0.40% |
$60.77
|
95,139
55.31% of 50 DAV
50 DAV is 172,000
|
$62.91
-3.70%
|
9/27/2010
|
$57.97
|
PP = $58.36
|
|
MB = $61.28
|
Most Recent Note - 10/20/2010 5:03:18 PM
Y - Losses with light volume have it pulling back below its "max buy" level and its color code is changed to yellow. Prior highs in the $58 area define support to watch.
>>> The latest Featured Stock Update with an annotated graph appeared on 9/27/2010. Click here.
View all notes |
Alert me of new notes |
CANSLIM.net Company Profile |
SEC |
Zacks Reports |
StockTalk |
News |
Chart |
Request a new note
C
A N
S L
I M
|
HS
-
NYSE
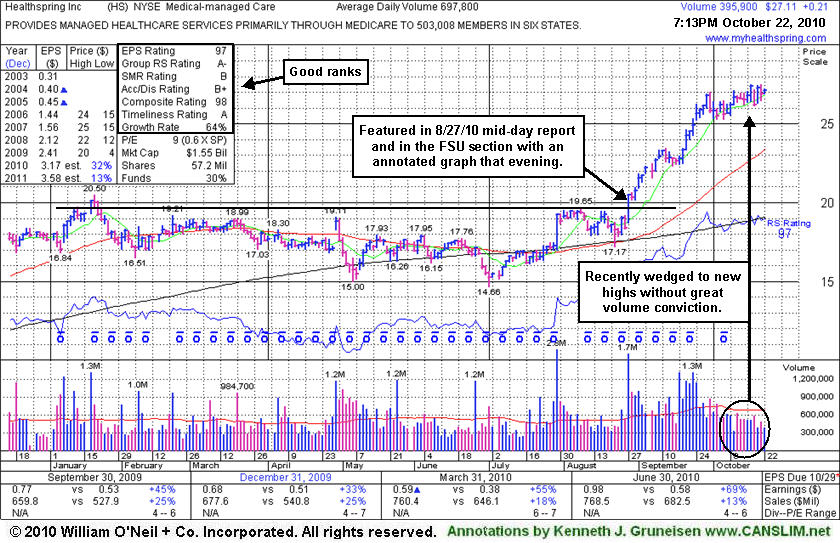
Healthspring Inc
HEALTH SERVICES - Health Care Plans
|
$27.11
|
+0.21
0.78% |
$27.25
|
401,299
57.24% of 50 DAV
50 DAV is 701,100
|
$27.50
-1.42%
|
8/27/2010
|
$19.91
|
PP = $19.75
|
|
MB = $20.74
|
Most Recent Note - 10/22/2010 7:18:40 PM
G - Near all-time highs after 5 consecutive weekly gains. It has not formed a recent sound base. Earnings news is due on Thursday, October 28, 2010. Support to watch is prior chart highs in the $19-20 area.
>>> The latest Featured Stock Update with an annotated graph appeared on 10/22/2010. Click here.
View all notes |
Alert me of new notes |
CANSLIM.net Company Profile |
SEC |
Zacks Reports |
StockTalk |
News |
Chart |
Request a new note
C
A N
S L
I M
|
IGTE
-
NASDAQ
Igate Corp
COMPUTER SOFTWARE and SERVICES - Information Technology Service
|
$18.40
|
+0.36
1.97% |
$18.47
|
248,418
53.27% of 50 DAV
50 DAV is 466,300
|
$19.45
-5.42%
|
9/8/2010
|
$17.29
|
PP = $18.26
|
|
MB = $19.17
|
Most Recent Note - 10/21/2010 2:16:11 PM
Y - Down on heavier volume today, slumping near its 50 DMA line. More damaging losses leading to violation of its 50 DMA line or recent chart low ($16.75 on 10/07/10) would raise concerns and trigger technical sell signals. Confirming gains with heavier volume for a new high close would be a reassuring sign of institutional buying demand.
>>> The latest Featured Stock Update with an annotated graph appeared on 9/10/2010. Click here.
View all notes |
Alert me of new notes |
CANSLIM.net Company Profile |
SEC |
Zacks Reports |
StockTalk |
News |
Chart |
Request a new note
C
A N
S L
I M
|
JOBS
-
NASDAQ
Fifty One Job Inc Ads
DIVERSIFIED SERVICES - Staffing and; Outsourcing Service
|
$43.55
|
+0.65
1.52% |
$44.49
|
54,952
29.83% of 50 DAV
50 DAV is 184,200
|
$46.48
-6.30%
|
10/13/2010
|
$42.07
|
PP = $40.60
|
|
MB = $42.63
|
Most Recent Note - 10/21/2010 2:19:35 PM
G - Loss today without much volume has it slumping under its "max buy" level. Prior highs in the $40 area define support above its 50 DMA line.
>>> The latest Featured Stock Update with an annotated graph appeared on 9/16/2010. Click here.
View all notes |
Alert me of new notes |
CANSLIM.net Company Profile |
SEC |
Zacks Reports |
StockTalk |
News |
Chart |
Request a new note
C
A N
S L
I M
|
LFT
-
NYSE
Longtop Financl Tech Ads
COMPUTER SOFTWARE and SERVICES - Business Software and Services
|
$37.88
|
+0.14
0.37% |
$38.53
|
157,214
32.39% of 50 DAV
50 DAV is 485,400
|
$41.77
-9.31%
|
10/14/2010
|
$39.97
|
PP = $41.87
|
|
MB = $43.96
|
Most Recent Note - 10/21/2010 2:59:18 PM
G - Losses without great volume this week have it slumping toward recent support near its 50 DMA line. Color code is changed to green after failing to make progress following noted signs of distributional pressure. When it returned to the Featured Stocks list on 10/14/10 it had formed a 10-month long flat base and maintained a very strong sales revenues and earnings track record. Previously noted - "Patient and disciplined investors will resist the urge to get in 'early' and wait for a proper buy signal."
>>> The latest Featured Stock Update with an annotated graph appeared on 10/14/2010. Click here.
View all notes |
Alert me of new notes |
CANSLIM.net Company Profile |
SEC |
Zacks Reports |
StockTalk |
News |
Chart |
Request a new note
C
A N
S L
I M
|
Symbol/Exchange
Company Name
Industry Group |
PRICE |
CHANGE
(%Change) |
Day High |
Volume
(% DAV)
(% 50 day avg vol) |
52 Wk Hi
% From Hi |
Featured
Date |
Price
Featured |
Pivot Featured |
|
Max Buy |
LULU
-
NASDAQ
Lululemon Athletica
MANUFACTURING - Textile Manufacturing
|
$44.76
|
+1.67
3.88% |
$44.76
|
1,122,613
97.14% of 50 DAV
50 DAV is 1,155,700
|
$48.45
-7.62%
|
10/8/2010
|
$47.66
|
PP = $46.67
|
|
MB = $49.00
|
Most Recent Note - 10/22/2010 2:38:59 PM
G - Up today with lighter than average volume after enduring distributional pressure this week. Its color code was changed to green while slumping below prior highs in the $45-46 area.
>>> The latest Featured Stock Update with an annotated graph appeared on 10/8/2010. Click here.
View all notes |
Alert me of new notes |
CANSLIM.net Company Profile |
SEC |
Zacks Reports |
StockTalk |
News |
Chart |
Request a new note
C
A N
S L
I M
|
MRX
-
NYSE
Medicis Pharmaceut Cl A
DRUGS - Biotechnology
|
$30.29
|
+0.41
1.37% |
$30.31
|
1,033,311
91.78% of 50 DAV
50 DAV is 1,125,800
|
$30.94
-2.10%
|
8/12/2010
|
$26.88
|
PP = $26.71
|
|
MB = $28.05
|
Most Recent Note - 10/21/2010 2:48:05 PM
G - Slumping on light volume today. Its 50 DMA line and recent chart low in the $29 area define near-term support.
>>> The latest Featured Stock Update with an annotated graph appeared on 10/4/2010. Click here.
View all notes |
Alert me of new notes |
CANSLIM.net Company Profile |
SEC |
Zacks Reports |
StockTalk |
News |
Chart |
Request a new note
C
A N
S L
I M
|
MWIV
-
NASDAQ
M W I Veterinary Supply
HEALTH SERVICES - Medical Instruments and; Supplies
|
$56.60
|
+0.97
1.74% |
$56.80
|
62,739
104.04% of 50 DAV
50 DAV is 60,300
|
$59.50
-4.87%
|
7/29/2010
|
$52.05
|
PP = $52.09
|
|
MB = $54.69
|
Most Recent Note - 10/22/2010 4:21:43 PM
G - Found support near its 50 DMA line with gains on light volume finishing the week following heavier volume distributional losses. A subsequent violation of that classic chart support level and recent lows would raise greater concerns.
>>> The latest Featured Stock Update with an annotated graph appeared on 9/7/2010. Click here.
View all notes |
Alert me of new notes |
CANSLIM.net Company Profile |
SEC |
Zacks Reports |
StockTalk |
News |
Chart |
Request a new note
C
A N
S L
I M
|
NEM
-
NYSE
Newmont Mining Corp
METALS and MINING - Gold
|
$59.37
|
+0.15
0.25% |
$59.46
|
5,845,372
93.22% of 50 DAV
50 DAV is 6,270,800
|
$65.50
-9.36%
|
8/31/2010
|
$61.32
|
PP = $63.48
|
|
MB = $66.65
|
Most Recent Note - 10/21/2010 2:54:28 PM
G - Down today without great volume, -10% off its 52-week high and violating a long-term upward trendline connecting its January-August lows, raising more concerns. This week's violation of its 50 DMA line has come amid weakness in the Mining - Gold/Silver/Gems group (L criteria).
>>> The latest Featured Stock Update with an annotated graph appeared on 9/14/2010. Click here.
View all notes |
Alert me of new notes |
CANSLIM.net Company Profile |
SEC |
Zacks Reports |
StockTalk |
News |
Chart |
Request a new note
C
A N
S L
I M
|
NEOG
-
NASDAQ
Neogen Corp
DRUGS - Diagnostic Substances
|
$34.55
|
+0.19
0.55% |
$34.69
|
34,881
33.54% of 50 DAV
50 DAV is 104,000
|
$36.37
-5.00%
|
9/1/2010
|
$30.79
|
PP = $30.49
|
|
MB = $32.01
|
Most Recent Note - 10/21/2010 2:30:00 PM
G - Down today without heavy volume. While it is extended from a sound base now, its 50 DMA line defines initial support above prior highs in the $30 area.
>>> The latest Featured Stock Update with an annotated graph appeared on 10/13/2010. Click here.
View all notes |
Alert me of new notes |
CANSLIM.net Company Profile |
SEC |
Zacks Reports |
StockTalk |
News |
Chart |
Request a new note
C
A N
S L
I M
|
Symbol/Exchange
Company Name
Industry Group |
PRICE |
CHANGE
(%Change) |
Day High |
Volume
(% DAV)
(% 50 day avg vol) |
52 Wk Hi
% From Hi |
Featured
Date |
Price
Featured |
Pivot Featured |
|
Max Buy |
NFLX
-
NASDAQ
Netflix Inc
SPECIALTY RETAIL - Music and Video Stores
|
$168.10
|
-4.59
-2.66% |
$171.48
|
7,041,740
125.70% of 50 DAV
50 DAV is 5,602,200
|
$174.94
-3.91%
|
8/10/2010
|
$124.05
|
PP = $124.00
|
|
MB = $130.20
|
Most Recent Note - 10/22/2010 12:58:37 PM
G - Holding its ground today after a considerable gap up gain on 10/21/10 following strong earnings news for the quarter ended September 30, 2010. NFLX has not formed a sound base pattern and is trading near prior highs that were marked by an ugly "negative reversal" on 9/30/10.
>>> The latest Featured Stock Update with an annotated graph appeared on 10/1/2010. Click here.
View all notes |
Alert me of new notes |
CANSLIM.net Company Profile |
SEC |
Zacks Reports |
StockTalk |
News |
Chart |
Request a new note
C
A N
S L
I M
|
NTAP
-
NASDAQ
Netapp Inc
COMPUTER HARDWARE - Data Storage Devices
|
$51.97
|
+1.01
1.98% |
$52.42
|
3,763,244
43.07% of 50 DAV
50 DAV is 8,736,500
|
$52.41
-0.84%
|
9/8/2010
|
$46.98
|
PP = $44.99
|
|
MB = $47.24
|
Most Recent Note - 10/22/2010 2:43:40 PM
G - Gain today with light volume, hovering near its 52-week high. Its recent lows near $47 define an initial chart support level to watch above its 50 DMA line.
>>> The latest Featured Stock Update with an annotated graph appeared on 9/8/2010. Click here.
View all notes |
Alert me of new notes |
CANSLIM.net Company Profile |
SEC |
Zacks Reports |
StockTalk |
News |
Chart |
Request a new note
C
A N
S L
I M
|
ORCL
-
NASDAQ
Oracle Corp
COMPUTER SOFTWARE and SERVICES - Application Software
|
$28.99
|
+0.17
0.60% |
$29.01
|
16,495,695
42.04% of 50 DAV
50 DAV is 39,239,700
|
$29.24
-0.84%
|
9/20/2010
|
$27.32
|
PP = $26.73
|
|
MB = $28.07
|
Most Recent Note - 10/20/2010 4:49:16 PM
G -Pulling back with near average volume today after getting extended beyond its "max buy" level with recent volume-driven gains.
>>> The latest Featured Stock Update with an annotated graph appeared on 9/20/2010. Click here.
View all notes |
Alert me of new notes |
CANSLIM.net Company Profile |
SEC |
Zacks Reports |
StockTalk |
News |
Chart |
Request a new note
C
A N
S L
I M
|
PAY
-
NYSE
Verifone Systems Inc
COMPUTER HARDWARE - Transaction Automation Systems
|
$31.39
|
+0.28
0.90% |
$31.67
|
919,782
62.96% of 50 DAV
50 DAV is 1,460,900
|
$31.40
-0.03%
|
8/25/2010
|
$24.30
|
PP = $23.74
|
|
MB = $24.93
|
Most Recent Note - 10/21/2010 5:43:21 PM
G - Gain today with +43% above average volume for its best close of 2010. Volume totals had been cooling in recent weeks while consolidating above support at prior lows and its 50 DMA line.
>>> The latest Featured Stock Update with an annotated graph appeared on 8/30/2010. Click here.
View all notes |
Alert me of new notes |
CANSLIM.net Company Profile |
SEC |
Zacks Reports |
StockTalk |
News |
Chart |
Request a new note
C
A N
S L
I M
|
PRGO
-
NASDAQ
Perrigo Co
DRUGS - Drug Related Products
|
$65.00
|
+0.32
0.49% |
$65.47
|
278,161
30.53% of 50 DAV
50 DAV is 911,100
|
$67.94
-4.33%
|
9/15/2010
|
$63.73
|
PP = $64.76
|
|
MB = $68.00
|
Most Recent Note - 10/20/2010 5:07:55 PM
Y - Small gap up gain today with lighter volume following 5 consecutive small losses with light or near average volume. Consolidating near its pivot point. More damaging losses would raise concerns, meanwhile its 50 DMA line defines important chart support.
>>> The latest Featured Stock Update with an annotated graph appeared on 9/15/2010. Click here.
View all notes |
Alert me of new notes |
CANSLIM.net Company Profile |
SEC |
Zacks Reports |
StockTalk |
News |
Chart |
Request a new note
C
A N
S L
I M
|
Symbol/Exchange
Company Name
Industry Group |
PRICE |
CHANGE
(%Change) |
Day High |
Volume
(% DAV)
(% 50 day avg vol) |
52 Wk Hi
% From Hi |
Featured
Date |
Price
Featured |
Pivot Featured |
|
Max Buy |
RAX
-
NYSE
Rackspace Hosting Inc
INTERNET - Internet Software and; Services
|
$22.86
|
+0.05
0.22% |
$23.07
|
1,917,158
78.16% of 50 DAV
50 DAV is 2,452,900
|
$26.50
-13.74%
|
9/21/2010
|
$22.84
|
PP = $23.61
|
|
MB = $24.79
|
Most Recent Note - 10/21/2010 2:26:23 PM
Y - Slumping again today without heavy volume, its latest chart low and its 50 DMA line coincide near $22 defining an important support level. More damaging losses would raise serious concerns.
>>> The latest Featured Stock Update with an annotated graph appeared on 9/21/2010. Click here.
View all notes |
Alert me of new notes |
CANSLIM.net Company Profile |
SEC |
Zacks Reports |
StockTalk |
News |
Chart |
Request a new note
C
A N
S L
I M
|
ROVI
-
NASDAQ
Rovi Corp
COMPUTER SOFTWARE andamp; SERVICES - Security Software andamp; Services
|
$50.47
|
+1.56
3.19% |
$50.63
|
977,170
65.54% of 50 DAV
50 DAV is 1,491,000
|
$53.00
-4.77%
|
8/31/2010
|
$43.31
|
PP = $45.06
|
|
MB = $47.31
|
Most Recent Note - 10/22/2010 2:18:49 PM
G - Gain today without great volume conviction has it poised for its best close in weeks. Support to watch is defined by recent lows in the $47.50 area while it is consolidating in a healthy fashion above prior highs and its 50 DMA line.
>>> The latest Featured Stock Update with an annotated graph appeared on 10/20/2010. Click here.
View all notes |
Alert me of new notes |
CANSLIM.net Company Profile |
SEC |
Zacks Reports |
StockTalk |
News |
Chart |
Request a new note
C
A N
S L
I M
|
SHOO
-
NASDAQ
Steven Madden Limited
CONSUMER NON-DURABLES - Textile - Apparel Footwear
|
$41.78
|
+0.23
0.55% |
$41.84
|
136,786
40.30% of 50 DAV
50 DAV is 339,400
|
$44.85
-6.85%
|
9/15/2010
|
$38.94
|
PP = $40.27
|
|
MB = $42.28
|
Most Recent Note - 10/21/2010 2:50:21 PM
Y - Recently, mild distributional pressure has it pulling back toward prior highs in the $40 area that define important chart support. More damaging losses would raise concerns.
>>> The latest Featured Stock Update with an annotated graph appeared on 9/29/2010. Click here.
View all notes |
Alert me of new notes |
CANSLIM.net Company Profile |
SEC |
Zacks Reports |
StockTalk |
News |
Chart |
Request a new note
C
A N
S L
I M
|
SLW
-
NYSE
Silver Wheaton Corp
METALS and; MINING - Silver
|
$26.22
|
+0.48
1.86% |
$26.24
|
4,456,009
70.30% of 50 DAV
50 DAV is 6,338,300
|
$28.39
-7.64%
|
8/25/2010
|
$21.40
|
PP = $21.99
|
|
MB = $23.09
|
Most Recent Note - 10/21/2010 2:21:53 PM
G - Down today without heavy volume conviction, but widespread losses in the Mining - Gold/Silver/Gems group have been weighing on it recently. It is -10% off its 52 week high, and its 50 DMA line defines chart support to watch.
>>> The latest Featured Stock Update with an annotated graph appeared on 10/18/2010. Click here.
View all notes |
Alert me of new notes |
CANSLIM.net Company Profile |
SEC |
Zacks Reports |
StockTalk |
News |
Chart |
Request a new note
C
A N
S L
I M
|
SVR
-
NYSE
Syniverse Holdings Inc
TELECOMMUNICATIONS - Diversified Communication Serv
|
$23.62
|
+0.20
0.85% |
$23.67
|
241,596
34.35% of 50 DAV
50 DAV is 703,300
|
$24.24
-2.56%
|
9/22/2010
|
$23.60
|
PP = $23.87
|
|
MB = $25.06
|
Most Recent Note - 10/21/2010 2:27:49 PM
Y - Pulling back today with light volume, still perched within close striking distance of its 52-week high. It found prompt support near its 50 DMA line after a recent bout of distribution. Confirming gains for a new high close with heavy volume would be a bullish sign, meanwhile the recent chart low ($21.47) defines important support to watch.
>>> The latest Featured Stock Update with an annotated graph appeared on 9/22/2010. Click here.
View all notes |
Alert me of new notes |
CANSLIM.net Company Profile |
SEC |
Zacks Reports |
StockTalk |
News |
Chart |
Request a new note
C
A N
S L
I M
|
Symbol/Exchange
Company Name
Industry Group |
PRICE |
CHANGE
(%Change) |
Day High |
Volume
(% DAV)
(% 50 day avg vol) |
52 Wk Hi
% From Hi |
Featured
Date |
Price
Featured |
Pivot Featured |
|
Max Buy |
UA
-
NYSE
Under Armour Inc Cl A
CONSUMER NON-DURABLES - Textile - Apparel Clothing
|
$47.07
|
+1.66
3.66% |
$47.16
|
621,679
84.91% of 50 DAV
50 DAV is 732,200
|
$48.00
-1.94%
|
9/9/2010
|
$39.99
|
PP = $40.10
|
|
MB = $42.11
|
Most Recent Note - 10/22/2010 2:15:55 PM
G - Gapped up today, rising without great volume conviction to within striking distance of a new high close. It has not formed a sound base after a prior streak of gains, so patient and disciplined investors will watch for secondary buy points to develop. Due to report earnings on Oct 26th.
>>> The latest Featured Stock Update with an annotated graph appeared on 9/9/2010. Click here.
View all notes |
Alert me of new notes |
CANSLIM.net Company Profile |
SEC |
Zacks Reports |
StockTalk |
News |
Chart |
Request a new note
C
A N
S L
I M
|
UFPT
-
NASDAQ
U F P Tech Inc
CONSUMER NON-DURABLES - Packaging and Containers
|
$12.40
|
-0.14
-1.12% |
$12.68
|
19,406
31.87% of 50 DAV
50 DAV is 60,900
|
$13.32
-6.91%
|
9/16/2010
|
$11.20
|
PP = $11.69
|
|
MB = $12.27
|
Most Recent Note - 10/22/2010 4:11:22 PM
G - Quietly consolidating, it stalled and has not made meaningful progress since its early-October breakout. Prior highs and its 50 DMA line in the $11 area define chart support to watch.
>>> The latest Featured Stock Update with an annotated graph appeared on 9/17/2010. Click here.
View all notes |
Alert me of new notes |
CANSLIM.net Company Profile |
SEC |
Zacks Reports |
StockTalk |
News |
Chart |
Request a new note
C
A N
S L
I M
|
ULTA
-
NASDAQ
Ulta Salon Cosm & Frag
SPECIALTY RETAIL - Specialty Retail, Other
|
$31.07
|
+0.18
0.58% |
$31.22
|
236,588
35.44% of 50 DAV
50 DAV is 667,500
|
$31.73
-2.08%
|
9/3/2010
|
$26.36
|
PP = $25.89
|
|
MB = $27.18
|
Most Recent Note - 10/19/2010 4:42:29 PM
G - Quietly pulling back today from a 52-week high it hit on the prior session. Prior highs and its 50 DMA line coincide in the $26 area defining support to watch. No overhead supply remains to act as resistance.
>>> The latest Featured Stock Update with an annotated graph appeared on 9/3/2010. Click here.
View all notes |
Alert me of new notes |
CANSLIM.net Company Profile |
SEC |
Zacks Reports |
StockTalk |
News |
Chart |
Request a new note
C
A N
S L
I M
|
VIT
-
NYSE
Vanceinfo Tech Inc Ads
COMPUTER SOFTWARE and SERVICES - Business Software and Services
|
$34.93
|
+1.09
3.22% |
$34.99
|
262,261
39.04% of 50 DAV
50 DAV is 671,700
|
$34.95
-0.06%
|
7/8/2010
|
$25.20
|
PP = $26.58
|
|
MB = $27.91
|
Most Recent Note - 10/22/2010 2:41:55 PM
G - Quietly touching new highs this week. Volume totals have cooled while recently consolidating near all-time highs, which suggests that few investors are anxious to head for the exits. It has not formed a recent sound base pattern but patient investors may watch for it to eventually offer an ideal add-on buy point. Meanwhile, its 50 DMA line and recent low ($30.55 on 10/08/10) define important chart support to watch.
>>> The latest Featured Stock Update with an annotated graph appeared on 10/21/2010. Click here.
View all notes |
Alert me of new notes |
CANSLIM.net Company Profile |
SEC |
Zacks Reports |
StockTalk |
News |
Chart |
Request a new note
C
A N
S L
I M
|
WCRX
-
NASDAQ
Warner Chilcott Plc
DRUGS - Drug Manufacturers - Other
|
$23.70
|
-0.21
-0.88% |
$24.85
|
3,725,962
130.56% of 50 DAV
50 DAV is 2,853,800
|
$25.32
-6.40%
|
8/23/2010
|
$21.04
|
PP = $20.84
|
|
MB = $21.88
|
Most Recent Note - 10/22/2010 4:16:48 PM
G - Volume was above average today with a worrisome "negative reversal" after a gap up, as it finished near the session low with a loss. Prior chart highs near $23.50 define near-term support above its 50 DMA line.
>>> The latest Featured Stock Update with an annotated graph appeared on 10/15/2010. Click here.
View all notes |
Alert me of new notes |
CANSLIM.net Company Profile |
SEC |
Zacks Reports |
StockTalk |
News |
Chart |
Request a new note
C
A N
S L
I M
|
Symbol/Exchange
Company Name
Industry Group |
PRICE |
CHANGE
(%Change) |
Day High |
Volume
(% DAV)
(% 50 day avg vol) |
52 Wk Hi
% From Hi |
Featured
Date |
Price
Featured |
Pivot Featured |
|
Max Buy |