Symbol/Exchange
Company Name
Industry Group |
PRICE |
CHANGE
(%Change) |
Day High |
Volume
(% DAV)
(% 50 day avg vol) |
52 Wk Hi
% From Hi |
Featured
Date |
Price
Featured |
Pivot Featured |
|
Max Buy |
ALGN
-
NASDAQ
Align Technology Inc
HEALTH SERVICES - Medical Appliances and Equipment
|
$27.68
|
-0.50
-1.77% |
$28.97
|
5,212,384
380.11% of 50 DAV
50 DAV is 1,371,300
|
$39.82
-30.49%
|
10/17/2012
|
$37.31
|
PP = $39.92
|
|
MB = $41.92
|
 Most Recent Note - 10/19/2012 4:34:01 PM
Failed to rebound and edged lower with above average volume today. Based on fundamental and technical concerns it will be dropped from the Featured Stocks list tonight. Gapped down on 10/18/12 for a considerable loss after reporting earnings +4% on +8% sales for the Sep '12 quarter, well below the +25% minimum earnings guideline, and its color code was changed to green. This Medical - Supplies firm built an orderly base above its 50 DMA line and above prior highs in the $36 area, however it slumped under its 50 DMA line since highlighted in yellow with pivot point cited based on its 9/13/12 high plus 10 cents in the 10/17/12 mid-day report (read here) while noted - "Disciplined investors may watch for volume-driven gains above its pivot point which are needed to trigger a new technical buy signal. Last noted in the 7/27/12 mid-day report - 'Earnings rose +70% on +21% sales revenues for the quarter ended June 30, 2012 versus the year ago period, marking a 3rd consecutive quarterly earnings increase above the +25% minimum guideline (C criteria). Its annual earnings (A criteria) history has been good following a downturn in FY '08. Patient and disciplined investors may watch for a proper base to form while it continues consolidating.'" See the latest FSU analysis for more details an a new annotated graph.
>>> The latest Featured Stock Update with an annotated graph appeared on 10/17/2012. Click here.
View all notes |
Alert me of new notes |
CANSLIM.net Company Profile |
SEC |
Zacks Reports |
StockTalk |
News |
Chart |
Request a new note
C
A N
S L
I M


|
ALXN
-
NASDAQ
Alexion Pharmaceuticals
DRUGS - Drug Manufacturers - Other
|
$107.62
|
-6.05
-5.32% |
$113.95
|
2,000,076
220.22% of 50 DAV
50 DAV is 908,200
|
$119.54
-9.97%
|
8/23/2012
|
$103.70
|
PP = $110.06
|
|
MB = $115.56
|
Most Recent Note - 10/19/2012 4:36:17 PM
G - Finished near the session low today after slumping under its 50 DMA line and under prior lows with a damaging loss on above average volume amid widespread market weakness (M criteria). It also undercut prior highs in the $109-110 area, slumping back into its prior base. Color code was changed to green
>>> The latest Featured Stock Update with an annotated graph appeared on 9/26/2012. Click here.
View all notes |
Alert me of new notes |
CANSLIM.net Company Profile |
SEC |
Zacks Reports |
StockTalk |
News |
Chart |
Request a new note
C
A N
S L
I M
|
ASPS
-
NASDAQ
Altisource Ptf Sltns Sa
REAL ESTATE - Property Management/Developmen
|
$111.92
|
+0.08
0.07% |
$114.51
|
192,380
112.31% of 50 DAV
50 DAV is 171,300
|
$118.48
-5.54%
|
9/24/2012
|
$87.24
|
PP = $92.39
|
|
MB = $97.01
|
Most Recent Note - 10/18/2012 4:00:07 PM
G - Pulling back today on near average volume for 2nd consecutive loss while retreating from its all-time high. Very extended from its prior base, its prior highs in the $92 area define initial support to watch on pullbacks.
>>> The latest Featured Stock Update with an annotated graph appeared on 10/12/2012. Click here.
View all notes |
Alert me of new notes |
CANSLIM.net Company Profile |
SEC |
Zacks Reports |
StockTalk |
News |
Chart |
Request a new note
C
A N
S L
I M
|
BRLI
-
NASDAQ
Bio Reference Labs Inc
HEALTH SERVICES - Medical Laboratories and Researc
|
$31.07
|
-1.05
-3.27% |
$32.28
|
457,058
152.05% of 50 DAV
50 DAV is 300,600
|
$32.86
-5.45%
|
10/3/2012
|
$30.90
|
PP = $30.25
|
|
MB = $31.76
|
Most Recent Note - 10/19/2012 4:25:07 PM
G - Loss today with above average volume, retreating near prior highs in the $30 area defining initial chart support above its 50 DMA line.
>>> The latest Featured Stock Update with an annotated graph appeared on 10/8/2012. Click here.
View all notes |
Alert me of new notes |
CANSLIM.net Company Profile |
SEC |
Zacks Reports |
StockTalk |
News |
Chart |
Request a new note
C
A N
S L
I M
|
CFNL
-
NASDAQ
Cardinal Financial Corp
BANKING - Regional - Southeast Banks
|
$13.68
|
+0.09
0.66% |
$13.81
|
113,898
135.27% of 50 DAV
50 DAV is 84,200
|
$14.79
-7.51%
|
8/17/2012
|
$12.84
|
PP = $13.31
|
|
MB = $13.98
|
Most Recent Note - 10/19/2012 4:27:53 PM
G - Managed a positive reversal today after overcoming early weakness, fighting back to a close just above its 50 DMA line ($13.65 now). Subsequent deterioration below that short-term average would raise more serious concerns.
>>> The latest Featured Stock Update with an annotated graph appeared on 9/25/2012. Click here.
View all notes |
Alert me of new notes |
CANSLIM.net Company Profile |
SEC |
Zacks Reports |
StockTalk |
News |
Chart |
Request a new note
C
A N
S L
I M
|
Symbol/Exchange
Company Name
Industry Group |
PRICE |
CHANGE
(%Change) |
Day High |
Volume
(% DAV)
(% 50 day avg vol) |
52 Wk Hi
% From Hi |
Featured
Date |
Price
Featured |
Pivot Featured |
|
Max Buy |
CMCSA
-
NASDAQ
Comcast Corp Cl A
MEDIA - CATV Systems
|
$36.95
|
-0.34
-0.91% |
$37.50
|
14,775,615
127.04% of 50 DAV
50 DAV is 11,631,000
|
$37.60
-1.73%
|
6/11/2012
|
$29.94
|
PP = $30.98
|
|
MB = $32.53
|
Most Recent Note - 10/19/2012 12:28:36 PM
G - Pulling back today after a streak of 5 consecutive gains to new 52-week high territory. Found support while consolidating above prior highs in the $35 area and its 50 DMA line. Violations would trigger technical sell signals. Fundamental concerns have been repeatedly noted - "Due to sub par sales and earnings growth in the Jun '12 quarter."
>>> The latest Featured Stock Update with an annotated graph appeared on 9/21/2012. Click here.
View all notes |
Alert me of new notes |
CANSLIM.net Company Profile |
SEC |
Zacks Reports |
StockTalk |
News |
Chart |
Request a new note
C
A N
S L
I M
|
DVA
-
NYSE
Davita Inc
HEALTH SERVICES - Specialized Health Services
|
$110.72
|
-2.35
-2.08% |
$113.18
|
1,128,823
149.22% of 50 DAV
50 DAV is 756,500
|
$113.48
-2.43%
|
9/5/2012
|
$102.92
|
PP = $100.62
|
|
MB = $105.65
|
Most Recent Note - 10/18/2012 10:22:20 AM
G - Hitting another new 52-week high today, getting more extended from its latest sound base. Prior highs near $100 and its 50 DMA line define near-term support to watch on pullbacks where violations may trigger technical sell signals.
>>> The latest Featured Stock Update with an annotated graph appeared on 10/10/2012. Click here.
View all notes |
Alert me of new notes |
CANSLIM.net Company Profile |
SEC |
Zacks Reports |
StockTalk |
News |
Chart |
Request a new note
C
A N
S L
I M
|
GPX
-
NYSE
G P Strategies Corp
DIVERSIFIED SERVICES - Education and Training Services
|
$18.78
|
-0.18
-0.95% |
$18.97
|
47,746
75.67% of 50 DAV
50 DAV is 63,100
|
$20.67
-9.14%
|
10/8/2012
|
$20.00
|
PP = $20.77
|
|
MB = $21.81
|
Most Recent Note - 10/18/2012 4:39:01 PM
G - Slumped below its 50 DMA line today on light volume and finished at the session low and near recent lows. Losses exceeding its recent low ($18.82 on 10/04/12) would raise more serious concerns and trigger technical sell signals. Volume driven gains above the pivot point have not triggered a new (or add-on) technical buy signal.
>>> The latest Featured Stock Update with an annotated graph appeared on 10/16/2012. Click here.
View all notes |
Alert me of new notes |
CANSLIM.net Company Profile |
SEC |
Zacks Reports |
StockTalk |
News |
Chart |
Request a new note
C
A N
S L
I M
|
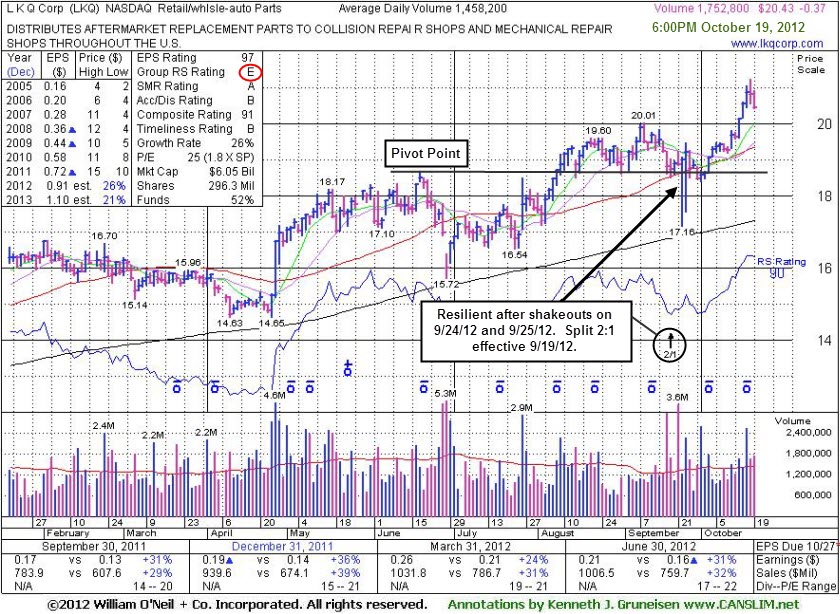
LKQ
-
NASDAQ
L K Q Corp
WHOLESALE - Auto Parts
|
$20.43
|
-0.37
-1.77% |
$20.90
|
1,753,995
120.28% of 50 DAV
50 DAV is 1,458,200
|
$21.22
-3.69%
|
8/9/2012
|
$18.97
|
PP = $18.72
|
|
MB = $19.66
|
Most Recent Note - 10/19/2012 6:22:23 PM
G - Perched near its all-time high today. Recently rallied well above its "max buy" level with no resistance remaining due to overhead supply. See latest FSU analysis for more details and a new annotated graph.
>>> The latest Featured Stock Update with an annotated graph appeared on 10/19/2012. Click here.
View all notes |
Alert me of new notes |
CANSLIM.net Company Profile |
SEC |
Zacks Reports |
StockTalk |
News |
Chart |
Request a new note
C
A N
S L
I M
|
LNKD
-
NYSE
Linkedin Corp Class A
INTERNET - Internet Information Providers
|
$106.72
|
-2.15
-1.97% |
$109.64
|
1,852,480
91.04% of 50 DAV
50 DAV is 2,034,800
|
$125.50
-14.96%
|
9/5/2012
|
$113.25
|
PP = $113.10
|
|
MB = $118.76
|
Most Recent Note - 10/19/2012 4:47:29 PM
Tallied its 5th consecutive weekly loss and finished -15% off its 52-week high. Based on weak action it will be dropped from the Featured Stocks list tonight. A rebound above its 50 DMA line is needed to help its technical stance and help its outlook improve.
>>> The latest Featured Stock Update with an annotated graph appeared on 10/9/2012. Click here.
View all notes |
Alert me of new notes |
CANSLIM.net Company Profile |
SEC |
Zacks Reports |
StockTalk |
News |
Chart |
Request a new note
C
A N
S L
I M
|
Symbol/Exchange
Company Name
Industry Group |
PRICE |
CHANGE
(%Change) |
Day High |
Volume
(% DAV)
(% 50 day avg vol) |
52 Wk Hi
% From Hi |
Featured
Date |
Price
Featured |
Pivot Featured |
|
Max Buy |
LULU
-
NASDAQ
Lululemon Athletica
MANUFACTURING - Textile Manufacturing
|
$69.03
|
-5.62
-7.52% |
$73.44
|
5,628,919
243.90% of 50 DAV
50 DAV is 2,307,900
|
$81.09
-14.87%
|
10/2/2012
|
$74.89
|
PP = $78.97
|
|
MB = $82.92
|
Most Recent Note - 10/19/2012 4:23:02 PM
G - Violated its 50 DMA line with a damaging loss on heavy volume and its color code is changed to green. Only a prompt rebound above that important short-term average would help its outlook improve.
>>> The latest Featured Stock Update with an annotated graph appeared on 10/2/2012. Click here.
View all notes |
Alert me of new notes |
CANSLIM.net Company Profile |
SEC |
Zacks Reports |
StockTalk |
News |
Chart |
Request a new note
C
A N
S L
I M
|
MIDD
-
NASDAQ
Middleby Corp
MANUFACTURING - Diversified Machinery
|
$122.80
|
-0.95
-0.77% |
$123.87
|
84,455
84.29% of 50 DAV
50 DAV is 100,200
|
$123.95
-0.93%
|
10/8/2012
|
$118.46
|
PP = $122.67
|
|
MB = $128.80
|
Most Recent Note - 10/16/2012 3:46:22 PM
Y - Poised for a best-ever close with a quiet gain today and trading just -1.3% off its 52-week high. Volume totals have been below average in recent weeks while stubbornly holding its ground. Subsequent volume-driven gains above the pivot point may trigger a new (or add-on) technical buy signal. Its 50 DMA line and recent lows define near-term chart support to watch.
>>> The latest Featured Stock Update with an annotated graph appeared on 9/18/2012. Click here.
View all notes |
Alert me of new notes |
CANSLIM.net Company Profile |
SEC |
Zacks Reports |
StockTalk |
News |
Chart |
Request a new note
C
A N
S L
I M
|
N
-
NYSE
Netsuite Inc
DIVERSIFIED SERVICES - Business/Management Services
|
$59.87
|
-1.58
-2.57% |
$61.39
|
494,139
110.52% of 50 DAV
50 DAV is 447,100
|
$64.70
-7.47%
|
8/20/2012
|
$55.88
|
PP = $59.32
|
|
MB = $62.29
|
Most Recent Note - 10/19/2012 4:38:20 PM
Y - Slumped today on near-average volume, trading near prior highs in the $59 area closely coinciding with its 50 DMA line defining important chart support. Subsequent violations would trigger technical sell signals.
>>> The latest Featured Stock Update with an annotated graph appeared on 9/24/2012. Click here.
View all notes |
Alert me of new notes |
CANSLIM.net Company Profile |
SEC |
Zacks Reports |
StockTalk |
News |
Chart |
Request a new note
C
A N
S L
I M
|
NSM
-
NYSE
Nationstar Mtg Hldgs Inc
FINANCIAL SERVICES - Credit Services
|
$32.58
|
-1.12
-3.32% |
$33.66
|
610,115
50.51% of 50 DAV
50 DAV is 1,208,000
|
$37.20
-12.42%
|
8/29/2012
|
$27.96
|
PP = $28.85
|
|
MB = $30.29
|
Most Recent Note - 10/19/2012 4:30:44 PM
G - Down today with below average volume. Slumping near a previously noted steep upward trendline connecting July-September lows which defines a near-term support level to watch above its 50 DMA line.
>>> The latest Featured Stock Update with an annotated graph appeared on 10/11/2012. Click here.
View all notes |
Alert me of new notes |
CANSLIM.net Company Profile |
SEC |
Zacks Reports |
StockTalk |
News |
Chart |
Request a new note
C
A N
S L
I M
|
OSIS
-
NASDAQ
O S I Systems Inc
ELECTRONICS - Semiconductor Equipment and Mate
|
$75.62
|
-2.67
-3.41% |
$77.58
|
139,033
105.01% of 50 DAV
50 DAV is 132,400
|
$79.90
-5.36%
|
9/5/2012
|
$74.39
|
PP = $75.10
|
|
MB = $78.86
|
Most Recent Note - 10/19/2012 4:32:02 PM
Y - Gapped down today for a loss with near average volume, slumping near its 50 DMA line. Touched a new 52-week high on the prior session then reversed into the red for a quiet loss. See the latest FSU analysis for more details and a new annotated graph.
>>> The latest Featured Stock Update with an annotated graph appeared on 10/18/2012. Click here.
View all notes |
Alert me of new notes |
CANSLIM.net Company Profile |
SEC |
Zacks Reports |
StockTalk |
News |
Chart |
Request a new note
C
A N
S L
I M
|
Symbol/Exchange
Company Name
Industry Group |
PRICE |
CHANGE
(%Change) |
Day High |
Volume
(% DAV)
(% 50 day avg vol) |
52 Wk Hi
% From Hi |
Featured
Date |
Price
Featured |
Pivot Featured |
|
Max Buy |
RNF
-
NYSE
Rentech Nitrogen Ptnr Lp
CHEMICALS - Agricultural Chemicals
|
$36.40
|
-0.86
-2.31% |
$37.28
|
256,473
63.30% of 50 DAV
50 DAV is 405,200
|
$40.05
-9.11%
|
7/27/2012
|
$29.58
|
PP = $30.60
|
|
MB = $32.13
|
Most Recent Note - 10/16/2012 12:58:19 PM
G - Considerable gain today, rallying from its 50 DMA line defining important near-term support after the previously noted upward trendline violation. Gains have lacked volume conviction after it halted its slide.
>>> The latest Featured Stock Update with an annotated graph appeared on 10/4/2012. Click here.
View all notes |
Alert me of new notes |
CANSLIM.net Company Profile |
SEC |
Zacks Reports |
StockTalk |
News |
Chart |
Request a new note
C
A N
S L
I M
|
SWI
-
NYSE
Solarwinds Inc
COMPUTER SOFTWARE and SERVICES - Application Software
|
$50.00
|
-0.46
-0.91% |
$50.75
|
592,075
73.71% of 50 DAV
50 DAV is 803,300
|
$60.95
-17.97%
|
7/25/2012
|
$47.82
|
PP = $47.89
|
|
MB = $50.28
|
Most Recent Note - 10/19/2012 4:42:35 PM
Slumped further below its 50 DMA line today, failing to rebound after damaging distributional losses. based on weak action it will be dropped from the Featured Stocks list tonight. Due to report earnings on Thursday, October 25th. Prior highs in the $48 area define the next chart support level.
>>> The latest Featured Stock Update with an annotated graph appeared on 10/3/2012. Click here.
View all notes |
Alert me of new notes |
CANSLIM.net Company Profile |
SEC |
Zacks Reports |
StockTalk |
News |
Chart |
Request a new note
C
A N
S L
I M
|
TDG
-
NYSE
Transdigm Group Inc
AEROSPACE/DEFENSE - Aerospace/Defense Products and; Services
|
$145.70
|
-3.05
-2.05% |
$147.50
|
597,383
139.09% of 50 DAV
50 DAV is 429,500
|
$152.62
-4.53%
|
8/16/2012
|
$132.23
|
PP = $136.44
|
|
MB = $143.26
|
Most Recent Note - 10/19/2012 4:44:04 PM
G - Traded above average volume behind a 3rd consecutive loss today. Its 50 DMA line defines near-term support to watch above recent lows in the $138 area where violations may trigger technical sell signals.
>>> The latest Featured Stock Update with an annotated graph appeared on 9/20/2012. Click here.
View all notes |
Alert me of new notes |
CANSLIM.net Company Profile |
SEC |
Zacks Reports |
StockTalk |
News |
Chart |
Request a new note
C
A N
S L
I M
|
ULTA
-
NASDAQ
Ulta Salon Cosm & Frag
SPECIALTY RETAIL - Specialty Retail, Other
|
$94.78
|
-0.77
-0.81% |
$96.06
|
761,519
96.93% of 50 DAV
50 DAV is 785,600
|
$103.52
-8.44%
|
9/4/2012
|
$93.17
|
PP = $98.52
|
|
MB = $103.45
|
Most Recent Note - 10/18/2012 1:13:56 PM
G - Color code is changed to green while encountering distributional pressure and sputtering near its 50 DMA line. Its Relative Strength Rating has slumped to 77, below the 80+ minimum rank for ideal buy candidates under the fact-based investment system. The latest FSU analysis discussed its waning Relative Strength under the headline "Relative Strength Line Did Not Provide Confirmation - Friday, October 05, 2012".
>>> The latest Featured Stock Update with an annotated graph appeared on 10/5/2012. Click here.
View all notes |
Alert me of new notes |
CANSLIM.net Company Profile |
SEC |
Zacks Reports |
StockTalk |
News |
Chart |
Request a new note
C
A N
S L
I M
|
ULTI
-
NASDAQ
Ultimate Software Group
INTERNET - Internet Software and Services
|
$96.41
|
-2.99
-3.01% |
$99.41
|
158,039
110.83% of 50 DAV
50 DAV is 142,600
|
$106.40
-9.39%
|
8/27/2012
|
$98.36
|
PP = $99.19
|
|
MB = $104.15
|
Most Recent Note - 10/19/2012 4:40:11 PM
G - Slumped under its 50 DMA line today with its 5th consecutive loss and its color code is changed to green. Finished near recent lows in the $96 area defining near-term support to watch where violations would raise concerns and trigger technical sell signals.
>>> The latest Featured Stock Update with an annotated graph appeared on 9/27/2012. Click here.
View all notes |
Alert me of new notes |
CANSLIM.net Company Profile |
SEC |
Zacks Reports |
StockTalk |
News |
Chart |
Request a new note
C
A N
S L
I M
|
Symbol/Exchange
Company Name
Industry Group |
PRICE |
CHANGE
(%Change) |
Day High |
Volume
(% DAV)
(% 50 day avg vol) |
52 Wk Hi
% From Hi |
Featured
Date |
Price
Featured |
Pivot Featured |
|
Max Buy |
VSI
-
NYSE
Vitamin Shoppe Inc
SPECIALTY RETAIL - Specialty Retail, Other
|
$57.53
|
-0.23
-0.40% |
$58.22
|
163,748
52.69% of 50 DAV
50 DAV is 310,800
|
$61.83
-6.95%
|
10/15/2012
|
$57.82
|
PP = $60.08
|
|
MB = $63.08
|
Most Recent Note - 10/19/2012 4:48:44 PM
Y - Volume totals have been below average in recent weeks while consolidating near its 50 DMA line. Color code was changed to yellow while still building on a new base, and subsequent volume-driven gains are needed to trigger a new technical buy signal.
>>> The latest Featured Stock Update with an annotated graph appeared on 10/15/2012. Click here.
View all notes |
Alert me of new notes |
CANSLIM.net Company Profile |
SEC |
Zacks Reports |
StockTalk |
News |
Chart |
Request a new note
C
A N
S L
I M
|
WPI
-
NYSE
Watson Pharmaceuticals
DRUGS - Drugs - Generic
|
$86.91
|
-0.92
-1.05% |
$88.14
|
812,663
89.39% of 50 DAV
50 DAV is 909,100
|
$89.90
-3.33%
|
8/24/2012
|
$82.90
|
PP = $81.10
|
|
MB = $85.16
|
Most Recent Note - 10/16/2012 1:00:49 PM
G - Hitting new 52-week highs today with a big gain on below average volume. It is getting more extended from its prior base, and its 50 DMA line defines important support to watch on pullbacks.
>>> The latest Featured Stock Update with an annotated graph appeared on 9/28/2012. Click here.
View all notes |
Alert me of new notes |
CANSLIM.net Company Profile |
SEC |
Zacks Reports |
StockTalk |
News |
Chart |
Request a new note
C
A N
S L
I M
|