***Last / Change / Volume data in this table is the closing quote data***
Symbol/Exchange
Company Name
Industry Group |
PRICE |
CHANGE
(%Change) |
Day High |
Volume
(% DAV)
(% 50 day avg vol) |
52 Wk Hi
% From Hi |
Featured
Date |
Price
Featured |
Pivot Featured |
|
Max Buy |
ABV
-
NYSE
Comp De Bebidas Adr
FOOD and BEVERAGE - Beverages - Brewers
|
$137.63
|
-3.24
-2.30% |
$139.75
|
855,059
139.06% of 50 DAV
50 DAV is 614,900
|
$141.97
-3.06%
|
6/29/2010
|
$104.74
|
PP = $109.33
|
|
MB = $114.80
|
 Most Recent Note - 10/19/2010 4:34:32 PM
G - This Brazil-based beverage firm's loss today broke a streak of 12 consecutive gains for new 52-week highs. It is very extended from a sound base, and its 50 DMA line ($117.73 now) defines support.
>>> The latest Featured Stock Update with an annotated graph appeared on 10/11/2010. Click here.
View all notes |
Alert me of new notes |
CANSLIM.net Company Profile |
SEC |
Zacks Reports |
StockTalk |
News |
Chart |
Request a new note
C
A N
S L
I M


|
ARUN
-
NASDAQ
Aruba Networks Inc
COMPUTER HARDWARE - Networking andamp; Communication Dev
|
$19.22
|
-0.87
-4.33% |
$19.84
|
2,734,371
113.86% of 50 DAV
50 DAV is 2,401,600
|
$22.80
-15.70%
|
8/30/2010
|
$18.12
|
PP = $18.51
|
|
MB = $19.44
|
Most Recent Note - 10/19/2010 10:17:41 AM
G - Gapped down today, trading near its 50 DMA line and prior low noted as important support levels to watch. More damaging losses leading to technical violations would raise concerns.
>>> The latest Featured Stock Update with an annotated graph appeared on 9/2/2010. Click here.
View all notes |
Alert me of new notes |
CANSLIM.net Company Profile |
SEC |
Zacks Reports |
StockTalk |
News |
Chart |
Request a new note
C
A N
S L
I M
|
BIDU
-
NASDAQ
Baidu Inc Ads
INTERNET - Internet Information Providers
|
$100.82
|
-2.58
-2.50% |
$103.50
|
16,205,563
164.01% of 50 DAV
50 DAV is 9,880,600
|
$107.19
-5.94%
|
9/17/2010
|
$85.73
|
PP = $88.42
|
|
MB = $92.84
|
Most Recent Note - 10/19/2010 12:48:15 PM
G - A solid gain with above average volume fell short of a new high close by only 42 cents on the prior session. After 3 very tight weekly closes, the nearest support is prior highs and its 50 DMA line in the $88-90 area. Due to report earnings on Thursday, 10/21/10.
>>> The latest Featured Stock Update with an annotated graph appeared on 10/7/2010. Click here.
View all notes |
Alert me of new notes |
CANSLIM.net Company Profile |
SEC |
Zacks Reports |
StockTalk |
News |
Chart |
Request a new note
C
A N
S L
I M
|
CACC
-
NASDAQ
Credit Acceptance Corp
FINANCIAL SERVICES - Credit Services
|
$57.88
|
-0.76
-1.30% |
$59.51
|
15,465
45.22% of 50 DAV
50 DAV is 34,200
|
$63.45
-8.78%
|
7/29/2010
|
$52.04
|
PP = $54.07
|
|
MB = $56.77
|
Most Recent Note - 10/19/2010 4:20:25 PM
G - Its 50 DMA line is still acting as resistance, and a convincing rebound above it would help its outlook improve. The recent chart low ($55.07 on 10/04/10) is the nearest chart support level to watch above its long ago chart highs ($53.97).
>>> The latest Featured Stock Update with an annotated graph appeared on 9/30/2010. Click here.
View all notes |
Alert me of new notes |
CANSLIM.net Company Profile |
SEC |
Zacks Reports |
StockTalk |
News |
Chart |
Request a new note
C
A N
S L
I M
|
CMG
-
NYSE
Chipotle Mexican Grill
LEISURE - Restaurants
|
$181.86
|
-1.83
-1.00% |
$183.88
|
690,222
114.83% of 50 DAV
50 DAV is 601,100
|
$184.47
-1.41%
|
9/1/2010
|
$158.31
|
PP = $155.52
|
|
MB = $163.30
|
Most Recent Note - 10/19/2010 4:08:05 PM
G - Recently inching to new all-time highs with near average volume behind recent gains while getting extended from a sound base pattern. Its 50 DMA line (now $164.53) defines chart support above its prior highs in the $155 area.
>>> The latest Featured Stock Update with an annotated graph appeared on 9/1/2010. Click here.
View all notes |
Alert me of new notes |
CANSLIM.net Company Profile |
SEC |
Zacks Reports |
StockTalk |
News |
Chart |
Request a new note
C
A N
S L
I M
|
Symbol/Exchange
Company Name
Industry Group |
PRICE |
CHANGE
(%Change) |
Day High |
Volume
(% DAV)
(% 50 day avg vol) |
52 Wk Hi
% From Hi |
Featured
Date |
Price
Featured |
Pivot Featured |
|
Max Buy |
CTRP
-
NASDAQ
Ctrip.Com Intl Ltd Adr
LEISURE - Resorts and Casinos
|
$49.15
|
-1.63
-3.21% |
$50.14
|
1,558,364
90.29% of 50 DAV
50 DAV is 1,725,900
|
$50.98
-3.59%
|
9/24/2010
|
$46.75
|
PP = $47.11
|
|
MB = $49.47
|
Most Recent Note - 10/19/2010 10:35:35 AM
G - Early weakness today led to brief trading below its "max buy" level. Prior highs in the $47 area define support to watch above its 50 DMA line.
>>> The latest Featured Stock Update with an annotated graph appeared on 9/28/2010. Click here.
View all notes |
Alert me of new notes |
CANSLIM.net Company Profile |
SEC |
Zacks Reports |
StockTalk |
News |
Chart |
Request a new note
C
A N
S L
I M
|
EBIX
-
NASDAQ
Ebix Inc
COMPUTER SOFTWARE and SERVICES - Business Software and Services
|
$23.83
|
+0.14
0.59% |
$24.09
|
460,171
76.09% of 50 DAV
50 DAV is 604,800
|
$25.61
-6.95%
|
9/23/2010
|
$21.78
|
PP = $22.74
|
|
MB = $23.88
|
Most Recent Note - 10/15/2010 3:15:03 PM
Y - Color code is changed to yellow as it continues its healthy consolidation since its negative reversal on 10/06/10. Tight closes in the past 3 weeks (best viewed on its weekly chart) are not considered an advanced "3-weeks tight" type pattern due to its lack of significant progress above the pivot point recently cited. (JOBS was recently noted as a better example of a "3 weeks tight" pattern.)
>>> The latest Featured Stock Update with an annotated graph appeared on 9/24/2010. Click here.
View all notes |
Alert me of new notes |
CANSLIM.net Company Profile |
SEC |
Zacks Reports |
StockTalk |
News |
Chart |
Request a new note
C
A N
S L
I M
|
EGO
-
NYSE
Eldorado Gold Corp
METALS and MINING - Gold
|
$17.02
|
-1.01
-5.60% |
$17.19
|
7,500,089
159.05% of 50 DAV
50 DAV is 4,715,700
|
$20.23
-15.87%
|
8/19/2010
|
$18.25
|
PP = $19.17
|
|
MB = $20.13
|
Most Recent Note - 10/19/2010 10:09:29 AM
G - Gapped down today for a damaging loss, raising concerns while technically violating the previously noted low ($17.65) identified as "an important chart support level."
>>> The latest Featured Stock Update with an annotated graph appeared on 10/12/2010. Click here.
View all notes |
Alert me of new notes |
CANSLIM.net Company Profile |
SEC |
Zacks Reports |
StockTalk |
News |
Chart |
Request a new note
C
A N
S L
I M
|
FFIV
-
NASDAQ
F 5 Networks Inc
INTERNET - Internet Software and Services
|
$90.99
|
-2.18
-2.34% |
$92.47
|
3,377,909
160.82% of 50 DAV
50 DAV is 2,100,400
|
$112.05
-18.80%
|
6/16/2010
|
$74.50
|
PP = $74.10
|
|
MB = $77.81
|
Most Recent Note - 10/19/2010 4:32:12 PM
G - It finished below its recent low close today after another damaging gap down loss on above average volume, slumping further below its 50 DMA line again. A prompt rebound above that important short-term average would help its outlook improve.
>>> The latest Featured Stock Update with an annotated graph appeared on 9/13/2010. Click here.
View all notes |
Alert me of new notes |
CANSLIM.net Company Profile |
SEC |
Zacks Reports |
StockTalk |
News |
Chart |
Request a new note
C
A N
S L
I M
|
FOSL
-
NASDAQ
Fossil Inc
CONSUMER DURABLES - Recreational Goods, Other
|
$53.43
|
-0.38
-0.71% |
$54.78
|
566,137
69.03% of 50 DAV
50 DAV is 820,100
|
$55.51
-3.75%
|
8/10/2010
|
$45.54
|
PP = $42.69
|
|
MB = $44.82
|
Most Recent Note - 10/14/2010 4:39:40 PM
G - Gain today with lighter volume after testing the upward trendline previously noted as initial support to watch after it has been repeatedly noted as "extended from any sound base." The next chart support level is its 50 DMA line.
>>> The latest Featured Stock Update with an annotated graph appeared on 10/5/2010. Click here.
View all notes |
Alert me of new notes |
CANSLIM.net Company Profile |
SEC |
Zacks Reports |
StockTalk |
News |
Chart |
Request a new note
C
A N
S L
I M
|
Symbol/Exchange
Company Name
Industry Group |
PRICE |
CHANGE
(%Change) |
Day High |
Volume
(% DAV)
(% 50 day avg vol) |
52 Wk Hi
% From Hi |
Featured
Date |
Price
Featured |
Pivot Featured |
|
Max Buy |
HMSY
-
NASDAQ
H M S Holdings Corp
COMPUTER SOFTWARE and SERVICES - Healthcare Information Service
|
$60.48
|
-0.87
-1.42% |
$61.27
|
124,718
72.30% of 50 DAV
50 DAV is 172,500
|
$62.91
-3.86%
|
9/27/2010
|
$57.97
|
PP = $58.36
|
|
MB = $61.28
|
Most Recent Note - 10/15/2010 1:15:51 PM
G - Reversed into the red after early gains today for a new high. In recent sessions it dipped below its "max buy" level and continued inching higher without great volume conviction behind gains since 9/27/10 when featured in yellow.
>>> The latest Featured Stock Update with an annotated graph appeared on 9/27/2010. Click here.
View all notes |
Alert me of new notes |
CANSLIM.net Company Profile |
SEC |
Zacks Reports |
StockTalk |
News |
Chart |
Request a new note
C
A N
S L
I M
|
HS
-
NYSE
Healthspring Inc
HEALTH SERVICES - Health Care Plans
|
$26.22
|
-1.15
-4.20% |
$27.15
|
588,498
84.07% of 50 DAV
50 DAV is 700,000
|
$27.49
-4.62%
|
8/27/2010
|
$19.91
|
PP = $19.75
|
|
MB = $20.74
|
Most Recent Note - 10/19/2010 3:51:43 PM
G - Gapped down today suffering a considerable loss with light volume after finishing the prior session at a new all-time high. Support to watch is prior chart highs in the $19-20 area.
>>> The latest Featured Stock Update with an annotated graph appeared on 8/27/2010. Click here.
View all notes |
Alert me of new notes |
CANSLIM.net Company Profile |
SEC |
Zacks Reports |
StockTalk |
News |
Chart |
Request a new note
C
A N
S L
I M
|
IGTE
-
NASDAQ
Igate Corp
COMPUTER SOFTWARE and SERVICES - Information Technology Service
|
$18.28
|
-0.36
-1.93% |
$18.60
|
562,048
122.93% of 50 DAV
50 DAV is 457,200
|
$19.45
-6.02%
|
9/8/2010
|
$17.29
|
PP = $18.26
|
|
MB = $19.17
|
Most Recent Note - 10/19/2010 10:27:46 AM
Y - Gapped down today for a small loss, yet it is continuing to trade in a tight trading range just above important chart support at its 50 DMA line and near its pivot point. More damaging losses would raise concerns and trigger technical sell signals.
>>> The latest Featured Stock Update with an annotated graph appeared on 9/10/2010. Click here.
View all notes |
Alert me of new notes |
CANSLIM.net Company Profile |
SEC |
Zacks Reports |
StockTalk |
News |
Chart |
Request a new note
C
A N
S L
I M
|
JOBS
-
NASDAQ
Fifty One Job Inc Ads
DIVERSIFIED SERVICES - Staffing and; Outsourcing Service
|
$43.26
|
-1.43
-3.20% |
$44.53
|
108,857
60.61% of 50 DAV
50 DAV is 179,600
|
$46.48
-6.93%
|
10/13/2010
|
$42.07
|
PP = $40.60
|
|
MB = $42.63
|
Most Recent Note - 10/19/2010 4:26:02 PM
G - Volume totals have been cooling while consolidating just above its "max buy" level following its big 10/13/10 gain.
>>> The latest Featured Stock Update with an annotated graph appeared on 9/16/2010. Click here.
View all notes |
Alert me of new notes |
CANSLIM.net Company Profile |
SEC |
Zacks Reports |
StockTalk |
News |
Chart |
Request a new note
C
A N
S L
I M
|
LFT
-
NYSE
Longtop Financl Tech Ads
COMPUTER SOFTWARE and SERVICES - Business Software and Services
|
$38.69
|
-1.15
-2.89% |
$39.37
|
361,334
74.69% of 50 DAV
50 DAV is 483,800
|
$41.77
-7.37%
|
10/14/2010
|
$39.97
|
PP = $41.87
|
|
MB = $43.96
|
Most Recent Note - 10/19/2010 3:55:52 PM
Y - Gapped down, slumping today without great volume as it trades toward recent support near its 50 DMA line. It has formed a 10-month long flat base and maintained a very strong sales revenues and earnings track record. Its high volume and lack of meaningful price progress is a sign of distributional pressure since it returned to the Featured Stocks list on 10/14/10 and was noted - "Patient and disciplined investors will resist the urge to get in 'early' and wait for a proper buy signal."
>>> The latest Featured Stock Update with an annotated graph appeared on 10/14/2010. Click here.
View all notes |
Alert me of new notes |
CANSLIM.net Company Profile |
SEC |
Zacks Reports |
StockTalk |
News |
Chart |
Request a new note
C
A N
S L
I M
|
Symbol/Exchange
Company Name
Industry Group |
PRICE |
CHANGE
(%Change) |
Day High |
Volume
(% DAV)
(% 50 day avg vol) |
52 Wk Hi
% From Hi |
Featured
Date |
Price
Featured |
Pivot Featured |
|
Max Buy |
LULU
-
NASDAQ
Lululemon Athletica
MANUFACTURING - Textile Manufacturing
|
$43.31
|
-2.28
-5.00% |
$44.98
|
1,510,819
134.94% of 50 DAV
50 DAV is 1,119,600
|
$48.45
-10.61%
|
10/8/2010
|
$47.66
|
PP = $46.67
|
|
MB = $49.00
|
Most Recent Note - 10/19/2010 3:45:51 PM
G - Loss today with above average volume marks its 6th loss in 7 sessions since its 10/08/10 technical breakout with heavier volume was noted. Color code is changed to green while slumping below prior highs in the $45-46 area.
>>> The latest Featured Stock Update with an annotated graph appeared on 10/8/2010. Click here.
View all notes |
Alert me of new notes |
CANSLIM.net Company Profile |
SEC |
Zacks Reports |
StockTalk |
News |
Chart |
Request a new note
C
A N
S L
I M
|
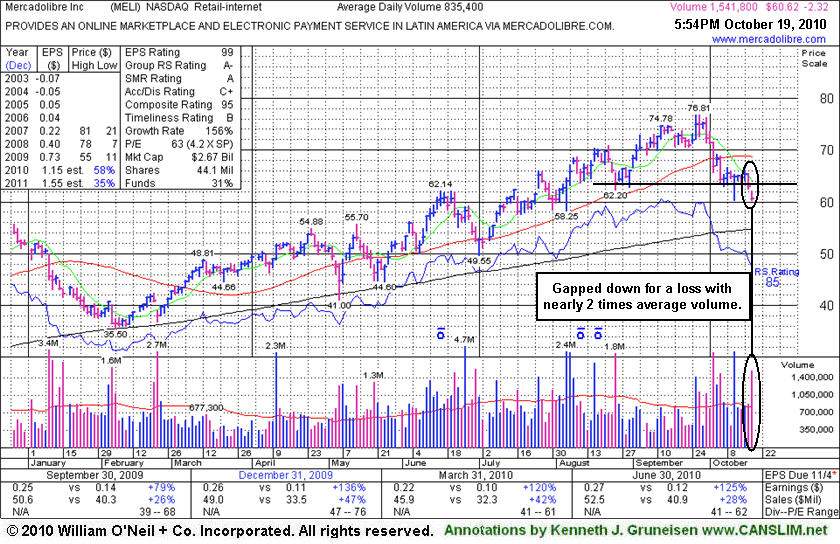
MELI
-
NASDAQ
Mercadolibre Inc
INTERNET - Internet Software and; Services
|
$60.65
|
-2.29
-3.64% |
$62.16
|
1,548,612
179.59% of 50 DAV
50 DAV is 862,300
|
$76.81
-21.04%
|
5/13/2010
|
$54.21
|
PP = $55.85
|
|
MB = $58.64
|
Most Recent Note - 10/19/2010 10:42:52 AM
G - Small gap down today, trading more than -20% off its 52-week high after finishing below its low close of 8/25/10 on the prior session. The next support to watch is its 200 DMA line, meanwhile a rebound above its 50 DMA line is needed for its outlook to improve. Based on weakness and technical deterioration it will be dropped from the Featured Stocks list tonight.
>>> The latest Featured Stock Update with an annotated graph appeared on 10/19/2010. Click here.
View all notes |
Alert me of new notes |
CANSLIM.net Company Profile |
SEC |
Zacks Reports |
StockTalk |
News |
Chart |
Request a new note
C
A N
S L
I M
|
MRX
-
NYSE
Medicis Pharmaceut Cl A
DRUGS - Biotechnology
|
$30.18
|
-0.18
-0.59% |
$30.21
|
1,405,471
121.31% of 50 DAV
50 DAV is 1,158,600
|
$30.94
-2.46%
|
8/12/2010
|
$26.88
|
PP = $26.71
|
|
MB = $28.05
|
Most Recent Note - 10/19/2010 4:36:35 PM
G - Traded higher volume today while still consolidating near its 52-week high. Support levels to watch include its 50 DMA line and its recent chart lows.
>>> The latest Featured Stock Update with an annotated graph appeared on 10/4/2010. Click here.
View all notes |
Alert me of new notes |
CANSLIM.net Company Profile |
SEC |
Zacks Reports |
StockTalk |
News |
Chart |
Request a new note
C
A N
S L
I M
|
MWIV
-
NASDAQ
M W I Veterinary Supply
HEALTH SERVICES - Medical Instruments and; Supplies
|
$55.45
|
-1.55
-2.72% |
$57.08
|
69,098
108.13% of 50 DAV
50 DAV is 63,900
|
$59.50
-6.81%
|
7/29/2010
|
$52.05
|
PP = $52.09
|
|
MB = $54.69
|
Most Recent Note - 10/19/2010 4:01:45 PM
G - Enduring mild distributional pressure, it is trading near its 50 DMA line. A subsequent violation of that classic chart support level would raise greater concerns.
>>> The latest Featured Stock Update with an annotated graph appeared on 9/7/2010. Click here.
View all notes |
Alert me of new notes |
CANSLIM.net Company Profile |
SEC |
Zacks Reports |
StockTalk |
News |
Chart |
Request a new note
C
A N
S L
I M
|
NEM
-
NYSE
Newmont Mining Corp
METALS and MINING - Gold
|
$59.93
|
-2.56
-4.10% |
$60.96
|
9,396,717
152.36% of 50 DAV
50 DAV is 6,167,300
|
$65.50
-8.50%
|
8/31/2010
|
$61.32
|
PP = $63.48
|
|
MB = $66.65
|
Most Recent Note - 10/19/2010 10:21:29 AM
G - Gapped down today, violating its 50 DMA line amid weakness in the Mining - Gold/Silver/Gems group (L criteria). Color code is changed to green due to its technical deterioration, while more damaging losses would raise even greater concerns.
>>> The latest Featured Stock Update with an annotated graph appeared on 9/14/2010. Click here.
View all notes |
Alert me of new notes |
CANSLIM.net Company Profile |
SEC |
Zacks Reports |
StockTalk |
News |
Chart |
Request a new note
C
A N
S L
I M
|
Symbol/Exchange
Company Name
Industry Group |
PRICE |
CHANGE
(%Change) |
Day High |
Volume
(% DAV)
(% 50 day avg vol) |
52 Wk Hi
% From Hi |
Featured
Date |
Price
Featured |
Pivot Featured |
|
Max Buy |
NEOG
-
NASDAQ
Neogen Corp
DRUGS - Diagnostic Substances
|
$34.35
|
-1.84
-5.08% |
$35.65
|
88,378
84.33% of 50 DAV
50 DAV is 104,800
|
$36.37
-5.55%
|
9/1/2010
|
$30.79
|
PP = $30.49
|
|
MB = $32.01
|
Most Recent Note - 10/19/2010 3:50:24 PM
G - Gapped down today, suffering a considerable loss with below average volume after finishing the prior session at a new high close. Prior highs in the $30 area define initial support to watch.
>>> The latest Featured Stock Update with an annotated graph appeared on 10/13/2010. Click here.
View all notes |
Alert me of new notes |
CANSLIM.net Company Profile |
SEC |
Zacks Reports |
StockTalk |
News |
Chart |
Request a new note
C
A N
S L
I M
|
NFLX
-
NASDAQ
Netflix Inc
SPECIALTY RETAIL - Music and Video Stores
|
$149.33
|
-3.67
-2.40% |
$152.43
|
3,660,942
64.54% of 50 DAV
50 DAV is 5,672,400
|
$174.40
-14.38%
|
8/10/2010
|
$124.05
|
PP = $124.00
|
|
MB = $130.20
|
Most Recent Note - 10/19/2010 4:45:58 PM
G - Small gap down today, slumping toward its recent chart low ($148.05) and 50 DMA line - important chart support levels to watch. Confined to trading in a tight range with volume totals continuing to cool in the weeks following the "negative reversal" at its all-time high on 9/30/10.
>>> The latest Featured Stock Update with an annotated graph appeared on 10/1/2010. Click here.
View all notes |
Alert me of new notes |
CANSLIM.net Company Profile |
SEC |
Zacks Reports |
StockTalk |
News |
Chart |
Request a new note
C
A N
S L
I M
|
NTAP
-
NASDAQ
Netapp Inc
COMPUTER HARDWARE - Data Storage Devices
|
$51.00
|
+0.70
1.39% |
$51.77
|
10,226,481
118.42% of 50 DAV
50 DAV is 8,635,700
|
$51.40
-0.78%
|
9/8/2010
|
$46.98
|
PP = $44.99
|
|
MB = $47.24
|
Most Recent Note - 10/19/2010 4:22:30 PM
G - Considerable gain today with above average volume, matching its best-ever close. Its 50 DMA line and prior highs that now coincide to define chart support in the $45 area.
>>> The latest Featured Stock Update with an annotated graph appeared on 9/8/2010. Click here.
View all notes |
Alert me of new notes |
CANSLIM.net Company Profile |
SEC |
Zacks Reports |
StockTalk |
News |
Chart |
Request a new note
C
A N
S L
I M
|
ORCL
-
NASDAQ
Oracle Corp
COMPUTER SOFTWARE and SERVICES - Application Software
|
$29.13
|
-0.10
-0.34% |
$29.24
|
44,633,308
115.28% of 50 DAV
50 DAV is 38,715,700
|
$29.23
-0.34%
|
9/20/2010
|
$27.32
|
PP = $26.73
|
|
MB = $28.07
|
Most Recent Note - 10/15/2010 6:28:00 PM
G - Gains today and Wednesday with greater volume conviction have it now extended slightly beyond its "max buy" level.
>>> The latest Featured Stock Update with an annotated graph appeared on 9/20/2010. Click here.
View all notes |
Alert me of new notes |
CANSLIM.net Company Profile |
SEC |
Zacks Reports |
StockTalk |
News |
Chart |
Request a new note
C
A N
S L
I M
|
PAY
-
NYSE
Verifone Systems Inc
COMPUTER HARDWARE - Transaction Automation Systems
|
$28.48
|
-0.72
-2.47% |
$29.24
|
832,021
57.08% of 50 DAV
50 DAV is 1,457,700
|
$31.40
-9.30%
|
8/25/2010
|
$24.30
|
PP = $23.74
|
|
MB = $24.93
|
Most Recent Note - 10/19/2010 4:04:25 PM
G - Volume totals have generally been cooling in recent weeks while consolidating above support at its 50 DMA line (now $26.38).
>>> The latest Featured Stock Update with an annotated graph appeared on 8/30/2010. Click here.
View all notes |
Alert me of new notes |
CANSLIM.net Company Profile |
SEC |
Zacks Reports |
StockTalk |
News |
Chart |
Request a new note
C
A N
S L
I M
|
Symbol/Exchange
Company Name
Industry Group |
PRICE |
CHANGE
(%Change) |
Day High |
Volume
(% DAV)
(% 50 day avg vol) |
52 Wk Hi
% From Hi |
Featured
Date |
Price
Featured |
Pivot Featured |
|
Max Buy |
PRGO
-
NASDAQ
Perrigo Co
DRUGS - Drug Related Products
|
$63.68
|
-0.99
-1.53% |
$64.66
|
764,360
84.88% of 50 DAV
50 DAV is 900,500
|
$67.94
-6.27%
|
9/15/2010
|
$63.73
|
PP = $64.76
|
|
MB = $68.00
|
Most Recent Note - 10/19/2010 4:14:11 PM
Y - Down today for a 5th consecutive small loss with light or near average volume, closing below its pivot point. More damaging losses would raise concerns, meanwhile its 50 DMA line defines important chart support.
>>> The latest Featured Stock Update with an annotated graph appeared on 9/15/2010. Click here.
View all notes |
Alert me of new notes |
CANSLIM.net Company Profile |
SEC |
Zacks Reports |
StockTalk |
News |
Chart |
Request a new note
C
A N
S L
I M
|
RAX
-
NYSE
Rackspace Hosting Inc
INTERNET - Internet Software and; Services
|
$22.45
|
-1.03
-4.39% |
$23.33
|
2,045,049
83.13% of 50 DAV
50 DAV is 2,460,200
|
$26.50
-15.28%
|
9/21/2010
|
$22.84
|
PP = $23.61
|
|
MB = $24.79
|
Most Recent Note - 10/19/2010 10:32:38 AM
Y - Gapped down today, trading near previously noted lows in the $22.40 area and its 50 DMA line. More damaging losses would raise serious concerns.
>>> The latest Featured Stock Update with an annotated graph appeared on 9/21/2010. Click here.
View all notes |
Alert me of new notes |
CANSLIM.net Company Profile |
SEC |
Zacks Reports |
StockTalk |
News |
Chart |
Request a new note
C
A N
S L
I M
|
ROVI
-
NASDAQ
Rovi Corp
COMPUTER SOFTWARE andamp; SERVICES - Security Software andamp; Services
|
$49.01
|
-0.19
-0.39% |
$49.62
|
1,359,559
90.63% of 50 DAV
50 DAV is 1,500,200
|
$53.00
-7.53%
|
8/31/2010
|
$43.31
|
PP = $45.06
|
|
MB = $47.31
|
Most Recent Note - 10/19/2010 4:18:28 PM
G - Closed in the upper third of its intra-day range today after briefly trading under its 10/07/10 low. Consolidating in a healthy fashion well above support at prior highs and its 50 DMA line.
>>> The latest Featured Stock Update with an annotated graph appeared on 8/24/2010. Click here.
View all notes |
Alert me of new notes |
CANSLIM.net Company Profile |
SEC |
Zacks Reports |
StockTalk |
News |
Chart |
Request a new note
C
A N
S L
I M
|
SHOO
-
NASDAQ
Steven Madden Limited
CONSUMER NON-DURABLES - Textile - Apparel Footwear
|
$41.43
|
-2.28
-5.22% |
$43.50
|
418,686
119.08% of 50 DAV
50 DAV is 351,600
|
$44.85
-7.63%
|
9/15/2010
|
$38.94
|
PP = $40.27
|
|
MB = $42.28
|
Most Recent Note - 10/19/2010 3:42:03 PM
Y - Considerable loss today with near average but higher volume, quickly slumping under its "max buy" level toward prior highs in the $40 area that define important chart support. Color code is changed to yellow, while more damaging losses could raise concerns.
>>> The latest Featured Stock Update with an annotated graph appeared on 9/29/2010. Click here.
View all notes |
Alert me of new notes |
CANSLIM.net Company Profile |
SEC |
Zacks Reports |
StockTalk |
News |
Chart |
Request a new note
C
A N
S L
I M
|
SLW
-
NYSE
Silver Wheaton Corp
METALS and; MINING - Silver
|
$25.99
|
-1.91
-6.85% |
$27.40
|
10,955,299
179.11% of 50 DAV
50 DAV is 6,116,400
|
$28.39
-8.45%
|
8/25/2010
|
$21.40
|
PP = $21.99
|
|
MB = $23.09
|
Most Recent Note - 10/19/2010 1:29:42 PM
G - Gapped down today amid widespread losses in the Mining - Gold/Silver/Gems group. Now trading -7% off its 52 week high, its 50 DMA line defines chart support to watch.
>>> The latest Featured Stock Update with an annotated graph appeared on 10/18/2010. Click here.
View all notes |
Alert me of new notes |
CANSLIM.net Company Profile |
SEC |
Zacks Reports |
StockTalk |
News |
Chart |
Request a new note
C
A N
S L
I M
|
Symbol/Exchange
Company Name
Industry Group |
PRICE |
CHANGE
(%Change) |
Day High |
Volume
(% DAV)
(% 50 day avg vol) |
52 Wk Hi
% From Hi |
Featured
Date |
Price
Featured |
Pivot Featured |
|
Max Buy |
SVR
-
NYSE
Syniverse Holdings Inc
TELECOMMUNICATIONS - Diversified Communication Serv
|
$23.48
|
-0.21
-0.89% |
$23.75
|
690,940
95.04% of 50 DAV
50 DAV is 727,000
|
$24.24
-3.14%
|
9/22/2010
|
$23.60
|
PP = $23.87
|
|
MB = $25.06
|
Most Recent Note - 10/15/2010 6:37:53 PM
Y - Perched -3.6% off its 52-week high today, its color code was changed to yellow after recovering with recent light volume gains since finding prompt support near its 50 DMA line. Confirming gains for a new high close with heavy volume would be a bullish sign, meanwhile the recent chart low ($21.47) defines important support to watch.
>>> The latest Featured Stock Update with an annotated graph appeared on 9/22/2010. Click here.
View all notes |
Alert me of new notes |
CANSLIM.net Company Profile |
SEC |
Zacks Reports |
StockTalk |
News |
Chart |
Request a new note
C
A N
S L
I M
|
UA
-
NYSE
Under Armour Inc Cl A
CONSUMER NON-DURABLES - Textile - Apparel Clothing
|
$44.88
|
-1.35
-2.92% |
$45.97
|
603,148
81.87% of 50 DAV
50 DAV is 736,700
|
$48.00
-6.50%
|
9/9/2010
|
$39.99
|
PP = $40.10
|
|
MB = $42.11
|
Most Recent Note - 10/19/2010 3:59:02 PM
G - Down on light volume today, slumping near recent chart lows amid widespread losses, while several high-ranked Apparel -Clothing firms are also enduring big losses. Company is due to report earnings on Oct 26th.
>>> The latest Featured Stock Update with an annotated graph appeared on 9/9/2010. Click here.
View all notes |
Alert me of new notes |
CANSLIM.net Company Profile |
SEC |
Zacks Reports |
StockTalk |
News |
Chart |
Request a new note
C
A N
S L
I M
|
UFPT
-
NASDAQ
U F P Tech Inc
CONSUMER NON-DURABLES - Packaging and Containers
|
$12.67
|
-0.32
-2.46% |
$13.00
|
69,001
115.58% of 50 DAV
50 DAV is 59,700
|
$13.32
-4.88%
|
9/16/2010
|
$11.20
|
PP = $11.69
|
|
MB = $12.27
|
Most Recent Note - 10/19/2010 4:40:58 PM
G - Consolidating near its 52-week high with a loss on average volume today following recent gains with higher volume. Prior highs in the $11 area define chart support to watch.
>>> The latest Featured Stock Update with an annotated graph appeared on 9/17/2010. Click here.
View all notes |
Alert me of new notes |
CANSLIM.net Company Profile |
SEC |
Zacks Reports |
StockTalk |
News |
Chart |
Request a new note
C
A N
S L
I M
|
ULTA
-
NASDAQ
Ulta Salon Cosm & Frag
SPECIALTY RETAIL - Specialty Retail, Other
|
$30.80
|
-0.86
-2.72% |
$31.65
|
470,775
70.92% of 50 DAV
50 DAV is 663,800
|
$31.73
-2.93%
|
9/3/2010
|
$26.36
|
PP = $25.89
|
|
MB = $27.18
|
Most Recent Note - 10/19/2010 4:42:29 PM
G - Quietly pulling back today from a 52-week high it hit on the prior session. Prior highs and its 50 DMA line coincide in the $26 area defining support to watch. No overhead supply remains to act as resistance.
>>> The latest Featured Stock Update with an annotated graph appeared on 9/3/2010. Click here.
View all notes |
Alert me of new notes |
CANSLIM.net Company Profile |
SEC |
Zacks Reports |
StockTalk |
News |
Chart |
Request a new note
C
A N
S L
I M
|
VIT
-
NYSE
Vanceinfo Tech Inc Ads
COMPUTER SOFTWARE and SERVICES - Business Software and Services
|
$34.01
|
-0.74
-2.13% |
$34.57
|
489,963
73.46% of 50 DAV
50 DAV is 667,000
|
$34.93
-2.63%
|
7/8/2010
|
$25.20
|
PP = $26.58
|
|
MB = $27.91
|
Most Recent Note - 10/19/2010 10:24:49 AM
G - Up from earlier lows after a small gap down today. Recently reached new all-time highs without great volume conviction. Its 50 DMA line and recent lows near $26.50 define important chart support to watch.
>>> The latest Featured Stock Update with an annotated graph appeared on 8/31/2010. Click here.
View all notes |
Alert me of new notes |
CANSLIM.net Company Profile |
SEC |
Zacks Reports |
StockTalk |
News |
Chart |
Request a new note
C
A N
S L
I M
|
Symbol/Exchange
Company Name
Industry Group |
PRICE |
CHANGE
(%Change) |
Day High |
Volume
(% DAV)
(% 50 day avg vol) |
52 Wk Hi
% From Hi |
Featured
Date |
Price
Featured |
Pivot Featured |
|
Max Buy |
WCRX
-
NASDAQ
Warner Chilcott Plc
DRUGS - Drug Manufacturers - Other
|
$23.66
|
-0.45
-1.87% |
$24.10
|
1,375,195
47.15% of 50 DAV
50 DAV is 2,916,500
|
$25.32
-6.56%
|
8/23/2010
|
$21.04
|
PP = $20.84
|
|
MB = $21.88
|
Most Recent Note - 10/19/2010 4:38:50 PM
G - Quietly consolidating toward prior chart highs after a burst of buying last week drove it to all-time highs. Prior highs near $23.50 define near-term support above its 50 DMA line.
>>> The latest Featured Stock Update with an annotated graph appeared on 10/15/2010. Click here.
View all notes |
Alert me of new notes |
CANSLIM.net Company Profile |
SEC |
Zacks Reports |
StockTalk |
News |
Chart |
Request a new note
C
A N
S L
I M
|