You are not logged in.
This means you
CAN ONLY VIEW reports that were published prior to Monday, April 14, 2025.
You
MUST UPGRADE YOUR MEMBERSHIP if you want to see any current reports.
AFTER MARKET UPDATE - THURSDAY, OCTOBER 16TH, 2014
Previous After Market Report Next After Market Report >>>
|
|
|
|
DOW |
-24.50 |
16,117.24 |
-0.15% |
|
Volume |
1,033,175,060 |
-13% |
|
Volume |
2,387,165,200 |
-15% |
|
NASDAQ |
+2.07 |
4,217.39 |
+0.05% |
|
Advancers |
2,202 |
69% |
|
Advancers |
1,925 |
63% |
|
S&P 500 |
+0.27 |
1,862.76 |
+0.01% |
|
Decliners |
898 |
28% |
|
Decliners |
1,051 |
35% |
|
Russell 2000 |
+13.67 |
1,086.11 |
+1.27% |
|
52 Wk Highs |
26 |
|
|
52 Wk Highs |
22 |
|
|
S&P 600 |
+5.54 |
626.52 |
+0.89% |
|
52 Wk Lows |
175 |
|
|
52 Wk Lows |
122 |
|
|
 |
Volume Totals Cooled With Breadth Positive as Volatility Continued
Kenneth J. Gruneisen - Passed the CAN SLIM® Master's Exam
Market volatility continued on Thursday. The Dow, which declined as many as 206 points, finished down 24 points to 16,117. The S&P 500 was virtually unchanged at 1,862, erasing an earlier loss of 27 points. The NASDAQ Composite rebounded from a decline of as much as 83 points to end the session 2 points higher to 4,217. The volume totals were reported lighter than the prior session totals on the NYSE and on the Nasdaq exchange. Breadth was positive as advancers led decliners by more than a 2-1 margin on the NYSE and nearly 2-1 on the Nasdaq exchange. Leadership remained scant as there were only 3 high-ranked companies from the CANSLIM.net Leaders List that made new 52-week highs and appeared on the CANSLIM.net BreakOuts Page, down from the prior session total of 5 stocks. The new 52-week lows list contracted but still easily outnumbered new 52-week highs on the NYSE and on the Nasdaq exchange. There were gains for 3 of the 4 high-ranked companies currently included on the Featured Stocks Page, a list that has waned as market conditions eroded. Distributional action raised concerns while leadership (stocks hitting new 52-week highs) waned and a deteriorating market (M criteria) environment was repeatedly noted in this commentary. New buying efforts are discouraged during market corrections while the fact-based investment system prompts disciplined investors to lean toward reducing market exposure.
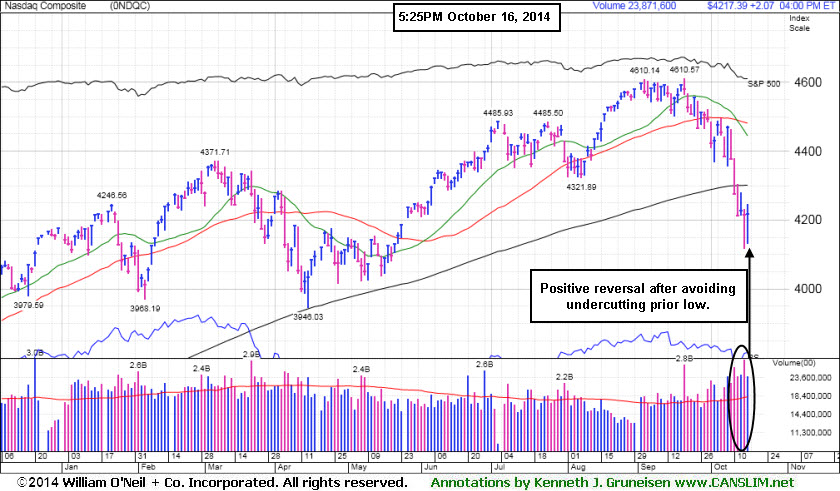
PICTURED: The Nasdaq Composite Index managed a "positive reversal" after avoiding undercutting the prior session low. It remains below its 200-day moving average (DMA) line and must rebound above that important long-term average to be considered in "healthy" technical shape.
Stocks recovered from early losses after St. Louis Fed President James Bullard said the FOMC should consider a delay in ending its monthly bond-buying program given the drop in inflation expectations. Encouraging economic data added to the upside. Jobless claims unexpectedly dropped to a 14-year low of 264,000. Other reports also topped expectations. Industrial production increased by the most since November 2012 and the Philadelphia Fed's factory index for October came in above consensus estimates. In addition, capacity utilization rose by the most since June 2008.
Overall, six of the 10 sectors in the S&P 500 advanced. Energy was the best performing group as WTI crude rebounded after falling below $80 for the first time since June 2012. Anadarko Petroleum (APC +4.8%) posted a solid gain and Chesapeake Energy (CHK +16.8%) spiked higher. Materials also advanced as Monsanto (MON +1.9%) rose. Consumer staples and telecom weighed on the market. Wal-Mart (WMT -1.8%) fell after cutting its full-year sales growth forecast. Shares of AT&T (T -0.5%) also edged lower.
Treasuries retreated following their recent rally. The 10-year note fell 7/32 to yield 2.16%.
The CANSLIM.net Featured Stocks Page shows the most action-worthy candidates and their latest notes and a Headline Link directs members to the latest detailed analysis with data-packed graphs annotated by a Certified expert along with links to additional resources. The Premium Member Homepage includes "dynamic archives" to all prior pay reports published.
|
 Kenneth J. Gruneisen started out as a licensed stockbroker in August 1987, a couple of months prior to the historic stock market crash that took the Dow Jones Industrial Average down -22.6% in a single day. He has published daily fact-based fundamental and technical analysis on high-ranked stocks online for two decades. Through FACTBASEDINVESTING.COM, Kenneth provides educational articles, news, market commentary, and other information regarding proven investment systems that work in good times and bad.
Comments contained in the body of this report are technical opinions only and are not necessarily those of Gruneisen Growth Corp. The material herein has been obtained from sources believed to be reliable and accurate, however, its accuracy and completeness cannot be guaranteed. Our firm, employees, and customers may effect transactions, including transactions contrary to any recommendation herein, or have positions in the securities mentioned herein or options with respect thereto. Any recommendation contained in this report may not be suitable for all investors and it is not to be deemed an offer or solicitation on our part with respect to the purchase or sale of any securities. |
|
 |
Energy, Tech, and Financial Groups Bounced
Kenneth J. Gruneisen - Passed the CAN SLIM® Master's Exam
Energy-related shares rebounded on Thursday as the Oil Services Index ($OSX +1.20%) and the Integrated Oil Index ($XOI +1.54%) rose. The Biotechnology Index ($BTK +1.36%) and Semiconductor Index ($SOX +1.49%) led the tech sector with gains while the Networking Index ($NWX -0.46%) edged lower. The Broker/Dealer Index ($XBD +0.93%) outpaced the Bank Index ($BKX +0.23%) as financial shares bounced. The Gold & Silver Index ($XAU +0.10%) finished flat. Weakness in the Retail Index ($RLX -0.48%) created a drag on the major averages.
Charts courtesy www.stockcharts.com
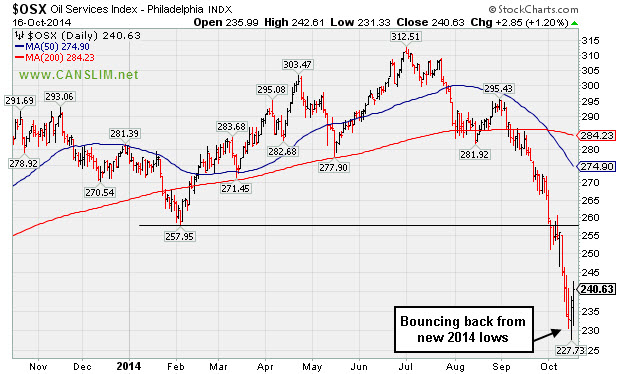
PICTURED: The Oil Services Index ($OSX +1.20%) is bouncing back from new 2014 lows.
| Oil Services |
$OSX |
240.63 |
+2.85 |
+1.20% |
-14.38% |
| Integrated Oil |
$XOI |
1,397.67 |
+21.17 |
+1.54% |
-7.02% |
| Semiconductor |
$SOX |
570.73 |
+8.39 |
+1.49% |
+6.67% |
| Networking |
$NWX |
289.53 |
-1.35 |
-0.46% |
-10.62% |
| Broker/Dealer |
$XBD |
160.57 |
+1.48 |
+0.93% |
+0.00% |
| Retail |
$RLX |
887.09 |
-4.26 |
-0.48% |
-5.61% |
| Gold & Silver |
$XAU |
79.30 |
+0.08 |
+0.10% |
-5.76% |
| Bank |
$BKX |
66.52 |
+0.15 |
+0.23% |
-3.96% |
| Biotech |
$BTK |
2,988.26 |
+39.98 |
+1.36% |
+28.23% |
|
|
|
 |
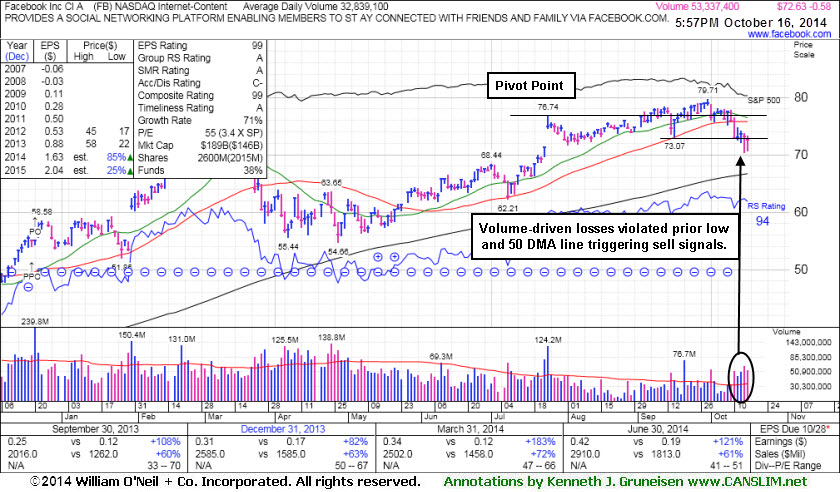
Volume-Driven Losses Triggered Sell Signals After Slumping Into Prior Base
Kenneth J. Gruneisen - Passed the CAN SLIM® Master's Exam
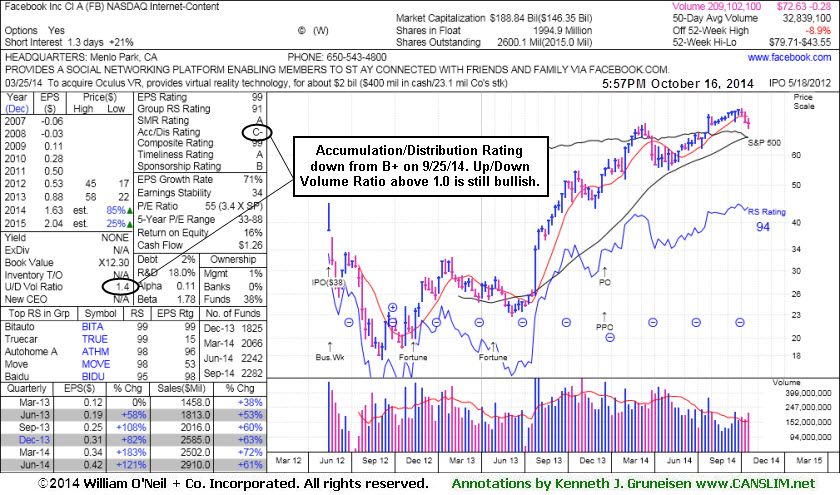
Facebook Inc (FB -$0.58 or -0.79% to $72.63) recently slumped back into its prior base and retreated below its 50-day moving average (DMA) line and its prior low ($73.07 on 9/16/14) with volume-driven losses raising concerns and triggering technical sell signals. A rebound above the 50 DMA line is needed for its outlook to improve. Disciplined investors always limit losses by selling any stocks that fall more than -7% from their purchase price. Its Accumulation/Distribution Rating fell from a B+ to a C- since last shown in this FSU section on 9/25/14 with annotated graphs under the headline, "Fell Toward 50-day Moving Average; Recent Gains Lacked Great Volume". However, its current Up/Down Volume Ratio of 1.4 is still an unbiased indication its shares have been under accumulation over the past 50 days.
It reported earnings +121% on +61% sales revenues for the Jun '14 quarter, its 5th consecutive quarterly comparison with earnings increasing well above the +25% minimum (C criteria). The high-ranked Internet - Content group leader has seen the number of top-rated funds owning its shares rise from 1,116 in Dec '12 to 2,282 in Sep '14, a reassuring sign concerning the I criteria. Members were previously warned - "Keep in mind that its large supply of 2.54 billion shares in the public float makes it an unlikely sprinter, especially as it is already well known by the institutional crowd and the general public."
|
|
|
Color Codes Explained :
Y - Better candidates highlighted by our
staff of experts.
G - Previously featured
in past reports as yellow but may no longer be buyable under the
guidelines.
***Last / Change / Volume data in this table is the closing quote data***
Symbol/Exchange
Company Name
Industry Group |
PRICE |
CHANGE
(%Change) |
Day High |
Volume
(% DAV)
(% 50 day avg vol) |
52 Wk Hi
% From Hi |
Featured
Date |
Price
Featured |
Pivot Featured |
|
Max Buy |
ACT
-
NYSE
Actavis plc
Medical-Generic Drugs
|
$222.07
|
+4.83
2.22% |
$224.78
|
2,778,989
119.89% of 50 DAV
50 DAV is 2,318,000
|
$249.94
-11.15%
|
6/20/2014
|
$216.53
|
PP = $230.87
|
|
MB = $242.41
|
 Most Recent Note - 10/16/2014 6:27:10 PM
G - Halted its slide with a gain today after testing support at its 200 DMA line. Streak of 5 consecutive losses marked by volume triggered technical sell signals. Only a prompt rebound above its 50 DMA line would help its outlook improve.
>>> FEATURED STOCK ARTICLE : Held Ground Above Prior Highs Defining Near-Term Support - 10/8/2014
View all notes |
Set NEW NOTE alert |
CANSLIM.net Company Profile |
SEC
News |
Chart |
Request a new note
C
A N
S L
I M


|
FB
-
NASDAQ
Facebook Inc Cl A
INTERNET
|
$72.63
|
-0.58
-0.79% |
$73.35
|
53,384,172
162.56% of 50 DAV
50 DAV is 32,839,000
|
$79.71
-8.88%
|
9/9/2014
|
$76.67
|
PP = $76.84
|
|
MB = $80.68
|
Most Recent Note - 10/16/2014 6:20:22 PM
G - Volume-driven losses recently raised concerns and triggered technical sell signals. A rebound above the 50 DMA line is needed for its outlook to improve. See the latest FSU analysis for more details and new annotated graphs.
>>> FEATURED STOCK ARTICLE : Volume-Driven Losses Triggered Sell Signals After Slumping Into Prior Base - 10/16/2014
View all notes |
Set NEW NOTE alert |
CANSLIM.net Company Profile |
SEC
News |
Chart |
Request a new note
C
A N
S L
I M
|
PANW
-
NYSE
Palo Alto Networks
Computer Sftwr-Security
|
$97.88
|
+0.45
0.46% |
$100.16
|
2,332,842
112.37% of 50 DAV
50 DAV is 2,076,000
|
$106.79
-8.34%
|
7/30/2014
|
$84.21
|
PP = $85.88
|
|
MB = $90.17
|
Most Recent Note - 10/16/2014 6:22:01 PM
G - Prompt rebound above the 50 DMA line helped its outlook improve. Recent low ($87.83 on 10/13/14) defines important near-term support where any subsequent violation would raise more serious concerns and trigger a more worrisome technical sell signal.
>>> FEATURED STOCK ARTICLE : Prompt Rebound Above 50-Day Average an Encouraging Sign of Support - 10/14/2014
View all notes |
Set NEW NOTE alert |
CANSLIM.net Company Profile |
SEC
News |
Chart |
Request a new note
C
A N
S L
I M
|
STRT
-
NASDAQ
Strattec Security Corp
AUTOMOTIVE - Auto Parts
|
$80.31
|
+1.74
2.21% |
$81.09
|
28,607
119.20% of 50 DAV
50 DAV is 24,000
|
$89.87
-10.64%
|
9/19/2014
|
$86.06
|
PP = $89.97
|
|
MB = $94.47
|
Most Recent Note - 10/16/2014 6:24:19 PM
Y - Rebounded above its 50 DMA line with a 3rd consecutive gain and its color code is changed to yellow. Poor market conditions (M criteria) have raised overriding concerns arguing against any new buying efforts until strength returns. Recent low ($72.13 on 10/15/14) defines important near-term support to watch. Faces near term resistance due to overhead supply up through the $89 level.
>>> FEATURED STOCK ARTICLE : Consolidating Above Prior Highs and 50-Day Moving Average Line - 9/26/2014
View all notes |
Set NEW NOTE alert |
CANSLIM.net Company Profile |
SEC
News |
Chart |
Request a new note
C
A N
S L
I M
|
|
|
|
THESE ARE NOT BUY RECOMMENDATIONS!
Comments contained in the body of this report are technical
opinions only. The material herein has been obtained
from sources believed to be reliable and accurate, however,
its accuracy and completeness cannot be guaranteed.
This site is not an investment advisor, hence it does
not endorse or recommend any securities or other investments.
Any recommendation contained in this report may not
be suitable for all investors and it is not to be deemed
an offer or solicitation on our part with respect to
the purchase or sale of any securities. All trademarks,
service marks and trade names appearing in this report
are the property of their respective owners, and are
likewise used for identification purposes only.
This report is a service available
only to active Paid Premium Members.
You may opt-out of receiving report notifications
at any time. Questions or comments may be submitted
by writing to Premium Membership Services 665 S.E. 10 Street, Suite 201 Deerfield Beach, FL 33441-5634 or by calling 1-800-965-8307
or 954-785-1121.
|
|
|

