You are not logged in.
This means you
CAN ONLY VIEW reports that were published prior to Monday, March 31, 2025.
You
MUST UPGRADE YOUR MEMBERSHIP if you want to see any current reports.
AFTER MARKET UPDATE - FRIDAY, OCTOBER 17TH, 2014
Previous After Market Report Next After Market Report >>>
|
|
|
|
DOW |
+263.17 |
16,380.41 |
+1.63% |
|
Volume |
1,045,064,470 |
+1% |
|
Volume |
2,057,687,040 |
-14% |
|
NASDAQ |
+41.05 |
4,258.44 |
+0.97% |
|
Advancers |
2,050 |
64% |
|
Advancers |
1,553 |
51% |
|
S&P 500 |
+24.00 |
1,886.76 |
+1.29% |
|
Decliners |
1,069 |
33% |
|
Decliners |
1,395 |
46% |
|
Russell 2000 |
-3.79 |
1,082.33 |
-0.35% |
|
52 Wk Highs |
43 |
|
|
52 Wk Highs |
29 |
|
|
S&P 600 |
-1.83 |
624.69 |
-0.29% |
|
52 Wk Lows |
22 |
|
|
52 Wk Lows |
32 |
|
|
 |
Major Averages Bounced But Ended Lower for Fourth Consecutive Week
Kenneth J. Gruneisen - Passed the CAN SLIM® Master's Exam
Despite Friday's gains, the major averages extended losses for a fourth consecutive week. For the week, the Dow and S&P were both down -1% and the NASDAQ declined -0.4%. The volume totals were reported mixed, higher than the prior session total on the NYSE and lower on the Nasdaq exchange. Breadth was positive as advancers led decliners by a 2-1 margin on the NYSE while advancers led decliners by only a narrow margin on the Nasdaq exchange. Leadership remained scant as there were 6 high-ranked companies from the CANSLIM.net Leaders List that made new 52-week highs and appeared on the CANSLIM.net BreakOuts Page, up from the prior session total of 3 stocks. New 52-week highs outnumbered new 52-week lows on the NYSE while new 52-week lows outnumbered new 52-week highs on the Nasdaq exchange. There were gains for all of the 5 high-ranked companies currently included on the Featured Stocks Page, a list that has waned as market conditions eroded. Distributional action raised concerns while leadership (stocks hitting new 52-week highs) waned and a deteriorating market (M criteria) environment was repeatedly noted in this commentary. New buying efforts are discouraged during market corrections while the fact-based investment system prompts disciplined investors to lean toward reducing market exposure.
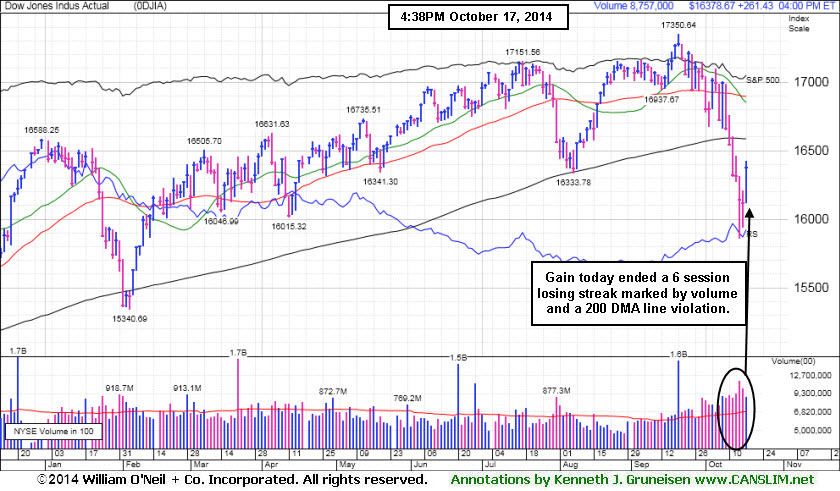
PICTURED: The Dow Jones Industrial Average rose 263 points to 16,380. The gain on Friday halted a 6-session losing streak marked by heavy volume and a 200-day moving average (DMA) line violation. A rebound above the 200 DMA line is needed for the index to be considered in "healthy" technical shape.
Stocks ended a volatile week on a positive note. The S&P 500 gained 24 points to 1,886. The NASDAQ closed 41 points higher at 4,258. The major averages stemmed its October retreat amid speculation policy makers would provide more stimulus measures to bolster global growth. Generally positive economic and corporate earnings releases also provided a lift to the market. The Commerce Department said housing starts grew +6.3% and building permits increased +1.5% in September. A preliminary survey from the University of Michigan showed consumer sentiment improved this month to its best levels in seven years.
Schlumberger (SLB +3.67%) rose as quarterly results topped estimates and said the recent decline in crude oil would not significantly impact its business. General Electric (GE +2.35%) and Morgan Stanley (MS +2.12%) rose after both posted profits ahead of forecasts. Google (GOOGL -2.60%) fell as revenues missed projections. Urban Outfitters (URBN -14.29%) following the teen retailer's cautious sales outlook.
Treasuries declined with the 10-year note down 12/32 to yield 2.20%. WTI crude oil rose 0.4% to $83.04/barrel on the NYMEX. COMEX gold futures slipped 0.2% to $1,238.30/ounce.
The CANSLIM.net Featured Stocks Page shows the most action-worthy candidates and their latest notes and a Headline Link directs members to the latest detailed analysis with data-packed graphs annotated by a Certified expert along with links to additional resources. The Premium Member Homepage includes "dynamic archives" to all prior pay reports published.
|
 Kenneth J. Gruneisen started out as a licensed stockbroker in August 1987, a couple of months prior to the historic stock market crash that took the Dow Jones Industrial Average down -22.6% in a single day. He has published daily fact-based fundamental and technical analysis on high-ranked stocks online for two decades. Through FACTBASEDINVESTING.COM, Kenneth provides educational articles, news, market commentary, and other information regarding proven investment systems that work in good times and bad.
Comments contained in the body of this report are technical opinions only and are not necessarily those of Gruneisen Growth Corp. The material herein has been obtained from sources believed to be reliable and accurate, however, its accuracy and completeness cannot be guaranteed. Our firm, employees, and customers may effect transactions, including transactions contrary to any recommendation herein, or have positions in the securities mentioned herein or options with respect thereto. Any recommendation contained in this report may not be suitable for all investors and it is not to be deemed an offer or solicitation on our part with respect to the purchase or sale of any securities. |
|
 |
Tech, Retail, and Financial Groups Bounced
Kenneth J. Gruneisen - Passed the CAN SLIM® Master's Exam
The Bank Index ($BKX +0.44%) and the Broker/Dealer Index ($XBD +0.70%) both posted modest gains and the Retail Index ($RLX +0.65%) was also a positive infuence on the major averages on Friday. The tech sector saw unanimous gains from the Semiconductor Index ($SOX +0.81%), Biotechnology Index ($BTK +0.98%), and the Networking Index ($NWX +1.69%). The Integrated Oil Index ($XOI +1.05%) posted a gain while the Oil Services Index ($OSX -0.20%) edged lower and the Gold & Silver Index ($XAU -2.80%) was a standout decliner.
Charts courtesy www.stockcharts.com
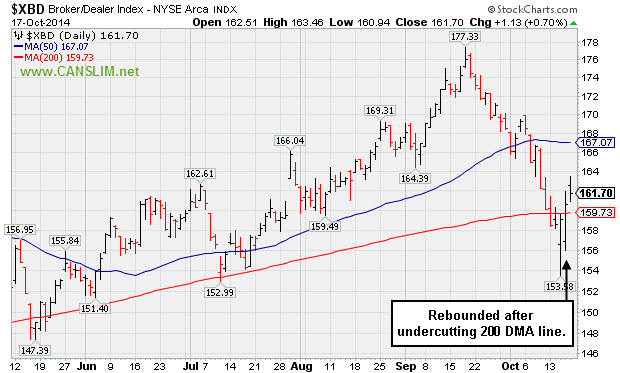
PICTURED: The Broker/Dealer Index ($XBD +0.70%) rebounded after undercutting its 200-day moving average (DMA) line this week.
| Oil Services |
$OSX |
240.16 |
-0.47 |
-0.20% |
-14.54% |
| Integrated Oil |
$XOI |
1,412.34 |
+14.67 |
+1.05% |
-6.04% |
| Semiconductor |
$SOX |
575.33 |
+4.60 |
+0.81% |
+7.53% |
| Networking |
$NWX |
294.44 |
+4.91 |
+1.69% |
-9.11% |
| Broker/Dealer |
$XBD |
161.70 |
+1.13 |
+0.70% |
+0.71% |
| Retail |
$RLX |
892.84 |
+5.75 |
+0.65% |
-5.00% |
| Gold & Silver |
$XAU |
77.08 |
-2.22 |
-2.80% |
-8.40% |
| Bank |
$BKX |
66.81 |
+0.29 |
+0.44% |
-3.54% |
| Biotech |
$BTK |
3,017.54 |
+29.27 |
+0.98% |
+29.48% |
|
|
|
 |
Perched Near High After Rebounding From 200-Day Average
Kenneth J. Gruneisen - Passed the CAN SLIM® Master's Exam
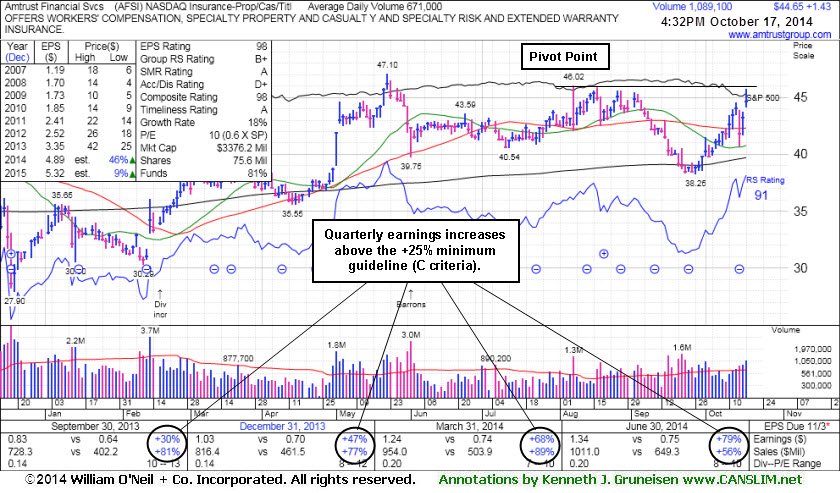
Amtrust Financial Services' (AFSI -$0.48 or -1.10% to $43.13) fundamentals remain strong (C and A criteria) and it gapped up today challenging its 52-week high and previously stubborn resistance in the $46-47 area. It was highlighted in yellow with new pivot point cited based on its 8/07/14 high in the earlier mid-day report (read here). Subsequent volume-driven gains above the pivot point may trigger a technical buy signal. Disciplined investors will note that a follow-through day from at least one of the major averages is also needed to confirm a new market rally (M criteria) before any new buying efforts may be considered under the fact-based investment system.
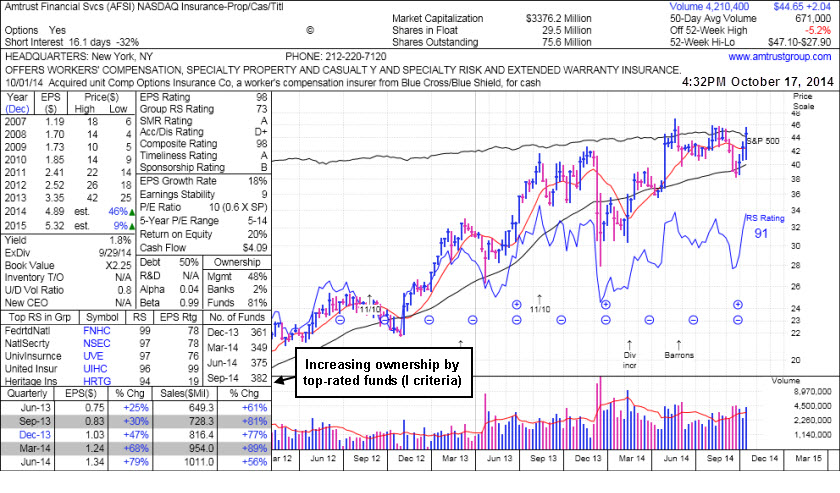
AFSI was last shown in this FSU section on 9/08/14 with detailed analysis and annotated graphs under the headline, "Distributional Action; Sub Par Relative Strength Remains Concern". It found support at its 200-day moving average (DMA) line then rebounded since dropped from the Featured Stocks list on 9/15/14. Its Relative Strength Rating is currently 91, back above the 80+ minimum guideline for buy candidates. It faces very little resistance due to overhead supply up through the $47 level.
The number of top-rated funds owning an interest rose from 349 in Mar '14 to 382 in Sep '14, a reassuring sign concerning the I criteria. The high-ranked Insurance - Property/Casualty/Title firm reported earnings +79% on +56% sales revenues for the quarter ended Jun '14 quarter versus the year ago period, its 8th consecutive comparison above the +25% minimum earnings guideline (C criteria). It has a great annual earnings (A criteria) history and it has earned an impressive 98 Earnings Per Share rating, well above the 80+ minimum rating for buy candidates.
|
|
|
Color Codes Explained :
Y - Better candidates highlighted by our
staff of experts.
G - Previously featured
in past reports as yellow but may no longer be buyable under the
guidelines.
***Last / Change / Volume data in this table is the closing quote data***
Symbol/Exchange
Company Name
Industry Group |
PRICE |
CHANGE
(%Change) |
Day High |
Volume
(% DAV)
(% 50 day avg vol) |
52 Wk Hi
% From Hi |
Featured
Date |
Price
Featured |
Pivot Featured |
|
Max Buy |
ACT
-
NYSE
Actavis plc
Medical-Generic Drugs
|
$224.73
|
+2.66
1.20% |
$229.98
|
2,345,323
103.68% of 50 DAV
50 DAV is 2,262,000
|
$249.94
-10.09%
|
6/20/2014
|
$216.53
|
PP = $230.87
|
|
MB = $242.41
|
Most Recent Note - 10/16/2014 6:27:10 PM
G - Halted its slide with a gain today after testing support at its 200 DMA line. Streak of 5 consecutive losses marked by volume triggered technical sell signals. Only a prompt rebound above its 50 DMA line would help its outlook improve.
>>> FEATURED STOCK ARTICLE : Held Ground Above Prior Highs Defining Near-Term Support - 10/8/2014
View all notes |
Set NEW NOTE alert |
CANSLIM.net Company Profile |
SEC
News |
Chart |
Request a new note
C
A N
S L
I M


|
AFSI
-
NASDAQ
Amtrust Financial Svcs
INSURANCE - Property and; Casualty Insurance
|
$44.67
|
+1.45
3.35% |
$45.75
|
1,117,810
166.59% of 50 DAV
50 DAV is 671,000
|
$47.10
-5.16%
|
10/17/2014
|
$45.24
|
PP = $46.02
|
|
MB = $48.32
|
 Most Recent Note - 10/17/2014 5:25:55 PM
Y - Fundamentals remain strong (C and A criteria) and it gapped up today challenging its 52-week high and previously stubborn resistance in the $46-47 area. Highlighted in yellow with new pivot point cited based on its 8/07/14 high in the earlier mid-day report (read here). Subsequent volume-driven gains above the pivot point may trigger a technical buy signal. See the latest FSU analysis for more details and new annotated graphs.
>>> FEATURED STOCK ARTICLE : Perched Near High After Rebounding From 200-Day Average - 10/17/2014
View all notes |
Set NEW NOTE alert |
CANSLIM.net Company Profile |
SEC
News |
Chart |
Request a new note
C
A N
S L
I M
|
FB
-
NASDAQ
Facebook Inc Cl A
INTERNET
|
$75.95
|
+3.32
4.57% |
$76.00
|
76,255,779
229.07% of 50 DAV
50 DAV is 33,290,000
|
$79.71
-4.71%
|
9/9/2014
|
$76.67
|
PP = $76.84
|
|
MB = $80.68
|
Most Recent Note - 10/17/2014 5:28:41 PM
G - Volume-driven gain today helped it rebound and close just above the 50 DMA line ($75.83) helping its outlook to improve and its color code is changed to yellow. See the latest FSU analysis for more details and annotated graphs.
>>> FEATURED STOCK ARTICLE : Volume-Driven Losses Triggered Sell Signals After Slumping Into Prior Base - 10/16/2014
View all notes |
Set NEW NOTE alert |
CANSLIM.net Company Profile |
SEC
News |
Chart |
Request a new note
C
A N
S L
I M
|
PANW
-
NYSE
Palo Alto Networks
Computer Sftwr-Security
|
$99.33
|
+1.45
1.48% |
$102.49
|
1,903,416
90.08% of 50 DAV
50 DAV is 2,113,000
|
$106.79
-6.99%
|
7/30/2014
|
$84.21
|
PP = $85.88
|
|
MB = $90.17
|
Most Recent Note - 10/16/2014 6:22:01 PM
G - Prompt rebound above the 50 DMA line helped its outlook improve. Recent low ($87.83 on 10/13/14) defines important near-term support where any subsequent violation would raise more serious concerns and trigger a more worrisome technical sell signal.
>>> FEATURED STOCK ARTICLE : Prompt Rebound Above 50-Day Average an Encouraging Sign of Support - 10/14/2014
View all notes |
Set NEW NOTE alert |
CANSLIM.net Company Profile |
SEC
News |
Chart |
Request a new note
C
A N
S L
I M
|
STRT
-
NASDAQ
Strattec Security Corp
AUTOMOTIVE - Auto Parts
|
$81.35
|
+1.04
1.29% |
$83.85
|
32,806
136.69% of 50 DAV
50 DAV is 24,000
|
$89.87
-9.48%
|
9/19/2014
|
$86.06
|
PP = $89.97
|
|
MB = $94.47
|
Most Recent Note - 10/16/2014 6:24:19 PM
Y - Rebounded above its 50 DMA line with a 3rd consecutive gain and its color code is changed to yellow. Poor market conditions (M criteria) have raised overriding concerns arguing against any new buying efforts until strength returns. Recent low ($72.13 on 10/15/14) defines important near-term support to watch. Faces near term resistance due to overhead supply up through the $89 level.
>>> FEATURED STOCK ARTICLE : Consolidating Above Prior Highs and 50-Day Moving Average Line - 9/26/2014
View all notes |
Set NEW NOTE alert |
CANSLIM.net Company Profile |
SEC
News |
Chart |
Request a new note
C
A N
S L
I M
|
Symbol/Exchange
Company Name
Industry Group |
PRICE |
CHANGE
(%Change) |
Day High |
Volume
(% DAV)
(% 50 day avg vol) |
52 Wk Hi
% From Hi |
Featured
Date |
Price
Featured |
Pivot Featured |
|
Max Buy |
|
|
|
THESE ARE NOT BUY RECOMMENDATIONS!
Comments contained in the body of this report are technical
opinions only. The material herein has been obtained
from sources believed to be reliable and accurate, however,
its accuracy and completeness cannot be guaranteed.
This site is not an investment advisor, hence it does
not endorse or recommend any securities or other investments.
Any recommendation contained in this report may not
be suitable for all investors and it is not to be deemed
an offer or solicitation on our part with respect to
the purchase or sale of any securities. All trademarks,
service marks and trade names appearing in this report
are the property of their respective owners, and are
likewise used for identification purposes only.
This report is a service available
only to active Paid Premium Members.
You may opt-out of receiving report notifications
at any time. Questions or comments may be submitted
by writing to Premium Membership Services 665 S.E. 10 Street, Suite 201 Deerfield Beach, FL 33441-5634 or by calling 1-800-965-8307
or 954-785-1121.
|
|
|

