You are not logged in.
This means you
CAN ONLY VIEW reports that were published prior to Monday, April 7, 2025.
You
MUST UPGRADE YOUR MEMBERSHIP if you want to see any current reports.
AFTER MARKET UPDATE - WEDNESDAY, OCTOBER 15TH, 2014
Previous After Market Report Next After Market Report >>>
|
|
|
|
DOW |
-173.45 |
16,141.74 |
-1.06% |
|
Volume |
1,182,221,850 |
+25% |
|
Volume |
2,814,853,800 |
+24% |
|
NASDAQ |
-11.85 |
4,215.32 |
-0.28% |
|
Advancers |
1,471 |
46% |
|
Advancers |
1,526 |
49% |
|
S&P 500 |
-15.21 |
1,862.49 |
-0.81% |
|
Decliners |
1,684 |
52% |
|
Decliners |
1,493 |
48% |
|
Russell 2000 |
+10.85 |
1,072.45 |
+1.02% |
|
52 Wk Highs |
20 |
|
|
52 Wk Highs |
25 |
|
|
S&P 600 |
+4.30 |
620.98 |
+0.70% |
|
52 Wk Lows |
618 |
|
|
52 Wk Lows |
363 |
|
|
 |
Major Averages Rebounded From Deeper Losses
Kenneth J. Gruneisen - Passed the CAN SLIM® Master's Exam
Stocks pared losses but finished firmly in negative territory on Wednesday. The volume totals were reported higher than the prior session totals on the NYSE and on the Nasdaq exchange, a sign of heavier selling from the institutional crowd. Decliners led advancers by an 8-7 margin on the NYSE while advancers narrowly led decliners on the Nasdaq exchange. There were 5 high-ranked companies from the CANSLIM.net Leaders List that made new 52-week highs and appeared on the CANSLIM.net BreakOuts Page, down from the prior session total of 12 stocks. The new 52-week lows list expanded and solidly outnumbered new 52-week highs on the NYSE and on the Nasdaq exchange. There were gains for 2 of the 4 high-ranked companies currently included on the Featured Stocks Page, a list that has waned as market conditions eroded. Distributional action raised concerns while leadership (stocks hitting new 52-week highs) waned and a deteriorating market (M criteria) environment was repeatedly noted in this commentary. New buying efforts are discouraged during market corrections while the fact-based investment system prompts disciplined investors to lean toward reducing market exposure.
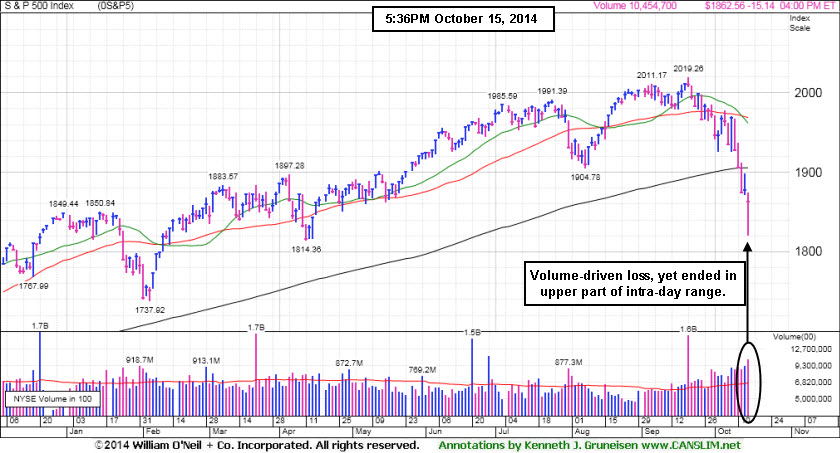
PICTURED: The S&P 500 Index rebounded from a 57 point decline to end the session off 15 points at 1,862, closing in the upper third of its intra-day range.
The Dow, which dropped as much as 460 points, closed down 173 at 16,141. The NASDAQ Composite recovered from a 111 point loss to finish 12 points lower at 4,215.
The major averages extended their October retreat amid continued global growth concerns. Updates on the U.S. economy failed to buffer the market pullback. Retail sales fell 0.3% in September more than a forecasted 0.1% decline. Additional reports revealed wholesale prices edged down 0.1% and business inventories increased 0.2% last month. The Fed's Beige Book report said the U.S. economy is expanding at a "modest to moderate" pace.
Eight of 10 sectors in the S&P 500 were down with financials pacing the decline. Bank of America (BAC -4.6%) and KeyCorp (KEY -5.8%) tumbled after both reported a disappointing quarterly results. Materials and energy recovered to finish up on the session with CONSOL Energy (CNX +3.8%) and Halliburton (HAL +2%) among the gainers.
Treasuries pared a rally that briefly pushed the yield on the 10-year note below 2% before finishing up 16/32 to yield 2.14%. In commodity trading, WTI crude oil was down 0.2% to $81.68/barrel on the NYMEX. COMEX gold futures advanced 0.9% to $1244.10/ounce.
The CANSLIM.net Featured Stocks Page shows the most action-worthy candidates and their latest notes and a Headline Link directs members to the latest detailed analysis with data-packed graphs annotated by a Certified expert along with links to additional resources. The Premium Member Homepage includes "dynamic archives" to all prior pay reports published.
|
 Kenneth J. Gruneisen started out as a licensed stockbroker in August 1987, a couple of months prior to the historic stock market crash that took the Dow Jones Industrial Average down -22.6% in a single day. He has published daily fact-based fundamental and technical analysis on high-ranked stocks online for two decades. Through FACTBASEDINVESTING.COM, Kenneth provides educational articles, news, market commentary, and other information regarding proven investment systems that work in good times and bad.
Comments contained in the body of this report are technical opinions only and are not necessarily those of Gruneisen Growth Corp. The material herein has been obtained from sources believed to be reliable and accurate, however, its accuracy and completeness cannot be guaranteed. Our firm, employees, and customers may effect transactions, including transactions contrary to any recommendation herein, or have positions in the securities mentioned herein or options with respect thereto. Any recommendation contained in this report may not be suitable for all investors and it is not to be deemed an offer or solicitation on our part with respect to the purchase or sale of any securities. |
|
 |
Bank and Retail Indexes Weighed on Market
Kenneth J. Gruneisen - Passed the CAN SLIM® Master's Exam
The Bank Index ($BKX -3.34%) led the market's retreat while the Broker/Dealer Index ($XBD +0.30%) eked out a small gain. The Retail Index ($RLX -1.00%) was also a negative influence on the major averages. The Oil Services Index ($OSX +2.08%) tallied a solid gain while the Integrated Oil Index ($XOI -0.59%) edged lower. The Networking Index ($NWX +1.04%) led the tech sector's bounce while the Semiconductor Index ($SOX +0.48%), Biotechnology Index ($BTK +0.57%). The Gold & Silver Index ($XAU -0.06%) finished flat.
Charts courtesy www.stockcharts.com
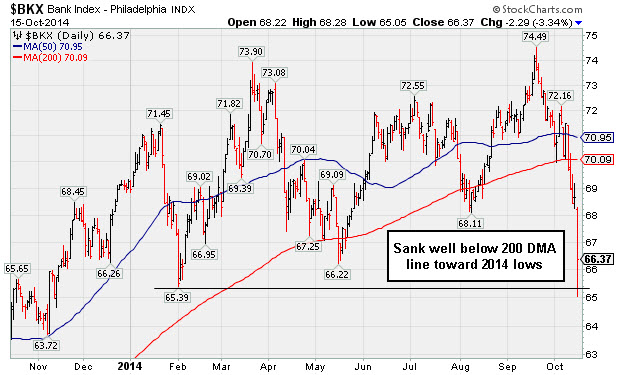
PICTURED: The Bank Index ($BKX -3.34%) sank well below its 200-day moving average (DMA) line toward 2014 lows. Longtime readers know that the major averages have historically been prone to their most severe downdrafts when financial stocks were weak. Weak action in the financial indexes is considered a negative "leading indicator" for the broader market.
| Oil Services |
$OSX |
237.78 |
+4.85 |
+2.08% |
-15.39% |
| Integrated Oil |
$XOI |
1,376.50 |
-8.21 |
-0.59% |
-8.43% |
| Semiconductor |
$SOX |
562.34 |
+2.67 |
+0.48% |
+5.10% |
| Networking |
$NWX |
290.88 |
+3.01 |
+1.04% |
-10.20% |
| Broker/Dealer |
$XBD |
159.09 |
+0.48 |
+0.30% |
-0.91% |
| Retail |
$RLX |
891.35 |
-9.04 |
-1.00% |
-5.16% |
| Gold & Silver |
$XAU |
79.22 |
-0.05 |
-0.06% |
-5.86% |
| Bank |
$BKX |
66.37 |
-2.29 |
-3.34% |
-4.17% |
| Biotech |
$BTK |
2,948.29 |
+16.68 |
+0.57% |
+26.51% |
|
|
|
 |
Submit Your Request for a Featured Stock Update
Kenneth J. Gruneisen - Passed the CAN SLIM® Master's Exam
There are few stocks currently included on the Featured Stocks list and none of the companies need additional review in detail with annotated graphs. At times like these we have an opportunity to look back and review previously featured stocks which were dropped. This can serve as an educational review of the investment system's tactics and a reminder that even high-ranked leaders eventually fall out of favor. If you wish to request for a specific stock to receive more detailed coverage in this section please use the inquiry form to submit your request. Thank you! |
|
|
Color Codes Explained :
Y - Better candidates highlighted by our
staff of experts.
G - Previously featured
in past reports as yellow but may no longer be buyable under the
guidelines.
***Last / Change / Volume data in this table is the closing quote data***
Symbol/Exchange
Company Name
Industry Group |
PRICE |
CHANGE
(%Change) |
Day High |
Volume
(% DAV)
(% 50 day avg vol) |
52 Wk Hi
% From Hi |
Featured
Date |
Price
Featured |
Pivot Featured |
|
Max Buy |
ACT
-
NYSE
Actavis plc
Medical-Generic Drugs
|
$217.24
|
-4.83
-2.17% |
$221.11
|
5,092,335
218.18% of 50 DAV
50 DAV is 2,334,000
|
$249.94
-13.08%
|
6/20/2014
|
$216.53
|
PP = $230.87
|
|
MB = $242.41
|
Most Recent Note - 10/14/2014 11:59:18 AM
G - Rebounded from early lows today after nearly testing support at its 200 DMA line. On the prior session it violated its 50 DMA line and prior highs near $230 triggering technical sell signals with a damaging loss on higher volume. Only a prompt rebound above its 50 DMA line would help its outlook improve.
>>> FEATURED STOCK ARTICLE : Held Ground Above Prior Highs Defining Near-Term Support - 10/8/2014
View all notes |
Set NEW NOTE alert |
CANSLIM.net Company Profile |
SEC
News |
Chart |
Request a new note
C
A N
S L
I M


|
FB
-
NASDAQ
Facebook Inc Cl A
INTERNET
|
$73.21
|
-0.38
-0.52% |
$73.80
|
61,423,003
190.12% of 50 DAV
50 DAV is 32,308,000
|
$79.71
-8.15%
|
9/9/2014
|
$76.67
|
PP = $76.84
|
|
MB = $80.68
|
 Most Recent Note - 10/15/2014 12:15:16 PM
G - Slumping further below its 50 DMA line after undercutting prior lows ($73.07 on 9/16/14) raising concerns and triggering a technical sell signal. Only a prompt rebound above the 50 DMA line would help its outlook improve.
>>> FEATURED STOCK ARTICLE : Fell Toward 50-day Moving Average; Recent Gains Lacked Great Volume - 9/25/2014
View all notes |
Set NEW NOTE alert |
CANSLIM.net Company Profile |
SEC
News |
Chart |
Request a new note
C
A N
S L
I M
|
PANW
-
NYSE
Palo Alto Networks
Computer Sftwr-Security
|
$97.43
|
+3.18
3.37% |
$98.65
|
2,924,110
143.90% of 50 DAV
50 DAV is 2,032,000
|
$106.79
-8.76%
|
7/30/2014
|
$84.21
|
PP = $85.88
|
|
MB = $90.17
|
Most Recent Note - 10/15/2014 6:10:03 PM
G - Today's gain on higher volume followed a prompt rebound above the 50 DMA line which helped its outlook improve. The recent low ($87.83 on 10/13/14) defines important near-term support where any subsequent violation would raise more serious concerns and trigger a more worrisome technical sell signal.
>>> FEATURED STOCK ARTICLE : Prompt Rebound Above 50-Day Average an Encouraging Sign of Support - 10/14/2014
View all notes |
Set NEW NOTE alert |
CANSLIM.net Company Profile |
SEC
News |
Chart |
Request a new note
C
A N
S L
I M
|
STRT
-
NASDAQ
Strattec Security Corp
AUTOMOTIVE - Auto Parts
|
$78.57
|
+0.22
0.28% |
$79.18
|
14,603
60.85% of 50 DAV
50 DAV is 24,000
|
$89.87
-12.58%
|
9/19/2014
|
$86.06
|
PP = $89.97
|
|
MB = $94.47
|
Most Recent Note - 10/13/2014 5:54:43 PM
G - Finished in the upper half of its intra-day range today but slumped below its 50 DMA line raising concerns and its color code is changed to green. Poor market conditions (M criteria) have raised overriding concerns arguing against any new buying efforts until strength returns. Faces near term resistance due to overhead supply up through the $89 level.
>>> FEATURED STOCK ARTICLE : Consolidating Above Prior Highs and 50-Day Moving Average Line - 9/26/2014
View all notes |
Set NEW NOTE alert |
CANSLIM.net Company Profile |
SEC
News |
Chart |
Request a new note
C
A N
S L
I M
|
|
|
|
THESE ARE NOT BUY RECOMMENDATIONS!
Comments contained in the body of this report are technical
opinions only. The material herein has been obtained
from sources believed to be reliable and accurate, however,
its accuracy and completeness cannot be guaranteed.
This site is not an investment advisor, hence it does
not endorse or recommend any securities or other investments.
Any recommendation contained in this report may not
be suitable for all investors and it is not to be deemed
an offer or solicitation on our part with respect to
the purchase or sale of any securities. All trademarks,
service marks and trade names appearing in this report
are the property of their respective owners, and are
likewise used for identification purposes only.
This report is a service available
only to active Paid Premium Members.
You may opt-out of receiving report notifications
at any time. Questions or comments may be submitted
by writing to Premium Membership Services 665 S.E. 10 Street, Suite 201 Deerfield Beach, FL 33441-5634 or by calling 1-800-965-8307
or 954-785-1121.
|
|
|

