You are not logged in.
This means you
CAN ONLY VIEW reports that were published prior to Tuesday, February 27, 2024.
You
MUST UPGRADE YOUR MEMBERSHIP if you want to see any current reports.
AFTER MARKET UPDATE - MONDAY, OCTOBER 12TH, 2020
Previous After Market Report Next After Market Report >>>
|
|
|
|
DOW |
+250.62 |
28,837.52 |
+0.88% |
|
Volume |
746,848,910 |
-12% |
|
Volume |
3,838,784,500 |
+11% |
|
NASDAQ |
+296.56 |
11,876.51 |
+2.56% |
|
Advancers |
1,821 |
61% |
|
Advancers |
1,957 |
59% |
|
S&P 500 |
+57.09 |
3,534.22 |
+1.64% |
|
Decliners |
1,176 |
39% |
|
Decliners |
1,337 |
41% |
|
Russell 2000 |
+11.51 |
1,649.05 |
+0.70% |
|
52 Wk Highs |
190 |
|
|
52 Wk Highs |
245 |
|
|
S&P 600 |
+6.59 |
932.78 |
+0.71% |
|
52 Wk Lows |
14 |
|
|
52 Wk Lows |
22 |
|
|
The major indices have shown improvement and have resumed a market uptrend as leadership has improved. Disciplined investors carefully may buy leading stocks on a case-by-case basis. Always remain ready to reduce market exposure in the event of any more substantial market downdrafts.
|
 |
Major Indices Rose With Even Greater Leadership
Kenneth J. Gruneisen - Passed the CAN SLIM® Master's Exam
The S&P 500 rose 1.6% after capping its best week in more than three months on Friday. The Dow added 250 points, while Nasdaq Composite was up 2.6%. The reported volume totals were mixed, lighter than the prior session on the NYSE and higher on the Nasdaq exchange. Breadth was positive as advancers led decliners by a 3-2 margin on the NYSE and on the Nasdaq exchange. There were 119 high-ranked companies from the Leaders List that hit new 52-week highs and were listed on the BreakOuts Page, versus the total of 106 on the prior session. New 52-week highs totals expanded again and easily outnumbered new 52-week lows totals on the NYSE and on the Nasdaq exchange. The major indices are in a confirmed uptrend (M criteria). New buying efforts may be justified in leading stocks on a case-by-case basis.
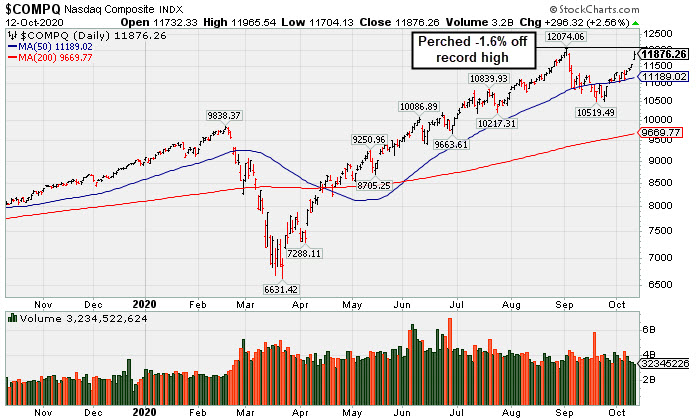 PICTURED: The Nasdaq Composite Index is -1.6% off its record high.
Stocks advanced on Monday, with the major averages touching their highest levels in six weeks. The Nasdaq 100 spiked 3.1%, its best day since April, amid strength in Tech-focused mega-cap shares. Also providing a tailwind to risk assets was optimism around additional fiscal stimulus, even if another package gets passed after the November 3 U.S. presidential election.
Ten of 11 S&P 500 sectors closed in positive territory, with the Technology and Communication Services groups pacing gains. Apple (AAPL +6.37%) rose ahead of its iPhone launch event on Tuesday, while Amazon (AMZN +4.75%) rose ahead of its annual Prime Day. Elsewhere, Twitter (TWTR +5.12%) rose to new multi-year highs on the heels of an analyst upgrade. In M&A news, Twilio (TWLO +7.67%) rose to a record high after announcing it would acquire privately-held customer data management company Segment in a $3.2 billion stock deal.
U.S. bond markets are closed in observance of Columbus Day, with the yield on the 10-year note ending last week at 0.77%. In the commodity pits, WTI crude slid nearly 3%, back below $40.00/barrel as output concerns faded.
This week, all eyes will be on the unofficial start to third-quarter earnings season with some Wall Street’s largest financial institutions posting profit tallies starting Tuesday. Overall, analysts are anticipating a 21% drop in S&P 500 earnings compared to a year earlier during the July-September period, according to Refinitiv data. This would be an improvement from the 32% fall reported for the second quarter. |
 Kenneth J. Gruneisen started out as a licensed stockbroker in August 1987, a couple of months prior to the historic stock market crash that took the Dow Jones Industrial Average down -22.6% in a single day. He has published daily fact-based fundamental and technical analysis on high-ranked stocks online for two decades. Through FACTBASEDINVESTING.COM, Kenneth provides educational articles, news, market commentary, and other information regarding proven investment systems that work in good times and bad.
Comments contained in the body of this report are technical opinions only and are not necessarily those of Gruneisen Growth Corp. The material herein has been obtained from sources believed to be reliable and accurate, however, its accuracy and completeness cannot be guaranteed. Our firm, employees, and customers may effect transactions, including transactions contrary to any recommendation herein, or have positions in the securities mentioned herein or options with respect thereto. Any recommendation contained in this report may not be suitable for all investors and it is not to be deemed an offer or solicitation on our part with respect to the purchase or sale of any securities. |
|
 |
Retail, Financial, and Semiconductor Indexes Rose
Kenneth J. Gruneisen - Passed the CAN SLIM® Master's Exam
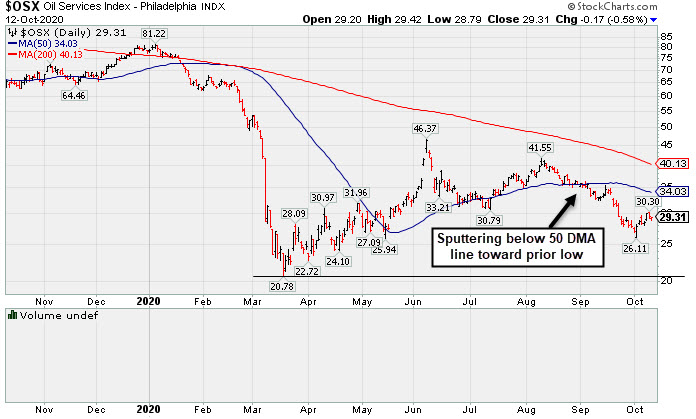
The Retail Index ($RLX +2.88%) posted a solid gain and the Broker/Dealer Index ($XBD +1.82%) and Bank Index ($BKX +1.21%) both posted solid gains. The Semiconductor Index ($SOX +1.48%) led the tech sector while the Biotech Index ($BTK +0.46%) posted a smaller gain and the Networking Index ($NWX +0.03%) finished flat. Energy-linked groups were mixed as the Oil Services Index ($OSX -0.58%) edged lower and the Integrated Oil Index ($XOI +0.38%) edged higher. The Gold & Silver Index ($XAU -0.11%) finished flat. PICTURED: The Oil Services Index ($OSX -0.58%) has been sputtering below its 50-day moving average (DMA) line toward the March low.
| Oil Services |
$OSX |
29.31 |
-0.17 |
-0.58% |
-62.56% |
| Integrated Oil |
$XOI |
624.10 |
+2.37 |
+0.38% |
-50.88% |
| Semiconductor |
$SOX |
2,433.48 |
+35.44 |
+1.48% |
+31.57% |
| Networking |
$NWX |
572.26 |
+0.20 |
+0.03% |
-1.91% |
| Broker/Dealer |
$XBD |
301.86 |
+5.40 |
+1.82% |
+3.95% |
| Retail |
$RLX |
3,650.49 |
+102.23 |
+2.88% |
+49.04% |
| Gold & Silver |
$XAU |
149.86 |
-0.16 |
-0.11% |
+40.16% |
| Bank |
$BKX |
80.51 |
+0.96 |
+1.21% |
-28.98% |
| Biotech |
$BTK |
5,611.11 |
+25.48 |
+0.46% |
+10.73% |
|
|
|
 |
TEAM Perched Within Close Striking Distance of New Highs
Kenneth J. Gruneisen - Passed the CAN SLIM® Master's Exam
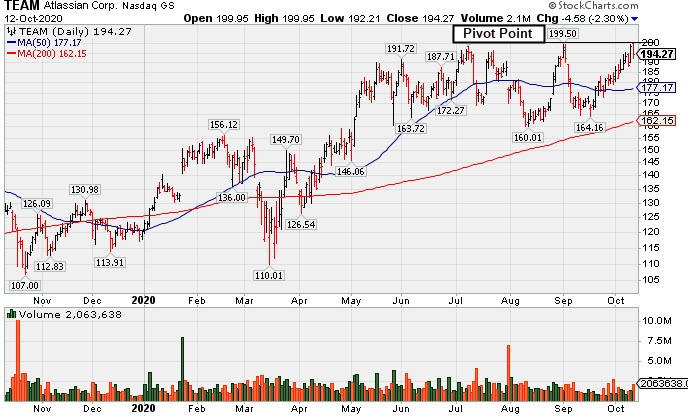
Atlassian Corp (TEAM -$4.58 or -2.30% to $194.27) was highlighted in yellow with new pivot point cited based on its 9/01/20 high plus 10 cents in the earlier mid-day report (read here). It pulled back today after it was perched within close striking distance of its 52-week high. It has recently been wedging higher with gains lacking great volume conviction. Subsequent gains above the pivot point backed by at least +40% above average volume may trigger a new technical buy signal. Its Relative Strength Rating has improved to 84, above the 80+ minimum guideline for buy candidates. Three of the past 4 quarterly comparisons through Jun '20 were at or above the +25% minimum earnings guideline (C criteria). It was dropped from the Featured Stocks list on 8/07/20 and found support well above its 200 DMA line during recent consolidations.
TEAM has a 98 Earnings Per Share rating, but fundamental concerns were raised after it reported earnings +19% on +33% sales revenues for the Mar '20 quarter, breaking a strong track record of +25% earnings increases (C criteria). This Australia - based software developer had shown 9 consecutive quarterly comparisons above the +25% minimum guideline (C criteria). Its annual earnings (A criteria) history has been strong since its $21 IPO on 12/10/15.
TEAM was last shown in the FSU section on 7/24/20 with an annotated graph under the headline, "Consolidating Near High With Earnings News Due Soon" . The number of top-rated funds owning its shares rose from 266 in Sep '17 to 835 in Jun '20, a reassuring sign concerning the I criteria. It has a Timeliness Rating of B and Sponsorship Rating of A. Its current Up/Down Volume Ratio of 0.8 is an unbiased indication its shares have been under some distributional pressure over the past 50 days. |
|
|
Color Codes Explained :
Y - Better candidates highlighted by our
staff of experts.
G - Previously featured
in past reports as yellow but may no longer be buyable under the
guidelines.
***Last / Change / Volume data in this table is the closing quote data***
Symbol/Exchange
Company Name
Industry Group |
PRICE |
CHANGE
(%Change) |
Day High |
Volume
(% DAV)
(% 50 day avg vol) |
52 Wk Hi
% From Hi |
Featured
Date |
Price
Featured |
Pivot Featured |
|
Max Buy |
 ADBE
-
NASDAQ
ADBE
-
NASDAQ
Adobe Inc
COMPUTER SOFTWARE and SERVICES - Application Software
|
$510.89
|
+8.73
1.74% |
$516.00
|
3,134,123
100.52% of 50 DAV
50 DAV is 3,118,000
|
$536.88
-4.84%
|
9/10/2020
|
$488.46
|
PP = $536.88
|
|
MB = $563.72
|
 Most Recent Note - 10/12/2020 5:35:42 PM
G - Posted a solid gain today with higher (near average) volume. Subsequent losses below the 50 DMA line ($479.59) would raise great concerns and trigger a technical sell signal. Faces near-term resistance due to overhead supply up to the $536 level. Fundamentals remain strong.
>>> FEATURED STOCK ARTICLE : Showed Resilience Near 50-Day Moving Average - 10/8/2020 |
View all notes |
Set NEW NOTE alert |
Company Profile |
SEC
News |
Chart |
Request a new note
C
A
S
I |
CRL
-
NYSE
Charles River Labs Intl
DRUGS - Biotechnology
|
$243.27
|
+0.70
0.29% |
$244.99
|
391,773
121.67% of 50 DAV
50 DAV is 322,000
|
$243.46
-0.08%
|
7/15/2020
|
$192.66
|
PP = $189.95
|
|
MB = $199.45
|
Most Recent Note - 10/9/2020 6:06:29 PM
G - Posted a big gain with +22% above average volume today for a new all-time high. Its 50 DMA line ($218) defines support where any subsequent violation would raise concerns and trigger a technical sell signal. Raised fundamental concerns when it recently reported Jun '20 quarterly earnings -3% on +4% sales revenues, below the +25% minimum guideline (C criteria). See the latest FSU analysis for more details and a new annotated graph.
>>> FEATURED STOCK ARTICLE : New Record High for Charles River Labs - 10/9/2020 |
View all notes |
Set NEW NOTE alert |
Company Profile |
SEC
News |
Chart |
Request a new note
C
A
S
I |
AMD
-
NASDAQ
Advanced Micro Devices
ELECTRONICS - Semiconductor - Broad Line
|
$84.29
|
+1.19
1.43% |
$85.13
|
47,536,166
83.59% of 50 DAV
50 DAV is 56,867,000
|
$94.28
-10.60%
|
8/31/2020
|
$90.42
|
PP = $87.39
|
|
MB = $91.76
|
Most Recent Note - 10/9/2020 6:08:45 PM
G - Pulled back today with above average volume as the company reportedly was considering buying Xilinx Inc (XLNX). Recently found support near its 50 DMA line ($81.96). Any deterioration below the 50 DMA line and the recent low ($73.85 on 9/18/20) would raise greater concerns and trigger more worrisome technical sell signals. It has not formed a sound base of sufficient length and faces some resistance due to overhead supply up to the $94 level. Fundamentals remain strong.
>>> FEATURED STOCK ARTICLE : Rebound Above 50-Day Average With Light Volume Helped Stance - 9/28/2020 |
View all notes |
Set NEW NOTE alert |
Company Profile |
SEC
News |
Chart |
Request a new note
C
A
S
I |
TREX
-
NYSE
Trex Company Inc
MATERIALS and CONSTRUCTION - General Building Materials
|
$79.65
|
+1.43
1.83% |
$79.99
|
398,710
42.28% of 50 DAV
50 DAV is 943,000
|
$79.19
0.58%
|
6/26/2020
|
$54.53
|
PP = $66.47
|
|
MB = $69.79
|
Most Recent Note - 10/9/2020 6:13:12 PM
G - Posted a gain today with below average volume for a new all-time high, however it did not form a sound base pattern. Any losses below the 50 DMA line ($71.53) or recent low ($63.32 on 9/21/20) would raise concerns and trigger technical sell signals. Do not be confused by the 2:1 share split effective 9/15/20 (Featured Price, Pivot Point, and Max Buy prices have been adjusted accordingly). Fundamentals remain strong.
>>> FEATURED STOCK ARTICLE : TREX Rebounded Above 50-Day Moving Average - 9/30/2020 |
View all notes |
Set NEW NOTE alert |
Company Profile |
SEC
News |
Chart |
Request a new note
C
A
S
I |
NFLX
-
NASDAQ
Netflix Inc
SPECIALTY RETAIL - Music and Video Stores
|
$539.81
|
+0.37
0.07% |
$551.81
|
5,362,993
95.21% of 50 DAV
50 DAV is 5,633,000
|
$575.37
-6.18%
|
9/1/2020
|
$547.45
|
PP = $575.47
|
|
MB = $604.24
|
Most Recent Note - 10/12/2020 5:33:31 PM
G - Recently rebounded near its prior high ($557 on 9/01/20) which may act as resistance. Its 50 DMA line ($501) and recent low ($458.60 on 9/18/20) define important near term support where any further deterioration would raise more serious concerns and trigger technical sell signals.
>>> FEATURED STOCK ARTICLE : Quiet Rebound Meeting Resistance at 50-Day Moving Average - 9/29/2020 |
View all notes |
Set NEW NOTE alert |
Company Profile |
SEC
News |
Chart |
Request a new note
C
A
S
I |
Symbol/Exchange
Company Name
Industry Group |
PRICE |
CHANGE
(%Change) |
Day High |
Volume
(% DAV)
(% 50 day avg vol) |
52 Wk Hi
% From Hi |
Featured
Date |
Price
Featured |
Pivot Featured |
|
Max Buy |
LGIH
-
NASDAQ
L G I Homes Inc
Bldg-Resident/Comml
|
$127.83
|
+1.57
1.24% |
$128.67
|
148,564
50.53% of 50 DAV
50 DAV is 294,000
|
$131.95
-3.12%
|
10/1/2020
|
$123.17
|
PP = $124.04
|
|
MB = $130.24
|
Most Recent Note - 10/12/2020 5:31:53 PM
Y - Posted another small gain today with light volume for a best-ever close. Color code was recently changed to yellow with new pivot point cited based on its 8/04/20 high plus 10 cents. Subsequent gains above the pivot point backed by at least +40% above average volume are still needed to clinch a proper new (or add-on) technical buy signal. The 50 DMA line ($114.67) and latest low ($101.30 on 9/21/20) define near-term support. Reported Jun '20 quarterly earnings +21% on +4% sales revenues, breaking a streak of 4 comparisons above the +25% minimum guideline (C criteria).
>>> FEATURED STOCK ARTICLE : New Base Formed by Strong Homebuilder - 10/1/2020 |
View all notes |
Set NEW NOTE alert |
Company Profile |
SEC
News |
Chart |
Request a new note
C
A
S
I |
NOW
-
NYSE
Servicenow Inc
Computer Sftwr-Enterprse
|
$509.09
|
+0.48
0.09% |
$515.55
|
892,663
58.46% of 50 DAV
50 DAV is 1,527,000
|
$510.88
-0.35%
|
8/20/2020
|
$453.34
|
PP = $454.79
|
|
MB = $477.53
|
Most Recent Note - 10/9/2020 6:10:11 PM
G - Posted a gain today with below average volume for another new all-time high. Found support at its 50 DMA line ($462.51) but did not form a new base of sufficient length. Fundamentals remain strong. Any losses below the 50 DMA line and prior low ($432.85 on 9/08/20) would raise concerns and trigger technical sell signals.
>>> FEATURED STOCK ARTICLE : Gain Back Above "Max Buy" Level for ServiceNow - 9/25/2020 |
View all notes |
Set NEW NOTE alert |
Company Profile |
SEC
News |
Chart |
Request a new note
C
A
S
I |
VEEV
-
NYSE
Veeva Systems Inc Cl A
Computer Sftwr-Medical
|
$307.16
|
+13.04
4.43% |
$308.75
|
1,160,362
148.57% of 50 DAV
50 DAV is 781,000
|
$298.76
2.81%
|
10/6/2020
|
$287.71
|
PP = $298.86
|
|
MB = $313.80
|
Most Recent Note - 10/12/2020 12:38:59 PM
Y - Gapped up today hitting a new all-time high. Found support at its 50 DMA line ($272) while forming a 5-week flat base. It was highlighted in yellow again in the 10/06/20 mid-day report with a new pivot point cited based on its 9/02/20 high plus 10 cents when noted - "Subsequent gains above the pivot point backed by at least +40% above average volume may trigger a technical buy signal. Any losses below the 50 DMA line and recent lows would raise concerns and trigger technical sell signals. Reported earnings +31% on +33% sales revenues for the Jul '20 quarter versus the year ago period. Three of the past 4 quarterly comparisons were above the +25% minimum earnings guideline (C criteria)."
>>> FEATURED STOCK ARTICLE : First Sound Base Being Built After Considerable Rally - 10/6/2020 |
View all notes |
Set NEW NOTE alert |
Company Profile |
SEC
News |
Chart |
Request a new note
C
A
S
I |
TEAM
-
NASDAQ
Atlassian Corp Plc Cl A
Comp Sftwr-Spec Enterprs
|
$194.27
|
-4.58
-2.30% |
$199.95
|
2,061,984
125.50% of 50 DAV
50 DAV is 1,643,000
|
$199.87
-2.80%
|
10/12/2020
|
$193.77
|
PP = $199.60
|
|
MB = $209.58
|
Most Recent Note - 10/12/2020 5:37:29 PM
Y - Highlighted in yellow with new pivot point cited based on its 9/01/20 high plus 10 cents. Pulled back today with higher volume. It was perched within close striking distance of its 52-week high after recently wedging higher with gains lacking great volume conviction. Subsequent gains above the pivot point backed by at least +40% above average volume may trigger a new technical buy signal. Its Relative Strength Rating has improved to 84, above the 80+ minimum guideline for buy candidates. Three of the past 4 quarterly comparisons through Jun '20 were at or above the +25% minimum earnings guideline (C criteria). It was dropped from the Featured Stocks list on 8/07/20 and found support well above its 200 DMA line during recent consolidations. See the latest FSU analysis for more details and a new annotated graph.
>>> FEATURED STOCK ARTICLE : TEAM Perched Within Close Striking Distance of New Highs - 10/12/2020 |
View all notes |
Set NEW NOTE alert |
Company Profile |
SEC
News |
Chart |
Request a new note
C
A
S
I |
|
|
|
THESE ARE NOT BUY RECOMMENDATIONS!
Comments contained in the body of this report are technical
opinions only. The material herein has been obtained
from sources believed to be reliable and accurate, however,
its accuracy and completeness cannot be guaranteed.
This site is not an investment advisor, hence it does
not endorse or recommend any securities or other investments.
Any recommendation contained in this report may not
be suitable for all investors and it is not to be deemed
an offer or solicitation on our part with respect to
the purchase or sale of any securities. All trademarks,
service marks and trade names appearing in this report
are the property of their respective owners, and are
likewise used for identification purposes only.
This report is a service available
only to active Paid Premium Members.
You may opt-out of receiving report notifications
at any time. Questions or comments may be submitted
by writing to Premium Membership Services 665 S.E. 10 Street, Suite 201 Deerfield Beach, FL 33441-5634 or by calling 1-800-965-8307
or 954-785-1121.
|
|
|