You are not logged in.
This means you
CAN ONLY VIEW reports that were published prior to Monday, April 14, 2025.
You
MUST UPGRADE YOUR MEMBERSHIP if you want to see any current reports.
AFTER MARKET UPDATE - THURSDAY, OCTOBER 9TH, 2014
Previous After Market Report Next After Market Report >>>
|
|
|
|
DOW |
-334.97 |
16,659.25 |
-1.97% |
|
Volume |
874,039,880 |
-3% |
|
Volume |
2,088,835,090 |
-9% |
|
NASDAQ |
-90.25 |
4,378.34 |
-2.02% |
|
Advancers |
365 |
11% |
|
Advancers |
393 |
13% |
|
S&P 500 |
-40.68 |
1,928.21 |
-2.07% |
|
Decliners |
2,750 |
86% |
|
Decliners |
2,618 |
85% |
|
Russell 2000 |
-29.13 |
1,067.99 |
-2.66% |
|
52 Wk Highs |
45 |
|
|
52 Wk Highs |
27 |
|
|
S&P 600 |
-14.83 |
617.50 |
-2.35% |
|
52 Wk Lows |
237 |
|
|
52 Wk Lows |
217 |
|
|
 |
Breadth Negative Behind Losses Thoroughly Erasing Prior Gains
Kenneth J. Gruneisen - Passed the CAN SLIM® Master's Exam
Large losses on Thursday thoroughly erased the prior session's big gains and the major averages finished near their session lows. The Dow dropped 334 points to 16,659 following its biggest one-day gain of 2014. The S&P 500 declined 40 points to 1,928. The NASDAQ fell 90 points to 4,378. The volume totals were reported lighter than the prior session totals on the NYSE and on the Nasdaq exchange, a sign of weaker selling efforts from the institutional crowd. Breadth was solidly negative as decliners led advancers by more than a 7-1 margin on the NYSE and by more than a 6-1 margin on the Nasdaq exchange. There were 15 high-ranked companies from the CANSLIM.net Leaders List that made new 52-week highs and appeared on the CANSLIM.net BreakOuts Page, up from the prior session total of 12 stocks. The new 52-week lows list contracted but still solidly outnumbered new 52-week highs on the NYSE and on the Nasdaq exchange. There was only one gainer among the 6 high-ranked companies currently included on the Featured Stocks Page. Distributional action raised concerns while leadership (stocks hitting new 52-week highs) waned and a deteriorating market (M criteria) environment was repeatedly noted in this commentary. New buying efforts are discouraged during market corrections while the fact-based investment system prompts disciplined investors to lean toward reducing market exposure.
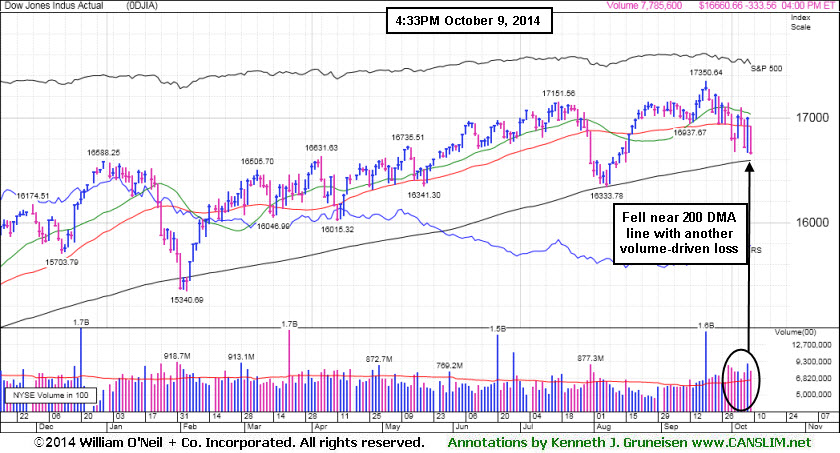
PICTURED: The Dow Jones Industrial Average fell near its 200-day moving average (DMA) line with yet another damaging loss in a recent spurt of losses backed by above average volume.
All 10 sectors in the S&P 500 declined. Energy paced the retreat as WTI crude fell to a 22-month low. Exxon Mobil (XOM -2.95%) and Anadarko Petroleum (APC -6.18%) both fell. Large losses in materials and industrials also weighed on the market as Dow Chemical (DOW -3.54%) and General Electric (GE -1.86%) both slumped. REITs were one of the only bright spots as Ventas (VTR +1.5%) and Vornado Realty Trust (VNO +1.3%) both rose.
Fed speak garnered some attention. St. Louis Fed President James Bullard said he is concerned about the disconnect between the stock market and the central bank's expectations for when rates may increase. In addition, Richmond Fed President Jeffrey Lacker said he sees no sign of inflation estimates moving away from the central bank's 2% target.
Today’s economic data was overlooked. Jobless claims unexpectedly fell by 1,000 to 287,000 and wholesale inventories rose by the most since April.
Treasuries declined and a government auction of 30-year bonds drew below-average demand. The 10-year note fell 3/32 to yield 2.33%. The 30-year bond declined 6/32 to yield 3.07%.
The CANSLIM.net Featured Stocks Page shows the most action-worthy candidates and their latest notes and a Headline Link directs members to the latest detailed analysis with data-packed graphs annotated by a Certified expert along with links to additional resources. The Premium Member Homepage includes "dynamic archives" to all prior pay reports published.
|
 Kenneth J. Gruneisen started out as a licensed stockbroker in August 1987, a couple of months prior to the historic stock market crash that took the Dow Jones Industrial Average down -22.6% in a single day. He has published daily fact-based fundamental and technical analysis on high-ranked stocks online for two decades. Through FACTBASEDINVESTING.COM, Kenneth provides educational articles, news, market commentary, and other information regarding proven investment systems that work in good times and bad.
Comments contained in the body of this report are technical opinions only and are not necessarily those of Gruneisen Growth Corp. The material herein has been obtained from sources believed to be reliable and accurate, however, its accuracy and completeness cannot be guaranteed. Our firm, employees, and customers may effect transactions, including transactions contrary to any recommendation herein, or have positions in the securities mentioned herein or options with respect thereto. Any recommendation contained in this report may not be suitable for all investors and it is not to be deemed an offer or solicitation on our part with respect to the purchase or sale of any securities. |
|
 |
Commodity-Linked Groups Again Led Widespread Losses
Kenneth J. Gruneisen - Passed the CAN SLIM® Master's Exam
Commodity-linked groups led large declines on Thursday as the Gold & Silver Index ($XAU -3.82%), Oil Services Index ($OSX -4.13%), and the Integrated Oil Index ($XOI -3.37%) fell. In the tech sector, the Networking Index ($NWX -2.90%), Semiconductor Index ($SOX -2.74%), and the Biotechnology Index ($BTK -2.24%) suffered unanimous losses. The Retail Index ($RLX -1.73%) was a negative influence on the major averages, along with deterioration in financial shares, as the Broker/Dealer Index ($XBD -2.62%) and the Bank Index ($BKX -2.45%) both fell.
Charts courtesy www.stockcharts.com
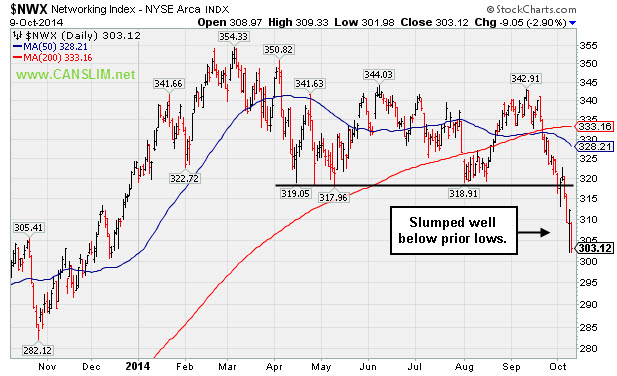
PICTURED: The Networking Index ($NWX -2.90%) has slumped well below its prior lows.
| Oil Services |
$OSX |
245.33 |
-10.56 |
-4.13% |
-12.70% |
| Integrated Oil |
$XOI |
1,461.57 |
-50.99 |
-3.37% |
-2.77% |
| Semiconductor |
$SOX |
602.97 |
-17.00 |
-2.74% |
+12.70% |
| Networking |
$NWX |
303.12 |
-9.05 |
-2.90% |
-6.43% |
| Broker/Dealer |
$XBD |
162.22 |
-4.37 |
-2.62% |
+1.04% |
| Retail |
$RLX |
920.48 |
-16.23 |
-1.73% |
-2.06% |
| Gold & Silver |
$XAU |
78.96 |
-3.14 |
-3.82% |
-6.17% |
| Bank |
$BKX |
69.72 |
-1.75 |
-2.45% |
+0.66% |
| Biotech |
$BTK |
3,007.59 |
-68.84 |
-2.24% |
+29.06% |
|
|
|
 |
Submit Your Request for a Featured Stock Update
Kenneth J. Gruneisen - Passed the CAN SLIM® Master's Exam
There are few stocks currently included on the Featured Stocks list and none of the companies need additional review in detail with annotated graphs. At times like these we have an opportunity to look back and review previously featured stocks which were dropped. This can serve as an educational review of the investment system's tactics and a reminder that even high-ranked leaders eventually fall out of favor. If you wish to request for a specific stock to receive more detailed coverage in this section please use the inquiry form to submit your request. Thank you! |
|
|
Color Codes Explained :
Y - Better candidates highlighted by our
staff of experts.
G - Previously featured
in past reports as yellow but may no longer be buyable under the
guidelines.
***Last / Change / Volume data in this table is the closing quote data***
Symbol/Exchange
Company Name
Industry Group |
PRICE |
CHANGE
(%Change) |
Day High |
Volume
(% DAV)
(% 50 day avg vol) |
52 Wk Hi
% From Hi |
Featured
Date |
Price
Featured |
Pivot Featured |
|
Max Buy |
ACT
-
NYSE
Actavis plc
Medical-Generic Drugs
|
$242.28
|
-4.37
-1.77% |
$248.56
|
2,209,306
91.79% of 50 DAV
50 DAV is 2,407,000
|
$249.94
-3.06%
|
6/20/2014
|
$216.53
|
PP = $230.87
|
|
MB = $242.41
|
Most Recent Note - 10/8/2014 6:13:11 PM
G - Stubbornly holding its ground near its 52-week high. Prior highs near $230 define near-term support to watch on pullbacks. See the latest FSU analysis for more details and new annotated graphs.
>>> FEATURED STOCK ARTICLE : Held Ground Above Prior Highs Defining Near-Term Support - 10/8/2014
View all notes |
Set NEW NOTE alert |
CANSLIM.net Company Profile |
SEC
News |
Chart |
Request a new note
C
A N
S L
I M


|
FB
-
NASDAQ
Facebook Inc Cl A
INTERNET
|
$75.91
|
-1.61
-2.08% |
$77.76
|
32,408,824
101.81% of 50 DAV
50 DAV is 31,834,000
|
$79.71
-4.76%
|
9/9/2014
|
$76.67
|
PP = $76.84
|
|
MB = $80.68
|
Most Recent Note - 10/8/2014 6:16:51 PM
Y - Managed a "positive reversal" today after briefly undercutting its 50 DMA line ($75.72). Subsequent violations of the 50 DMA line and recent lows would raise greater concerns and trigger technical sell signals.
>>> FEATURED STOCK ARTICLE : Fell Toward 50-day Moving Average; Recent Gains Lacked Great Volume - 9/25/2014
View all notes |
Set NEW NOTE alert |
CANSLIM.net Company Profile |
SEC
News |
Chart |
Request a new note
C
A N
S L
I M
|
NXPI
-
NASDAQ
Nxp Semiconductors N V
ELECTRONICS - Semiconductor - Broad Line
|
$64.34
|
-1.82
-2.75% |
$66.16
|
3,644,077
110.16% of 50 DAV
50 DAV is 3,308,000
|
$73.82
-12.84%
|
8/29/2014
|
$68.50
|
PP = $67.89
|
|
MB = $71.28
|
 Most Recent Note - 10/9/2014 5:26:59 PM
G - Slumping below its 50 DMA line and its color code is changed to green. Weak market conditions (M criteria) have recently prompted investors to reduce exposure in any faltering stocks and avoid new buying efforts until strength returns.
>>> FEATURED STOCK ARTICLE : Halted Slide After Negating Breakout and Undercutting 50-Day Average - 10/6/2014
View all notes |
Set NEW NOTE alert |
CANSLIM.net Company Profile |
SEC
News |
Chart |
Request a new note
C
A N
S L
I M
|
PANW
-
NYSE
Palo Alto Networks
Computer Sftwr-Security
|
$102.73
|
+0.49
0.48% |
$103.93
|
2,290,603
123.48% of 50 DAV
50 DAV is 1,855,000
|
$106.79
-3.80%
|
7/30/2014
|
$84.21
|
PP = $85.88
|
|
MB = $90.17
|
Most Recent Note - 10/9/2014 5:29:54 PM
G - Finished at its second-best close with today's 2nd consecutive volume-driven gain. Held its ground stubbornly while widespread market (M criteria) weakness recently prompted concerns. The recent low ($93.00 on 10/01/14) defines initial support to watch above its 50 DMA line.
>>> FEATURED STOCK ARTICLE : Holding Ground Near Highs After Big Volume-Driven Gains - 9/24/2014
View all notes |
Set NEW NOTE alert |
CANSLIM.net Company Profile |
SEC
News |
Chart |
Request a new note
C
A N
S L
I M
|
STRT
-
NASDAQ
Strattec Security Corp
AUTOMOTIVE - Auto Parts
|
$78.85
|
-0.74
-0.93% |
$79.96
|
13,945
60.63% of 50 DAV
50 DAV is 23,000
|
$89.87
-12.27%
|
9/19/2014
|
$86.06
|
PP = $89.97
|
|
MB = $94.47
|
Most Recent Note - 10/7/2014 6:36:18 PM
Y - Slumped near its 50 DMA line ($76.76) today while eroding market conditions (M criteria) raised greater concerns. It faces near term resistance due to overhead supply up through the $89 level.
>>> FEATURED STOCK ARTICLE : Consolidating Above Prior Highs and 50-Day Moving Average Line - 9/26/2014
View all notes |
Set NEW NOTE alert |
CANSLIM.net Company Profile |
SEC
News |
Chart |
Request a new note
C
A N
S L
I M
|
Symbol/Exchange
Company Name
Industry Group |
PRICE |
CHANGE
(%Change) |
Day High |
Volume
(% DAV)
(% 50 day avg vol) |
52 Wk Hi
% From Hi |
Featured
Date |
Price
Featured |
Pivot Featured |
|
Max Buy |
TARO
-
NYSE
Taro Pharmaceutical Inds
DRUGS - Drug Manufacturers - Other
|
$145.39
|
-2.82
-1.90% |
$149.98
|
89,861
88.97% of 50 DAV
50 DAV is 101,000
|
$165.30
-12.04%
|
7/30/2014
|
$144.24
|
PP = $149.99
|
|
MB = $157.49
|
Most Recent Note - 10/7/2014 12:34:41 PM
G - Gapped down today, yet it is up from earlier lows. Its 50 DMA line recently acted as resistance after damaging losses raised concerns and triggered a technical sell signal. Repeatedly noted with caution - "Recently reported earnings for the Jun '14 quarter below the +25% minimum earnings guideline (C criteria) raising fundamental concerns."
>>> FEATURED STOCK ARTICLE : Consolidating Above 50-day Moving Average and Prior Highs - 9/23/2014
View all notes |
Set NEW NOTE alert |
CANSLIM.net Company Profile |
SEC
News |
Chart |
Request a new note
C
A N
S L
I M
|
|
|
|
THESE ARE NOT BUY RECOMMENDATIONS!
Comments contained in the body of this report are technical
opinions only. The material herein has been obtained
from sources believed to be reliable and accurate, however,
its accuracy and completeness cannot be guaranteed.
This site is not an investment advisor, hence it does
not endorse or recommend any securities or other investments.
Any recommendation contained in this report may not
be suitable for all investors and it is not to be deemed
an offer or solicitation on our part with respect to
the purchase or sale of any securities. All trademarks,
service marks and trade names appearing in this report
are the property of their respective owners, and are
likewise used for identification purposes only.
This report is a service available
only to active Paid Premium Members.
You may opt-out of receiving report notifications
at any time. Questions or comments may be submitted
by writing to Premium Membership Services 665 S.E. 10 Street, Suite 201 Deerfield Beach, FL 33441-5634 or by calling 1-800-965-8307
or 954-785-1121.
|
|
|

