You are not logged in.
This means you
CAN ONLY VIEW reports that were published prior to Monday, April 7, 2025.
You
MUST UPGRADE YOUR MEMBERSHIP if you want to see any current reports.
AFTER MARKET UPDATE - FRIDAY, OCTOBER 10TH, 2014
Previous After Market Report Next After Market Report >>>
|
|
|
|
DOW |
-115.15 |
16,544.10 |
-0.69% |
|
Volume |
924,700,230 |
+6% |
|
Volume |
2,584,614,880 |
+24% |
|
NASDAQ |
-102.10 |
4,276.24 |
-2.33% |
|
Advancers |
660 |
21% |
|
Advancers |
750 |
25% |
|
S&P 500 |
-22.08 |
1,906.13 |
-1.15% |
|
Decliners |
2,442 |
77% |
|
Decliners |
2,208 |
73% |
|
Russell 2000 |
-14.67 |
1,053.32 |
-1.37% |
|
52 Wk Highs |
14 |
|
|
52 Wk Highs |
21 |
|
|
S&P 600 |
-6.60 |
610.90 |
-1.07% |
|
52 Wk Lows |
434 |
|
|
52 Wk Lows |
351 |
|
|
 |
Indices Bear Down on 200-Day Moving Averages as Correction Worsens
Kenneth J. Gruneisen - Passed the CAN SLIM® Master's Exam
Overall, the major averages declined for the third straight week. The Dow finished with a weekly loss of -2.7% and the S&P 500 fell -3.1%. The NASDAQ dropped -4.5%, its largest weekly decline since May 2012. The major averages finished near Friday's session lows, which doesn't bode well going into next week. The volume totals were reported higher than the prior session totals on the NYSE and on the Nasdaq exchange, a sign of more worrisome selling pressure from the institutional crowd. Breadth was solidly negative as decliners led advancers by almost a 4-1 margin on the NYSE and a 3-1 margin on the Nasdaq exchange. Leadership contracted as there were 9 high-ranked companies from the CANSLIM.net Leaders List that made new 52-week highs and appeared on the CANSLIM.net BreakOuts Page, down from the prior session total of 15 stocks. The new 52-week lows list substantially expanded and solidly outnumbered new 52-week highs on the NYSE and on the Nasdaq exchange. There were losses for all 6 high-ranked companies currently included on the Featured Stocks Page, a list that has waned as market conditions eroded. Distributional action raised concerns while leadership (stocks hitting new 52-week highs) waned and a deteriorating market (M criteria) environment was repeatedly noted in this commentary. New buying efforts are discouraged during market corrections while the fact-based investment system prompts disciplined investors to lean toward reducing market exposure.
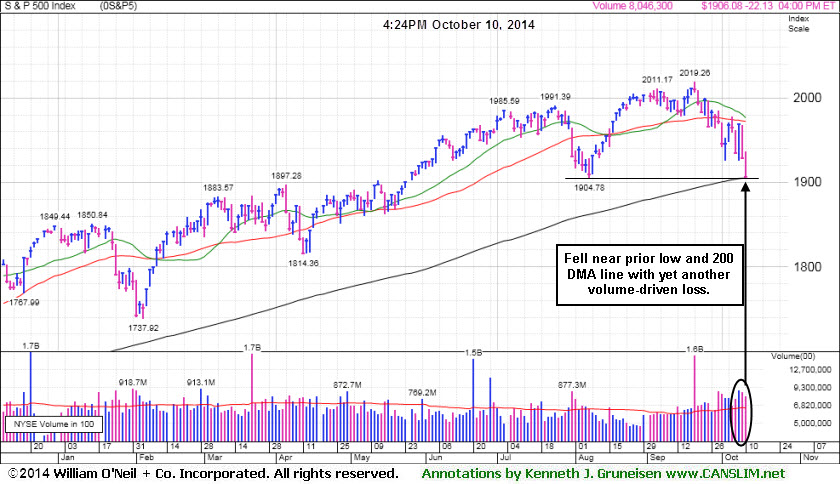
PICTURED: The S&P 500 declined 22 points to 1,906 following its biggest loss in six months. It ended near its prior low and just one point above its 200-day moving average (DMA) line.
Friday marked another volatile trading session. The Dow Jones Industrial Average fell 115 points to 16,544, and the Nasdaq Composite Index dropped 102 points to 4,276. Both major averages violated and closed below their respective 200 DMA lines. The correction may worsen as selling begets more selling, although the major averages are likely to find some support near their 200 DMA lines. Disciplined investors know to be patient and watch for a new rally with a solid follow-through day with better leadership before considering any new buying efforts.
Eight of the 10 sectors in the S&P 500 retreated. Technology was the worst performing group and large losses among chipmakers weighed on the tech-heavy NASDAQ. Microchip (MCHP -12.26%) fell after pre-announcing disappointing earnings results and the company said another industry correction has begun. As a result, Intel (INTC -5.09%), Analog Devices (ADI -6.24%), and Texas Instruments (TXN -7.13%) tumbled.
Materials and industrials also dragged on the market as Alcoa (AA -4.42%) and General Electric (GE -2.06%) declined. On the upside, the more defensive sectors of utilities and consumer staples advanced. Duke Energy (DUK +0.58%) and Procter & Gamble (PG +1.23%) rose.
Treasuries advanced. The 10-year note rose 6/32 to yield 2.29% and posted its longest streak of weekly gains since January.
The CANSLIM.net Featured Stocks Page shows the most action-worthy candidates and their latest notes and a Headline Link directs members to the latest detailed analysis with data-packed graphs annotated by a Certified expert along with links to additional resources. The Premium Member Homepage includes "dynamic archives" to all prior pay reports published.
|
 Kenneth J. Gruneisen started out as a licensed stockbroker in August 1987, a couple of months prior to the historic stock market crash that took the Dow Jones Industrial Average down -22.6% in a single day. He has published daily fact-based fundamental and technical analysis on high-ranked stocks online for two decades. Through FACTBASEDINVESTING.COM, Kenneth provides educational articles, news, market commentary, and other information regarding proven investment systems that work in good times and bad.
Comments contained in the body of this report are technical opinions only and are not necessarily those of Gruneisen Growth Corp. The material herein has been obtained from sources believed to be reliable and accurate, however, its accuracy and completeness cannot be guaranteed. Our firm, employees, and customers may effect transactions, including transactions contrary to any recommendation herein, or have positions in the securities mentioned herein or options with respect thereto. Any recommendation contained in this report may not be suitable for all investors and it is not to be deemed an offer or solicitation on our part with respect to the purchase or sale of any securities. |
|
 |
Semiconductor and Networking Indexes Led Group Decliners
Kenneth J. Gruneisen - Passed the CAN SLIM® Master's Exam
Large losses for the Semiconductor Index ($SOX -6.89%) and Networking Index ($NWX -5.43%) led the tech sector's abrupt retreat. Commodity-linked groups had a negative bias as the Gold & Silver Index ($XAU -2.15%), Oil Services Index ($OSX -1.73%), and the Integrated Oil Index ($XOI -1.61%) fell. Modest losses for the Broker/Dealer Index ($XBD -1.32%) and the Bank Index ($BKX -1.12%) also weighed on the major averages and the Retail Index ($RLX -0.90%) added to the market's negative bias. The Biotechnology Index ($BTK +0.25%) eked out a small gain.
Charts courtesy www.stockcharts.com
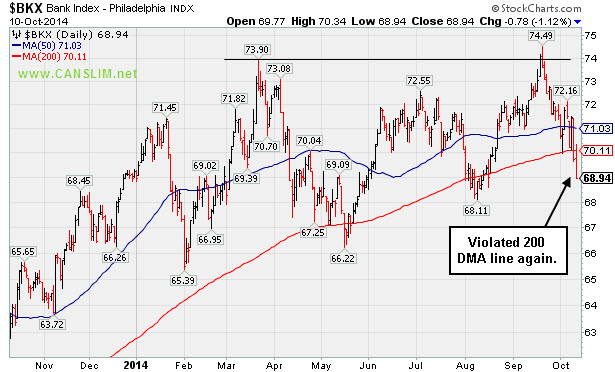
PICTURED: The Bank Index ($BKX -1.12%) violated its 200-day moving average (DMA) line again.
Charts courtesy www.stockcharts.com
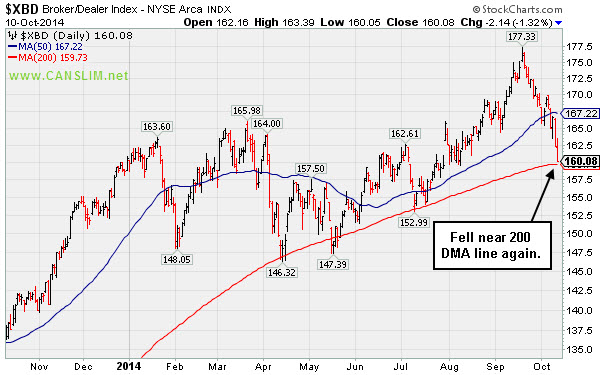
PICTURED: The Broker/Dealer Index ($XBD -1.32%) fell near its 200 DMA line again.
| Oil Services |
$OSX |
241.09 |
-4.24 |
-1.73% |
-14.21% |
| Integrated Oil |
$XOI |
1,438.03 |
-23.54 |
-1.61% |
-4.33% |
| Semiconductor |
$SOX |
561.40 |
-41.57 |
-6.89% |
+4.93% |
| Networking |
$NWX |
286.67 |
-16.45 |
-5.43% |
-11.51% |
| Broker/Dealer |
$XBD |
160.08 |
-2.14 |
-1.32% |
-0.30% |
| Retail |
$RLX |
912.22 |
-8.26 |
-0.90% |
-2.93% |
| Gold & Silver |
$XAU |
77.26 |
-1.70 |
-2.15% |
-8.19% |
| Bank |
$BKX |
68.94 |
-0.78 |
-1.12% |
-0.46% |
| Biotech |
$BTK |
3,012.05 |
+7.43 |
+0.25% |
+29.25% |
|
|
|
 |
Noted Fundamental and Technical Deterioration Raised Concerns
Kenneth J. Gruneisen - Passed the CAN SLIM® Master's Exam
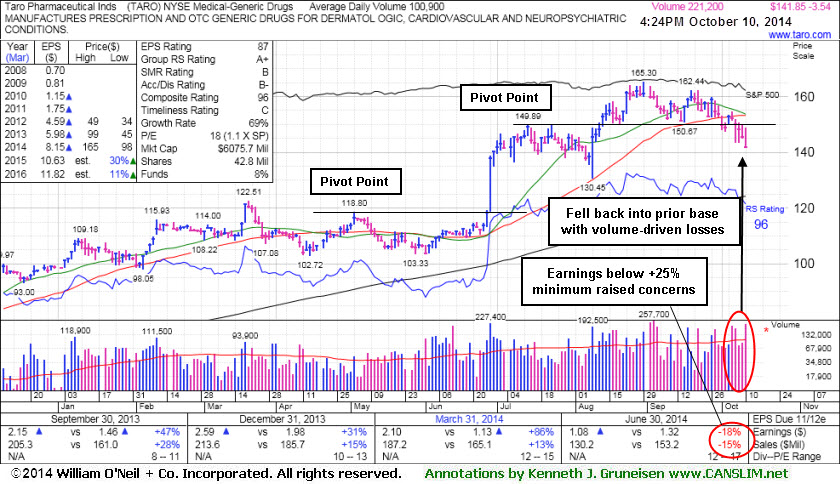
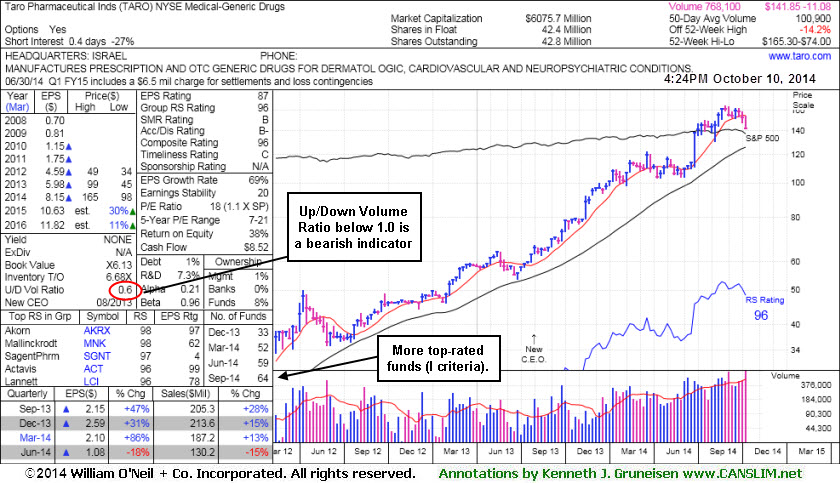
Taro Pharmaceutical Inds (TARO -$3.69 or -2.54% to $141.70) was down again today with above average volume for its 5th consecutive loss. Damaging losses were noted as they recently raised concerns and triggered a technical sell signal. Due to deteriorating fundamentals and technicals it will be dropped from the Featured Stocks list tonight.
TARO was last shown in this FSU section on 9/23/14 with annotated graphs under the headline, "Consolidating Above 50-day Moving Average and Prior Highs" enduring distributional pressure after repeatedly noted with caution - "Recently reported earnings for the Jun '14 quarter below the +25% minimum earnings guideline (C criteria) raising fundamental concerns." Members were previously reminded - "Disciplined investors who may still be giving it the benefit of the doubt should be watchful for any damaging sell signals which would prompt them to lock in gains."
It traded up as much as +40.9% since first featured in yellow in the 6/26/14 mid-day report at $117.31. The Israel-based Medical - Generic Drugs firm has a small supply (S criteria) of only 44.3 million shares outstanding, which is favorable, however any institutional buying or selling could lead to great price volatility. It has seen the number of top-rated funds owning its shares rise from 2 in Mar '12 to 64 as of Sep '14, a reassuring sign concerning the I criteria. However, its current Up/Down Volume Ratio of 0.6 is an unbiased indication that its shares have been under distributional pressure over the past 50 days.
|
|
|
Color Codes Explained :
Y - Better candidates highlighted by our
staff of experts.
G - Previously featured
in past reports as yellow but may no longer be buyable under the
guidelines.
***Last / Change / Volume data in this table is the closing quote data***
Symbol/Exchange
Company Name
Industry Group |
PRICE |
CHANGE
(%Change) |
Day High |
Volume
(% DAV)
(% 50 day avg vol) |
52 Wk Hi
% From Hi |
Featured
Date |
Price
Featured |
Pivot Featured |
|
Max Buy |
ACT
-
NYSE
Actavis plc
Medical-Generic Drugs
|
$236.62
|
-5.66
-2.34% |
$243.69
|
2,243,582
92.71% of 50 DAV
50 DAV is 2,420,000
|
$249.94
-5.33%
|
6/20/2014
|
$216.53
|
PP = $230.87
|
|
MB = $242.41
|
Most Recent Note - 10/8/2014 6:13:11 PM
G - Stubbornly holding its ground near its 52-week high. Prior highs near $230 define near-term support to watch on pullbacks. See the latest FSU analysis for more details and new annotated graphs.
>>> FEATURED STOCK ARTICLE : Held Ground Above Prior Highs Defining Near-Term Support - 10/8/2014
View all notes |
Set NEW NOTE alert |
CANSLIM.net Company Profile |
SEC
News |
Chart |
Request a new note
C
A N
S L
I M


|
FB
-
NASDAQ
Facebook Inc Cl A
INTERNET
|
$72.91
|
-3.00
-3.95% |
$76.50
|
52,056,194
163.98% of 50 DAV
50 DAV is 31,746,000
|
$79.71
-8.53%
|
9/9/2014
|
$76.67
|
PP = $76.84
|
|
MB = $80.68
|
 Most Recent Note - 10/10/2014 12:30:24 PM
G - Color code was changed to green as today's volume-driven loss violated its 50 DMA line and undercut prior lows ($73.07 on 9/16/14). Previously noted with caution - "Subsequent violations of the 50 DMA line and recent lows would raise greater concerns and trigger technical sell signals."
>>> FEATURED STOCK ARTICLE : Fell Toward 50-day Moving Average; Recent Gains Lacked Great Volume - 9/25/2014
View all notes |
Set NEW NOTE alert |
CANSLIM.net Company Profile |
SEC
News |
Chart |
Request a new note
C
A N
S L
I M
|
NXPI
-
NASDAQ
Nxp Semiconductors N V
ELECTRONICS - Semiconductor - Broad Line
|
$56.34
|
-8.00
-12.43% |
$58.39
|
18,567,487
561.63% of 50 DAV
50 DAV is 3,306,000
|
$73.82
-23.68%
|
8/29/2014
|
$68.50
|
PP = $67.89
|
|
MB = $71.28
|
Most Recent Note - 10/10/2014 11:00:55 AM
G - Gapped down today for a considerable loss undercutting prior lows in the $59 area and violating its 200 DMA line, raising serious concerns and triggering more worrisome technical sell signals. Since 9/25/14 it was repeatedly noted with caution - "Weak market conditions (M criteria) have recently prompted investors to reduce exposure in any faltering stocks and avoid new buying efforts until strength returns."
>>> FEATURED STOCK ARTICLE : Halted Slide After Negating Breakout and Undercutting 50-Day Average - 10/6/2014
View all notes |
Set NEW NOTE alert |
CANSLIM.net Company Profile |
SEC
News |
Chart |
Request a new note
C
A N
S L
I M
|
PANW
-
NYSE
Palo Alto Networks
Computer Sftwr-Security
|
$94.36
|
-8.37
-8.15% |
$102.99
|
4,275,454
227.18% of 50 DAV
50 DAV is 1,882,000
|
$106.79
-11.64%
|
7/30/2014
|
$84.21
|
PP = $85.88
|
|
MB = $90.17
|
Most Recent Note - 10/10/2014 12:49:38 PM
G - Up from earlier lows but down considerably with heavy volume today, enduring distributional pressure amid weakness in the tech sector. Widespread market (M criteria) weakness has recently prompted concerns. The recent low ($93.00 on 10/01/14) defines initial support to watch above its 50 DMA line ($91.13) where violations would trigger technical sell signals.
>>> FEATURED STOCK ARTICLE : Holding Ground Near Highs After Big Volume-Driven Gains - 9/24/2014
View all notes |
Set NEW NOTE alert |
CANSLIM.net Company Profile |
SEC
News |
Chart |
Request a new note
C
A N
S L
I M
|
STRT
-
NASDAQ
Strattec Security Corp
AUTOMOTIVE - Auto Parts
|
$77.80
|
-1.05
-1.33% |
$80.08
|
34,012
147.88% of 50 DAV
50 DAV is 23,000
|
$89.87
-13.43%
|
9/19/2014
|
$86.06
|
PP = $89.97
|
|
MB = $94.47
|
Most Recent Note - 10/7/2014 6:36:18 PM
Y - Slumped near its 50 DMA line ($76.76) today while eroding market conditions (M criteria) raised greater concerns. It faces near term resistance due to overhead supply up through the $89 level.
>>> FEATURED STOCK ARTICLE : Consolidating Above Prior Highs and 50-Day Moving Average Line - 9/26/2014
View all notes |
Set NEW NOTE alert |
CANSLIM.net Company Profile |
SEC
News |
Chart |
Request a new note
C
A N
S L
I M
|
Symbol/Exchange
Company Name
Industry Group |
PRICE |
CHANGE
(%Change) |
Day High |
Volume
(% DAV)
(% 50 day avg vol) |
52 Wk Hi
% From Hi |
Featured
Date |
Price
Featured |
Pivot Featured |
|
Max Buy |
TARO
-
NYSE
Taro Pharmaceutical Inds
DRUGS - Drug Manufacturers - Other
|
$141.70
|
-3.69
-2.54% |
$148.95
|
222,198
222.20% of 50 DAV
50 DAV is 100,000
|
$165.30
-14.28%
|
7/30/2014
|
$144.24
|
PP = $149.99
|
|
MB = $157.49
|
Most Recent Note - 10/10/2014 5:36:41 PM
Down today with above average volume for a 5th consecutive loss. Damaging losses raised concerns and triggered a technical sell signal after earnings for the Jun '14 quarter below the +25% minimum earnings guideline (C criteria) raised fundamental concerns. It will be dropped from the Featured Stocks list tonight. See the latest FSU analysis for more details and annotated graphs.
>>> FEATURED STOCK ARTICLE : Noted Fundamental and Technical Deterioration Raised Concerns - 10/10/2014
View all notes |
Set NEW NOTE alert |
CANSLIM.net Company Profile |
SEC
News |
Chart |
Request a new note
C
A N
S L
I M
|
|
|
|
THESE ARE NOT BUY RECOMMENDATIONS!
Comments contained in the body of this report are technical
opinions only. The material herein has been obtained
from sources believed to be reliable and accurate, however,
its accuracy and completeness cannot be guaranteed.
This site is not an investment advisor, hence it does
not endorse or recommend any securities or other investments.
Any recommendation contained in this report may not
be suitable for all investors and it is not to be deemed
an offer or solicitation on our part with respect to
the purchase or sale of any securities. All trademarks,
service marks and trade names appearing in this report
are the property of their respective owners, and are
likewise used for identification purposes only.
This report is a service available
only to active Paid Premium Members.
You may opt-out of receiving report notifications
at any time. Questions or comments may be submitted
by writing to Premium Membership Services 665 S.E. 10 Street, Suite 201 Deerfield Beach, FL 33441-5634 or by calling 1-800-965-8307
or 954-785-1121.
|
|
|

