You are not logged in.
This means you
CAN ONLY VIEW reports that were published prior to Sunday, March 23, 2025.
You
MUST UPGRADE YOUR MEMBERSHIP if you want to see any current reports.
AFTER MARKET UPDATE - WEDNESDAY, OCTOBER 8TH, 2014
Previous After Market Report Next After Market Report >>>
|
|
|
|
DOW |
+274.83 |
16,994.22 |
+1.64% |
|
Volume |
900,043,280 |
+16% |
|
Volume |
2,292,599,250 |
+11% |
|
NASDAQ |
+83.39 |
4,468.59 |
+1.90% |
|
Advancers |
2,500 |
78% |
|
Advancers |
2,003 |
70% |
|
S&P 500 |
+33.79 |
1,968.89 |
+1.75% |
|
Decliners |
613 |
19% |
|
Decliners |
800 |
28% |
|
Russell 2000 |
+20.81 |
1,097.12 |
+1.93% |
|
52 Wk Highs |
37 |
|
|
52 Wk Highs |
19 |
|
|
S&P 600 |
+11.72 |
632.33 |
+1.89% |
|
52 Wk Lows |
286 |
|
|
52 Wk Lows |
284 |
|
|
 |
Indices Managed Positive Reversals After Undercutting Prior Lows
Kenneth J. Gruneisen - Passed the CAN SLIM® Master's Exam
On Wednesday the major averages undercut their 10/02/14 lows, however from their session lows at about 11:15AM EST each managed an impressive "positive reversal" to finish near their session highs with big gains. The volume totals were reported higher than the prior session totals on the NYSE and on the Nasdaq exchange, a sign of better buying demand from the institutional crowd. Breadth was positive as advancers led decliners by more than a 4-1 margin on the NYSE and 5-2 on the Nasdaq exchange. However, leadership contracted as there were only 12 high-ranked companies from the CANSLIM.net Leaders List that made new 52-week highs and appeared on the CANSLIM.net BreakOuts Page, down from the prior session total of 21 stocks. The new 52-week lows list also expanded and solidly outnumbered new 52-week highs on the NYSE and on the Nasdaq exchange. There were gains for 5 of the 6 high-ranked companies currently included on the Featured Stocks Page. Distributional action raised concerns while leadership (stocks hitting new 52-week highs) waned and a deteriorating market (M criteria) environment was repeatedly noted in this commentary. New buying efforts are discouraged during market corrections while the fact-based investment system prompts disciplined investors to lean toward reducing market exposure.
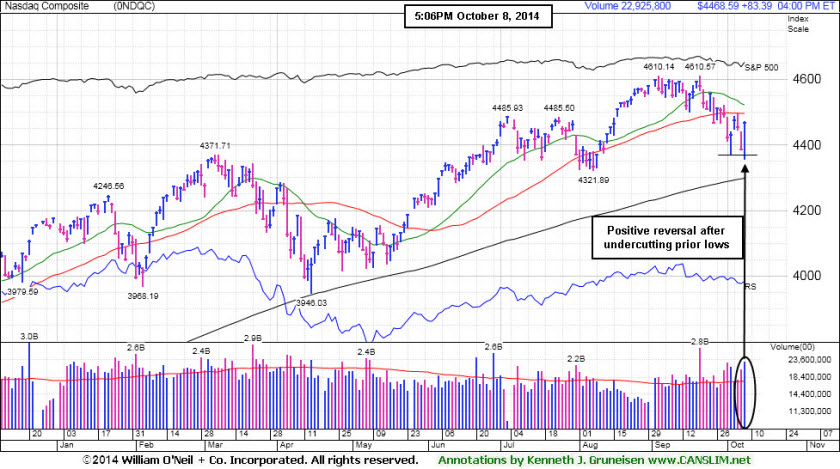
PICTURED: The NASDAQ Composite managed a "positive reversal" after undercutting prior lows, ending the session up 83 points to 4,468 with higher and above average volume behind the gain.
Stocks finished sharply higher on Wednesday. The Dow climbed 275 points to 16,994. The S&P 500 advanced 34 points to 1,968. The major averages first undercut their recent lows yet ended a choppy trading session firmly in positive territory to recover from Tuesday's sharp pullback. The market advanced after the Fed's September meeting minutes showed policy makers are cautious about raising interest rates too soon. Stocks retreated on Tuesday after the IMF lowered its outlook on global growth. Corporate earnings were in focus with Alcoa's (AA +0.75%) quarterly results after the close unofficially kicking off third-quarter reporting season. Consensus estimates are forecasting S&P 500 profits to grow 4.9%, according to Bloomberg.
All 10 sectors were up on the session. Health care was the best performing group with United Health (UNH +2.89%) climbing. Shares of Costco (COST +2.76%) and YUM! Brands (YUM +1.45%) were higher after both posted profits above projections. Tech outperformed with Apple (AAPL +2.08%) rising after the company announced an event next week expected to introduce new versions of the iPad. J.C. Penney (JCP -10.88%) tumbled after the retailer cut its sales forecast.
Treasuries were higher following the Fed minutes. Benchmark 10-year notes rose 6/32 to yield 2.32%.
In commodity trading, WTI crude lost -1.4% to $87.63/barrel on the NYMEX after a report showed weekly inventories rose. COMEX gold fell -0.5% to $1,205.30/ounce.
The CANSLIM.net Featured Stocks Page shows the most action-worthy candidates and their latest notes and a Headline Link directs members to the latest detailed analysis with data-packed graphs annotated by a Certified expert along with links to additional resources. The Premium Member Homepage includes "dynamic archives" to all prior pay reports published.
|
 Kenneth J. Gruneisen started out as a licensed stockbroker in August 1987, a couple of months prior to the historic stock market crash that took the Dow Jones Industrial Average down -22.6% in a single day. He has published daily fact-based fundamental and technical analysis on high-ranked stocks online for two decades. Through FACTBASEDINVESTING.COM, Kenneth provides educational articles, news, market commentary, and other information regarding proven investment systems that work in good times and bad.
Comments contained in the body of this report are technical opinions only and are not necessarily those of Gruneisen Growth Corp. The material herein has been obtained from sources believed to be reliable and accurate, however, its accuracy and completeness cannot be guaranteed. Our firm, employees, and customers may effect transactions, including transactions contrary to any recommendation herein, or have positions in the securities mentioned herein or options with respect thereto. Any recommendation contained in this report may not be suitable for all investors and it is not to be deemed an offer or solicitation on our part with respect to the purchase or sale of any securities. |
|
 |
Gold & Silver Index's Large Rebound Outpaced Other Groups
Kenneth J. Gruneisen - Passed the CAN SLIM® Master's Exam
The Retail Index ($RLX +1.75%) and financial shares had a positive influence on the major averages as the Bank Index ($BKX +1.78%) and the Broker/Dealer Index ($XBD +1.00%) both rallied. The Semiconductor Index ($SOX +2.27%) and the Biotechnology Index ($BTK +2.82%) outpaced the Networking Index ($NWX +0.95%). Energy-related shares also rose, boosting the Integrated Oil Index ($XOI +1.29%) and the Oil Services Index ($OSX +0.37%).
Charts courtesy www.stockcharts.com
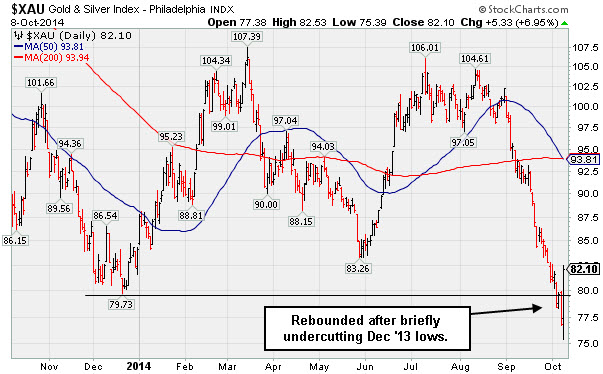
PICTURED: The Gold & Silver Index ($XAU +6.94%) was a standout gainer on Wednesday as numerous mining companies' shares rallied for big gains while bouncing back from their latest lows.
| Oil Services |
$OSX |
255.89 |
+0.94 |
+0.37% |
-8.95% |
| Integrated Oil |
$XOI |
1,512.56 |
+19.23 |
+1.29% |
+0.63% |
| Semiconductor |
$SOX |
619.97 |
+13.77 |
+2.27% |
+15.88% |
| Networking |
$NWX |
312.17 |
+2.94 |
+0.95% |
-3.63% |
| Broker/Dealer |
$XBD |
166.59 |
+1.65 |
+1.00% |
+3.76% |
| Retail |
$RLX |
936.71 |
+16.13 |
+1.75% |
-0.33% |
| Gold & Silver |
$XAU |
82.10 |
+5.33 |
+6.94% |
-2.44% |
| Bank |
$BKX |
71.47 |
+1.25 |
+1.78% |
+3.19% |
| Biotech |
$BTK |
3,076.43 |
+84.40 |
+2.82% |
+32.01% |
|
|
|
 |
Held Ground Above Prior Highs Defining Near-Term Support
Kenneth J. Gruneisen - Passed the CAN SLIM® Master's Exam
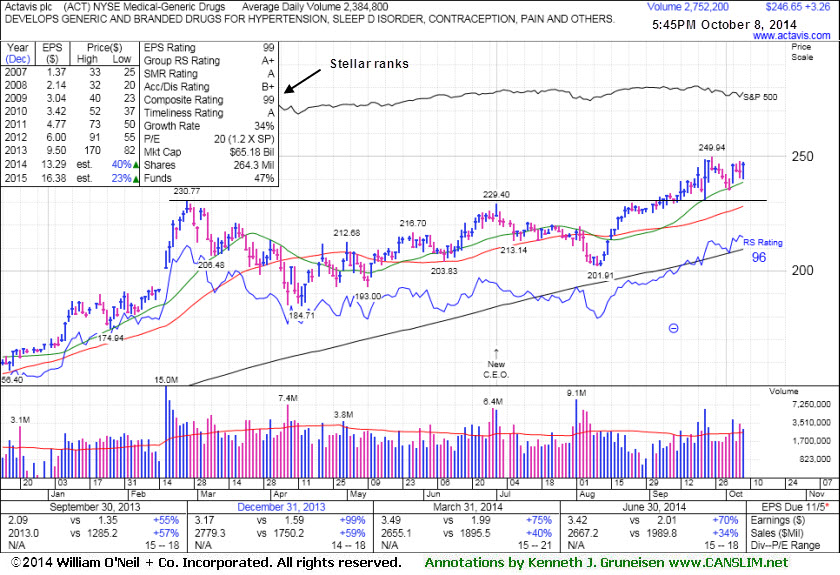
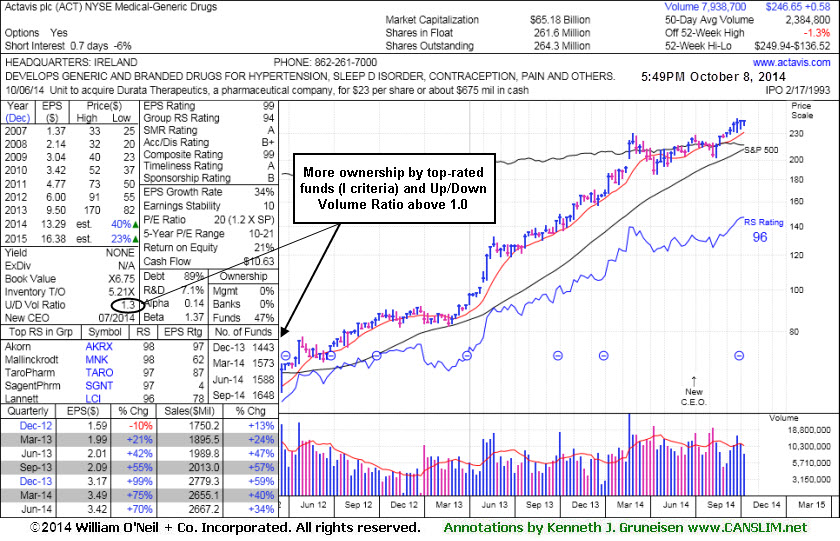
Actavis plc (ACT +$3.26 or +1.34% to $246.65) has been stubbornly holding its ground near its 52-week high. Prior highs near $230 define near-term support to watch on pullbacks. It stayed above prior highs since last shown in this FSU section on 9/21/14 with annotated graphs under the headline, "Finally Volume-backed Gains Confirmed a Technical Buy Signal", hitting new 52-week and all-time highs as it rose with +77% above average volume behind its gain. The bullish session helped to confirm a technical buy signal.
Its Accumulation/Distribution Rating has recently been improving and it has earned stellar ranks overall. Its streak of gains and rebound above its 50-day moving average (DMA) line helped its outlook improve after it had sputtered since highlighted in yellow in the 6/20/14 mid-day report (read here) with a pivot point based on its 2/26/14 high plus 10 cents.
The Medical - Generic Drugs industry group currently has a 94 Group Relative Strength Rating, up from a 66 when shown on 8/28/14. Leadership from other issues in the group is also a reassuring sign concerning the L criteria. It reported earnings +70% on +34% sales revenues for the Jun '14 quarter, and its strong record satisfies the C criteria. Its annual earnings (A criteria) history has also been strong. The number of top-rated funds owning its shares has been on the rise, up from 1,219 in Sep '13 to 1,648 in Sep '14, a reassuring sign concerning the I criteria. Its current Up/Down Volume Ratio of 1.3 is an unbiased indication its shares have been under accumulation over the past 50 days.
|
|
|
Color Codes Explained :
Y - Better candidates highlighted by our
staff of experts.
G - Previously featured
in past reports as yellow but may no longer be buyable under the
guidelines.
***Last / Change / Volume data in this table is the closing quote data***
Symbol/Exchange
Company Name
Industry Group |
PRICE |
CHANGE
(%Change) |
Day High |
Volume
(% DAV)
(% 50 day avg vol) |
52 Wk Hi
% From Hi |
Featured
Date |
Price
Featured |
Pivot Featured |
|
Max Buy |
ACT
-
NYSE
Actavis plc
Medical-Generic Drugs
|
$246.65
|
+3.26
1.34% |
$247.50
|
2,752,227
115.45% of 50 DAV
50 DAV is 2,384,000
|
$249.94
-1.32%
|
6/20/2014
|
$216.53
|
PP = $230.87
|
|
MB = $242.41
|
 Most Recent Note - 10/8/2014 6:13:11 PM
G - Stubbornly holding its ground near its 52-week high. Prior highs near $230 define near-term support to watch on pullbacks. See the latest FSU analysis for more details and new annotated graphs.
>>> FEATURED STOCK ARTICLE : Held Ground Above Prior Highs Defining Near-Term Support - 10/8/2014
View all notes |
Set NEW NOTE alert |
CANSLIM.net Company Profile |
SEC
News |
Chart |
Request a new note
C
A N
S L
I M


|
FB
-
NASDAQ
Facebook Inc Cl A
INTERNET
|
$77.52
|
+1.23
1.61% |
$77.71
|
32,782,696
102.44% of 50 DAV
50 DAV is 32,001,000
|
$79.71
-2.74%
|
9/9/2014
|
$76.67
|
PP = $76.84
|
|
MB = $80.68
|
Most Recent Note - 10/8/2014 6:16:51 PM
Y - Managed a "positive reversal" today after briefly undercutting its 50 DMA line ($75.72). Subsequent violations of the 50 DMA line and recent lows would raise greater concerns and trigger technical sell signals.
>>> FEATURED STOCK ARTICLE : Fell Toward 50-day Moving Average; Recent Gains Lacked Great Volume - 9/25/2014
View all notes |
Set NEW NOTE alert |
CANSLIM.net Company Profile |
SEC
News |
Chart |
Request a new note
C
A N
S L
I M
|
NXPI
-
NASDAQ
Nxp Semiconductors N V
ELECTRONICS - Semiconductor - Broad Line
|
$66.16
|
+0.96
1.47% |
$66.44
|
5,034,232
152.64% of 50 DAV
50 DAV is 3,298,000
|
$73.82
-10.38%
|
8/29/2014
|
$68.50
|
PP = $67.89
|
|
MB = $71.28
|
Most Recent Note - 10/8/2014 6:18:56 PM
Y- Managed a "positive reversal" today and finished near its 50 DMA line with a volume-driven gain after undercutting prior lows. Weak market conditions (M criteria) recently prompted investors to reduce exposure in any faltering stocks and avoid new buying efforts until strength returns.
>>> FEATURED STOCK ARTICLE : Halted Slide After Negating Breakout and Undercutting 50-Day Average - 10/6/2014
View all notes |
Set NEW NOTE alert |
CANSLIM.net Company Profile |
SEC
News |
Chart |
Request a new note
C
A N
S L
I M
|
PANW
-
NYSE
Palo Alto Networks
Computer Sftwr-Security
|
$102.24
|
+2.45
2.46% |
$102.52
|
2,253,967
123.64% of 50 DAV
50 DAV is 1,823,000
|
$106.79
-4.26%
|
7/30/2014
|
$84.21
|
PP = $85.88
|
|
MB = $90.17
|
Most Recent Note - 10/8/2014 6:20:33 PM
G - Managed a "positive reversal" for a gain with slightly higher volume today. Perched near its 52-week high following volume-driven gains. Held its ground stubbornly while widespread market (M criteria) weakness recently prompted concerns. The recent low ($103.00 on 10/01/14) defines initial support to watch above its 50 DMA line.
>>> FEATURED STOCK ARTICLE : Holding Ground Near Highs After Big Volume-Driven Gains - 9/24/2014
View all notes |
Set NEW NOTE alert |
CANSLIM.net Company Profile |
SEC
News |
Chart |
Request a new note
C
A N
S L
I M
|
STRT
-
NASDAQ
Strattec Security Corp
AUTOMOTIVE - Auto Parts
|
$79.59
|
+1.51
1.93% |
$80.19
|
12,544
54.54% of 50 DAV
50 DAV is 23,000
|
$89.87
-11.44%
|
9/19/2014
|
$86.06
|
PP = $89.97
|
|
MB = $94.47
|
Most Recent Note - 10/7/2014 6:36:18 PM
Y - Slumped near its 50 DMA line ($76.76) today while eroding market conditions (M criteria) raised greater concerns. It faces near term resistance due to overhead supply up through the $89 level.
>>> FEATURED STOCK ARTICLE : Consolidating Above Prior Highs and 50-Day Moving Average Line - 9/26/2014
View all notes |
Set NEW NOTE alert |
CANSLIM.net Company Profile |
SEC
News |
Chart |
Request a new note
C
A N
S L
I M
|
Symbol/Exchange
Company Name
Industry Group |
PRICE |
CHANGE
(%Change) |
Day High |
Volume
(% DAV)
(% 50 day avg vol) |
52 Wk Hi
% From Hi |
Featured
Date |
Price
Featured |
Pivot Featured |
|
Max Buy |
TARO
-
NYSE
Taro Pharmaceutical Inds
DRUGS - Drug Manufacturers - Other
|
$148.21
|
-1.85
-1.23% |
$150.71
|
77,499
76.73% of 50 DAV
50 DAV is 101,000
|
$165.30
-10.34%
|
7/30/2014
|
$144.24
|
PP = $149.99
|
|
MB = $157.49
|
Most Recent Note - 10/7/2014 12:34:41 PM
G - Gapped down today, yet it is up from earlier lows. Its 50 DMA line recently acted as resistance after damaging losses raised concerns and triggered a technical sell signal. Repeatedly noted with caution - "Recently reported earnings for the Jun '14 quarter below the +25% minimum earnings guideline (C criteria) raising fundamental concerns."
>>> FEATURED STOCK ARTICLE : Consolidating Above 50-day Moving Average and Prior Highs - 9/23/2014
View all notes |
Set NEW NOTE alert |
CANSLIM.net Company Profile |
SEC
News |
Chart |
Request a new note
C
A N
S L
I M
|
|
|
|
THESE ARE NOT BUY RECOMMENDATIONS!
Comments contained in the body of this report are technical
opinions only. The material herein has been obtained
from sources believed to be reliable and accurate, however,
its accuracy and completeness cannot be guaranteed.
This site is not an investment advisor, hence it does
not endorse or recommend any securities or other investments.
Any recommendation contained in this report may not
be suitable for all investors and it is not to be deemed
an offer or solicitation on our part with respect to
the purchase or sale of any securities. All trademarks,
service marks and trade names appearing in this report
are the property of their respective owners, and are
likewise used for identification purposes only.
This report is a service available
only to active Paid Premium Members.
You may opt-out of receiving report notifications
at any time. Questions or comments may be submitted
by writing to Premium Membership Services 665 S.E. 10 Street, Suite 201 Deerfield Beach, FL 33441-5634 or by calling 1-800-965-8307
or 954-785-1121.
|
|
|

