You are not logged in.
This means you
CAN ONLY VIEW reports that were published prior to Monday, April 14, 2025.
You
MUST UPGRADE YOUR MEMBERSHIP if you want to see any current reports.
AFTER MARKET UPDATE - WEDNESDAY, OCTOBER 5TH, 2011
Previous After Market Report Next After Market Report >>>
|
|
|
|
DOW |
+131.24 |
10,939.95 |
+1.21% |
|
Volume |
1,194,514,050 |
-28% |
|
Volume |
2,420,043,440 |
-18% |
|
NASDAQ |
+55.69 |
2,460.51 |
+2.32% |
|
Advancers |
2,211 |
71% |
|
Advancers |
1,762 |
67% |
|
S&P 500 |
+20.09 |
1,144.04 |
+1.79% |
|
Decliners |
826 |
27% |
|
Decliners |
804 |
30% |
|
Russell 2000 |
+9.47 |
658.11 |
+1.46% |
|
52 Wk Highs |
12 |
|
|
52 Wk Highs |
6 |
|
|
S&P 600 |
+4.35 |
364.42 |
+1.21% |
|
52 Wk Lows |
55 |
|
|
52 Wk Lows |
83 |
|
|
 |
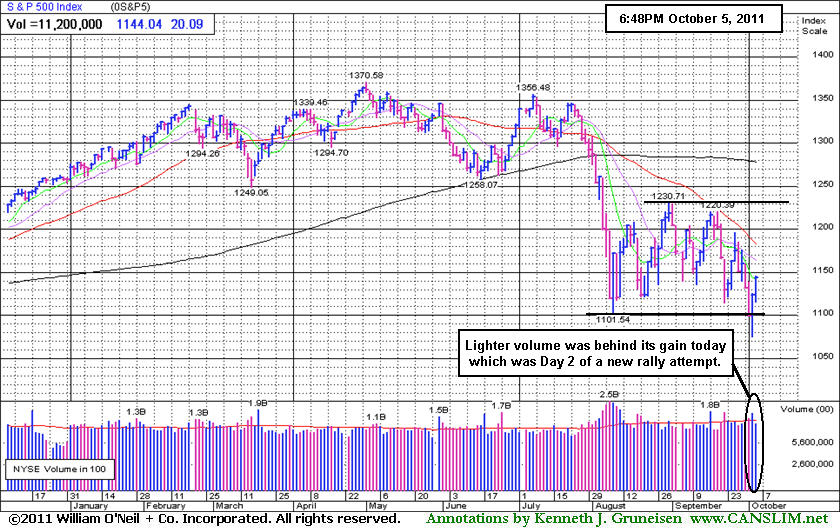
Lighter Volume Backed 2nd Day Of Gains in New Rally Attempt
Kenneth J. Gruneisen - Passed the CAN SLIM® Master's Exam
The major averages worked their way higher again, but Wednesday's session had much lighter volume totals reported on the NYSE and on the Nasdaq exchange, revealing a lack of institutional buying demand. Breadth was positive as advancing issues beat decliners by 11-4 on the NYSE and by more than 2-1 on the Nasdaq exchange. A great contraction occurred in the new 52-week lows totals on both the Nasdaq exchange and the NYSE, however new lows still easily outnumbered new 52-week highs. The new highs total on the Nasdaq exchange remained in the single digits. There were only 3 high-ranked companies from the CANSLIM.net Leaders List that made a new 52-week high and appeared on the CANSLIM.net BreakOuts Page, up from 2 on the prior session. There were gains for all of the 5 high-ranked companies currently included on the Featured Stocks Page, a list that has been recently been shrinking.
Suddenly, the sentiment turned sunnier on Wall Street. Mildly positive economic reports and the hope of improvement in Europe were enough to carry the Dow to its second straight triple-digit gain. Volatility was lower than Tuesday's frenzied session.
Reports on jobs and the service economy were well-received. The ISM non-manufacturing index continued to point to expansion in September. ADP Employer Services estimated companies in the U.S. added 91,000 jobs in September. Analysts had been expecting a gain of 75,000.
Energy and technology sectors led today’s advance. Yahoo! Inc (YHOO +7.7%) rallied following a report that Microsoft Corp (MSFT +2.2%) may make a bid for the company. Monsanto (MON +5.2%) rose after forecasting higher-than-expected profits. Chevron Corp (CVX +3.4%) rallied and added over 20 points to the Dow Industrials after the U.S. Energy Department reported an unexpected decline in oil inventories. The price of oil gained for the first time in four days. .
The market environment (M criteria) is clearly under pressure and back in a correction after a heavy wave of distributional action. Disciplined investors are now watching for a follow-through day (FTD) of solid gains on higher volume from at least one of the major averages coupled with an expansion in the number of stocks hitting new highs. Historic studies suggest that it is most ideal for a FTD to come between Day 4-7 of a new rally attempt.
The Q3 2011 Webcast (aired on September 28th) is now available "ON DEMAND" - (CLICK HERE) It provides an informative review of current market conditions, leading groups, and best buy candidates. All upgraded members are eligible to access the webcast presentation at no additional cost! Via the Premium Member Homepage links to all prior reports and webcasts are always available.
PICTURED: The S&P 500 Index had lighter volume behind its gain which was Day 2 of a new rally attempt.
|
 Kenneth J. Gruneisen started out as a licensed stockbroker in August 1987, a couple of months prior to the historic stock market crash that took the Dow Jones Industrial Average down -22.6% in a single day. He has published daily fact-based fundamental and technical analysis on high-ranked stocks online for two decades. Through FACTBASEDINVESTING.COM, Kenneth provides educational articles, news, market commentary, and other information regarding proven investment systems that work in good times and bad.
Comments contained in the body of this report are technical opinions only and are not necessarily those of Gruneisen Growth Corp. The material herein has been obtained from sources believed to be reliable and accurate, however, its accuracy and completeness cannot be guaranteed. Our firm, employees, and customers may effect transactions, including transactions contrary to any recommendation herein, or have positions in the securities mentioned herein or options with respect thereto. Any recommendation contained in this report may not be suitable for all investors and it is not to be deemed an offer or solicitation on our part with respect to the purchase or sale of any securities. |
|
 |
Tech Sector Led; Commodity-Linked Groups Also Posted Big Gains
Kenneth J. Gruneisen - Passed the CAN SLIM® Master's Exam
Big gains from the tech sector on Wednesday contributed to the tech-heavy Nasdaq Composite Index outperforming its peers as the Biotechnology Index ($BTK +2.92%), Semiconductor Index ($SOX +3.10%), Internet Index ($IIX +3.38%), and Networking Index ($NWX +4.03%) finished unanimously higher. The Healthcare Index ($HMO +2.21%) rose, and commodity-linked groups also rebounded as the Oil Services Index ($OSX +2.33%), Integrated Oil Index ($XOI +3.42%), and Gold & Silver Index ($XAU +4.52%) each posted solid gains. The Retail Index ($RLX +1.39%) rose more modestly, and additional gains in the financial sector also helped as the Bank Index ($BKX +1.05%) and Broker/Dealer Index ($XBD +1.94%) provide some positive influence on the major averages to help them up from Tuesday's new 2011 lows.
Charts courtesy www.stockcharts.com
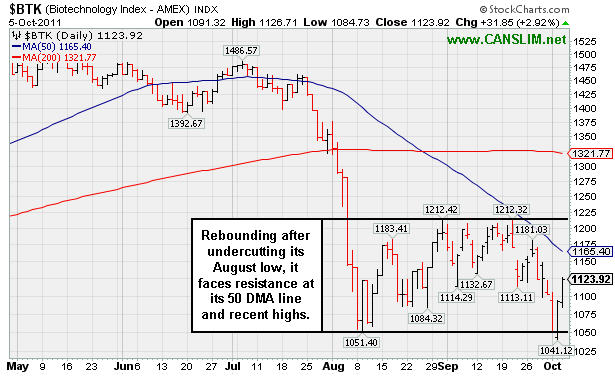
PICTURED: The Biotechnology Index ($BTK +2.92%) is rebounding after undercutting its August low, and it faces near-term resistance at its 50-day moving average (DMA) line and recent highs.
| Oil Services |
$OSX |
192.72 |
+4.38 |
+2.33% |
-21.38% |
| Healthcare |
$HMO |
1,825.99 |
+39.51 |
+2.21% |
+7.92% |
| Integrated Oil |
$XOI |
1,061.34 |
+35.13 |
+3.42% |
-12.51% |
| Semiconductor |
$SOX |
350.78 |
+10.55 |
+3.10% |
-14.82% |
| Networking |
$NWX |
220.97 |
+8.56 |
+4.03% |
-21.24% |
| Internet |
$IIX |
269.55 |
+8.82 |
+3.38% |
-12.41% |
| Broker/Dealer |
$XBD |
80.99 |
+1.54 |
+1.94% |
-33.35% |
| Retail |
$RLX |
499.04 |
+6.85 |
+1.39% |
-1.84% |
| Gold & Silver |
$XAU |
186.88 |
+8.09 |
+4.52% |
-17.52% |
| Bank |
$BKX |
35.54 |
+0.37 |
+1.05% |
-31.93% |
| Biotech |
$BTK |
1,124.00 |
+31.93 |
+2.92% |
-13.38% |
|
|
|
 |
Leader's Pullback Looks Normal, However Market Needs Confirmation
Kenneth J. Gruneisen - Passed the CAN SLIM® Master's Exam
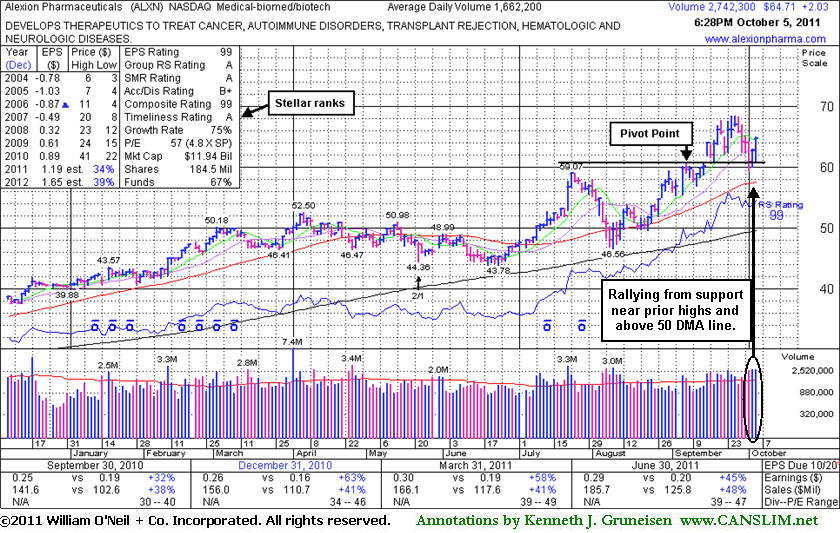
Alexion Pharmaceuticals (ALXN +$2.03 or +3.24% to $64.71) found support and has been rallying up with volume-driven gains after consolidating above prior resistance in the $59-60 area. Recent lows and its 50-day moving average (DMA) line define important near-term support to watch. It was last shown in this FSU section on 9/15/11 with an annotated graph under the headline, "Fundamentally Strong Leader Rises From Cup-With-High-Handle" after featured in yellow in the earlier mid-day report (read here). In that summary members were reminded - "Disciplined investors avoid chasing stocks more than +5% above their prior highs and always limit losses by selling if any stock falls more than -7% from their purchase price. Patience may allow investors to accumulate shares on pullbacks near prior highs rather than chasing it beyond the "max buy" level ($63.85)." Although its pullback appears to be offering patient investors the opportunity they may have been waiting for, the M criteria is now a bigger concern which argues against any new buying efforts until a follow-through day from at least one of the major averages has confirmed a new rally.
Its has stellar ranks, and its strong quarterly and annual earnings history satisfies the C and A criteria. It recently found support above its 200 DMA line. It rose from a cup-with-high-handle pattern as it gapped up on 9/15/11 and hit a new all-time high. Its strong finish above the new pivot point ($60.81) cited was backed by +43% above average volume that confirmed a technical buy signal. The number of top-rated funds owning its shares rose from 882 in Dec '10 to 1,058 in Jun '11, a reassuring sign concerning the I criteria of the fact-based investment system.
|
|
|
Color Codes Explained :
Y - Better candidates highlighted by our
staff of experts.
G - Previously featured
in past reports as yellow but may no longer be buyable under the
guidelines.
***Last / Change / Volume data in this table is the closing quote data***
Symbol/Exchange
Company Name
Industry Group |
PRICE |
CHANGE
(%Change) |
Day High |
Volume
(% DAV)
(% 50 day avg vol) |
52 Wk Hi
% From Hi |
Featured
Date |
Price
Featured |
Pivot Featured |
|
Max Buy |
AAPL
-
NASDAQ
Apple Inc
COMPUTER HARDWARE - Personal Computers
|
$378.25
|
+5.75
1.54% |
$379.82
|
28,076,090
123.83% of 50 DAV
50 DAV is 22,672,200
|
$422.86
-10.55%
|
9/16/2011
|
$399.14
|
PP = $404.60
|
|
MB = $424.83
|
 Most Recent Note - 10/5/2011 12:18:15 PM
G - Damaging distributional action in the past week violated its 50 DMA line and triggered a technical sell signal. It has tested support at its longer-term 200 DMA line this week, meanwhile gains above its 50 DMA line are needed for its outlook to improve.
>>> The latest Featured Stock Update with an annotated graph appeared on 9/19/2011. Click here.
View all notes |
Alert me of new notes |
CANSLIM.net Company Profile |
SEC |
Zacks Reports |
StockTalk |
News |
Chart |
Request a new note
C
A N
S L
I M


|
ALXN
-
NASDAQ
Alexion Pharmaceuticals
DRUGS - Drug Manufacturers - Other
|
$64.71
|
+2.03
3.24% |
$65.00
|
2,757,866
168.24% of 50 DAV
50 DAV is 1,639,200
|
$68.50
-5.53%
|
9/15/2011
|
$63.20
|
PP = $60.81
|
|
MB = $63.85
|
Most Recent Note - 10/5/2011 7:02:16 PM
G - Posted a 2nd consecutive gain backed by above average volume, rising from support near prior resistance in the $59-60 area. See the latest FSU analysis for more details and a new annotated graph.
>>> The latest Featured Stock Update with an annotated graph appeared on 10/5/2011. Click here.
View all notes |
Alert me of new notes |
CANSLIM.net Company Profile |
SEC |
Zacks Reports |
StockTalk |
News |
Chart |
Request a new note
C
A N
S L
I M
|
CELG
-
NASDAQ
Celgene Corp
DRUGS - Drug Manufacturers - Major
|
$64.08
|
+2.77
4.52% |
$64.20
|
4,779,321
109.36% of 50 DAV
50 DAV is 4,370,200
|
$65.86
-2.70%
|
9/16/2011
|
$61.21
|
PP = $62.59
|
|
MB = $65.72
|
Most Recent Note - 10/5/2011 1:31:12 PM
Y - Up considerably today, rebounding above its pivot point without great volume conviction following a positive reversal after slumping near its 50 DMA line on the prior session. See the latest FSU analysis for more details and a new annotated graph.
>>> The latest Featured Stock Update with an annotated graph appeared on 10/4/2011. Click here.
View all notes |
Alert me of new notes |
CANSLIM.net Company Profile |
SEC |
Zacks Reports |
StockTalk |
News |
Chart |
Request a new note
C
A N
S L
I M
|
MG
-
NYSE
Mistras Group Inc
DIVERSIFIED SERVICES - Bulding and Faci;ity Management Services
|
$20.67
|
+0.44
2.17% |
$21.18
|
199,100
95.13% of 50 DAV
50 DAV is 209,300
|
$20.82
-0.72%
|
8/10/2011
|
$17.89
|
PP = $17.58
|
|
MB = $18.46
|
Most Recent Note - 10/5/2011 3:42:11 PM
G - Gain today without great volume conviction helped it reach a new all-time high, rising from a 5-week consolidation that may be considered a base-on-base type pattern, however no new pivot point is being cited. The M criteria argues against new (or add-on) buying efforts until the nascent rally effort is confirmed by a solid follow-through day.
>>> The latest Featured Stock Update with an annotated graph appeared on 9/30/2011. Click here.
View all notes |
Alert me of new notes |
CANSLIM.net Company Profile |
SEC |
Zacks Reports |
StockTalk |
News |
Chart |
Request a new note
C
A N
S L
I M
|
V
-
NYSE
Visa Inc Cl A
DIVERSIFIED SERVICES - Business/Management Services
|
$84.99
|
+0.21
0.25% |
$85.45
|
6,278,437
101.57% of 50 DAV
50 DAV is 6,181,200
|
$94.75
-10.30%
|
9/20/2011
|
$93.91
|
PP = $90.93
|
|
MB = $95.48
|
Most Recent Note - 10/4/2011 7:30:27 PM
G - Managed a positive reversal today. Recent losses violated its 50 DMA line raising concerns. Color code was changed to green, meanwhile a prompt rebound above its short-term average is needed for its outlook to improve. It recently stalled after rallying to a new all-time high.
>>> The latest Featured Stock Update with an annotated graph appeared on 9/21/2011. Click here.
View all notes |
Alert me of new notes |
CANSLIM.net Company Profile |
SEC |
Zacks Reports |
StockTalk |
News |
Chart |
Request a new note
C
A N
S L
I M
|
Symbol/Exchange
Company Name
Industry Group |
PRICE |
CHANGE
(%Change) |
Day High |
Volume
(% DAV)
(% 50 day avg vol) |
52 Wk Hi
% From Hi |
Featured
Date |
Price
Featured |
Pivot Featured |
|
Max Buy |
|
|
|
THESE ARE NOT BUY RECOMMENDATIONS!
Comments contained in the body of this report are technical
opinions only. The material herein has been obtained
from sources believed to be reliable and accurate, however,
its accuracy and completeness cannot be guaranteed.
This site is not an investment advisor, hence it does
not endorse or recommend any securities or other investments.
Any recommendation contained in this report may not
be suitable for all investors and it is not to be deemed
an offer or solicitation on our part with respect to
the purchase or sale of any securities. All trademarks,
service marks and trade names appearing in this report
are the property of their respective owners, and are
likewise used for identification purposes only.
This report is a service available
only to active Paid Premium Members.
You may opt-out of receiving report notifications
at any time. Questions or comments may be submitted
by writing to Premium Membership Services 665 S.E. 10 Street, Suite 201 Deerfield Beach, FL 33441-5634 or by calling 1-800-965-8307
or 954-785-1121.
|
|
|

