You are not logged in.
This means you
CAN ONLY VIEW reports that were published prior to Thursday, April 10, 2025.
You
MUST UPGRADE YOUR MEMBERSHIP if you want to see any current reports.
AFTER MARKET UPDATE - TUESDAY, OCTOBER 4TH, 2011
Previous After Market Report Next After Market Report >>>
|
|
|
|
DOW |
+153.41 |
10,808.71 |
+1.44% |
|
Volume |
1,661,603,680 |
+18% |
|
Volume |
2,961,996,700 |
+19% |
|
NASDAQ |
+68.99 |
2,404.82 |
+2.95% |
|
Advancers |
1,867 |
60% |
|
Advancers |
1,903 |
71% |
|
S&P 500 |
+24.72 |
1,123.95 |
+2.25% |
|
Decliners |
1,236 |
39% |
|
Decliners |
692 |
26% |
|
Russell 2000 |
+39.15 |
648.64 |
+6.42% |
|
52 Wk Highs |
11 |
|
|
52 Wk Highs |
7 |
|
|
S&P 600 |
+22.65 |
360.07 |
+6.71% |
|
52 Wk Lows |
1,198 |
|
|
52 Wk Lows |
764 |
|
|
 |
Indices Make Positive Reversal After S&P 500 Reaches Bear Market Threshold
Kenneth J. Gruneisen - Passed the CAN SLIM® Master's Exam
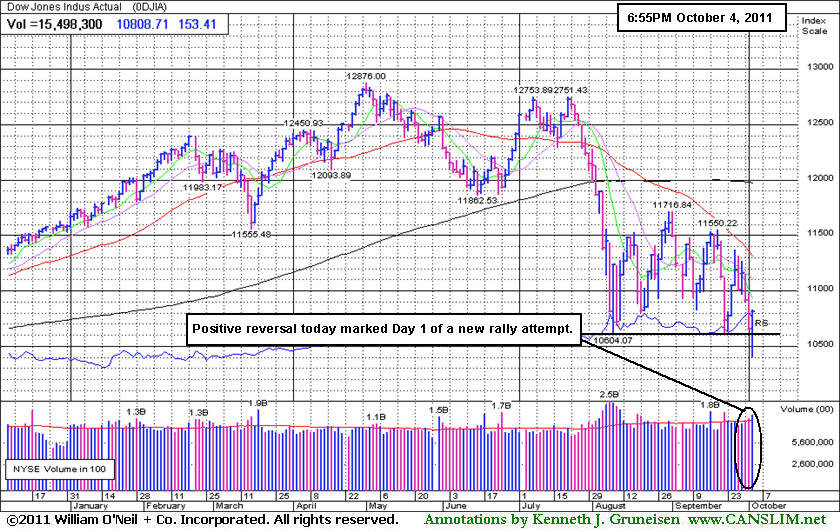
A furious rally late in the day propelled the stock market higher after the S&P 500 survived an early journey into bear market territory. The Dow fell as many as 260 points in the first hour, and at its lowest level today, the S&P 500 was down -21.2% from this year's high. The Dow Jones Industrial Average, S&P 500 Index, and the Nasdaq Composite Index collectively managed to make impressive positive reversals after first plunging to new lows for the year. Tuesday's session had higher volume totals reported on the NYSE and on the Nasdaq exchange, and the finish near the session highs suggested that the market was rebounding and rising due to better institutional buying demand. Breadth was positive as advancing issues beat decliners about 3-2 on the NYSE and by nearly 3-1 on the Nasdaq exchange. The new 52-week lows totals on both the Nasdaq exchange and the NYSE swelled even higher and new lows substantially outnumbered new 52-week highs. The new highs total on the Nasdaq exchange remained in the single digits. There were only 2 high-ranked companies from the CANSLIM.net Leaders List that made a new 52-week high and appeared on the CANSLIM.net BreakOuts Page, up from 1 on the prior session. There were gains for 4 of the 6 high-ranked companies currently included on the Featured Stocks Page, a list that has been recently been shrinking.
A report on October factory orders was weaker than expected. Orders fell 0.2%, but analysts were expecting no change. The Dow and Nasdaq continued their descent this morning as European governments hinted bondholders may be saddled with bigger losses on Greek debt. The S&P 500 Index extended its decline from this year's high to more than 20%, the common definition of a bear market.
Federal Reserve Chairman Ben Bernanke told cautioned lawmakers against budget moves that would harm what he called a "sluggish" recovery. Bernanke's comments appeared to give the market a lift when he told Congress the Fed is prepared to take additional steps to boost a faltering U.S. recovery "as appropriate." Bernanke urged Congress to take action as well.
Deutsche Bank AG (DB +4.93%) said today it will miss previous earnings targets. It erased an early loss and rallied as financial stocks bounced back from initial declines, even as European governments hinted bondholders may be saddled with bigger losses on Greek debt. Greece's finance minister said the country has enough cash to operate until mid-November.
Exxon Mobil Corp (XOM +2.36%) overcame early weakness after oil initially fell to its lowest price in more than a year in New York on signs of rising U.S. supplies and production from Libya. Ford Motor Company (F +7.58%) rallied after the automaker said it has committed to add 12,000 hourly jobs in its U.S. plants by 2015 as part of a tentative agreement with the United Auto Workers. AMR Corp (AMR +20.71%), parent of American Airlines, climbed back from new lows on word the airline is set to resume contract negotiations with pilots after shares fell the most since 2003 Monday on concern the company may file for bankruptcy.
Apple Inc (AAPL -0.56%) unveiled its first new product under new chief executive Tim Cook, and investors were not impressed. Cook introduced an iPhone with a stronger processor and an improved camera. Qualcomm (QCOM +3.74%) and Broadcom Corp (BRCM +4.70%) rose while iPhone component makers had good days.
The market environment (M criteria) is clearly under pressure and back in a correction after a heavy wave of distributional action. The Q3 2011 Webcast (aired on September 28th) is now available "ON DEMAND" - (CLICK HERE) It provides an informative review of current market conditions, leading groups, and best buy candidates. All upgraded members are eligible to access the webcast presentation at no additional cost! Via the Premium Member Homepage links to all prior reports and webcasts are always available.
PICTURED: The Dow Jones Industrial Average managed a positive reversal after initially slumping to a new low -19.2% off its May 2nd high.
|
 Kenneth J. Gruneisen started out as a licensed stockbroker in August 1987, a couple of months prior to the historic stock market crash that took the Dow Jones Industrial Average down -22.6% in a single day. He has published daily fact-based fundamental and technical analysis on high-ranked stocks online for two decades. Through FACTBASEDINVESTING.COM, Kenneth provides educational articles, news, market commentary, and other information regarding proven investment systems that work in good times and bad.
Comments contained in the body of this report are technical opinions only and are not necessarily those of Gruneisen Growth Corp. The material herein has been obtained from sources believed to be reliable and accurate, however, its accuracy and completeness cannot be guaranteed. Our firm, employees, and customers may effect transactions, including transactions contrary to any recommendation herein, or have positions in the securities mentioned herein or options with respect thereto. Any recommendation contained in this report may not be suitable for all investors and it is not to be deemed an offer or solicitation on our part with respect to the purchase or sale of any securities. |
|
 |
Financial, Tech, Energy Groups Led Gainers
Kenneth J. Gruneisen - Passed the CAN SLIM® Master's Exam
The Bank Index ($BKX +4.52%) and Broker/Dealer Index ($XBD +4.60%) helped spearhead a turnaround and underpinned the major averages gains after overcoming early weakness. The tech sectore saw unanimous gains from the Semiconductor Index ($SOX +4.25%), Networking Index ($NWX +4.76%), Biotechnology Index ($BTK +3.93%), and Internet Index ($IIX +3.10%). The Retail Index ($RLX +2.48%) posted a solid gain and gains in energy-related shares lifted the Integrated Oil Index ($XOI +3.11%) and Oil Services Index ($OSX +3.47%). The Healthcare Index ($HMO +1.38%) posted a smaller gain and the Gold & Silver Index ($XAU -2.29%) finished the day lower, making it standout as a clear laggard.
Charts courtesy www.stockcharts.com
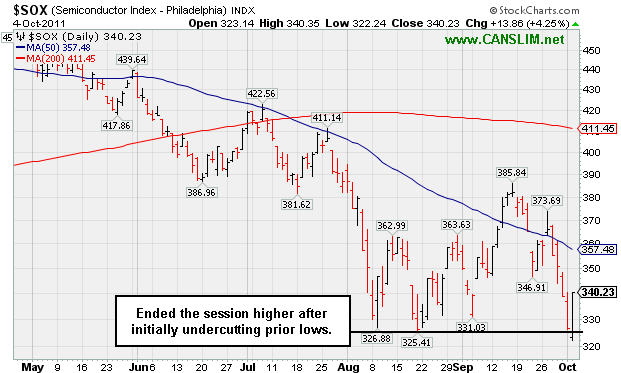
PICTURED: The Semiconductor Index ($SOX +4.25%) ended the session higher after initially undercutting prior lows.
| Oil Services |
$OSX |
188.34 |
+6.32 |
+3.47% |
-23.16% |
| Healthcare |
$HMO |
1,786.48 |
+24.38 |
+1.38% |
+5.58% |
| Integrated Oil |
$XOI |
1,026.22 |
+31.00 |
+3.11% |
-15.41% |
| Semiconductor |
$SOX |
340.23 |
+13.86 |
+4.25% |
-17.38% |
| Networking |
$NWX |
212.42 |
+9.66 |
+4.76% |
-24.29% |
| Internet |
$IIX |
260.73 |
+7.83 |
+3.10% |
-15.27% |
| Broker/Dealer |
$XBD |
79.45 |
+3.50 |
+4.60% |
-34.62% |
| Retail |
$RLX |
492.19 |
+11.93 |
+2.48% |
-3.18% |
| Gold & Silver |
$XAU |
178.79 |
-4.19 |
-2.29% |
-21.09% |
| Bank |
$BKX |
35.17 |
+1.52 |
+4.52% |
-32.64% |
| Biotech |
$BTK |
1,092.07 |
+41.30 |
+3.93% |
-15.84% |
|
|
|
 |
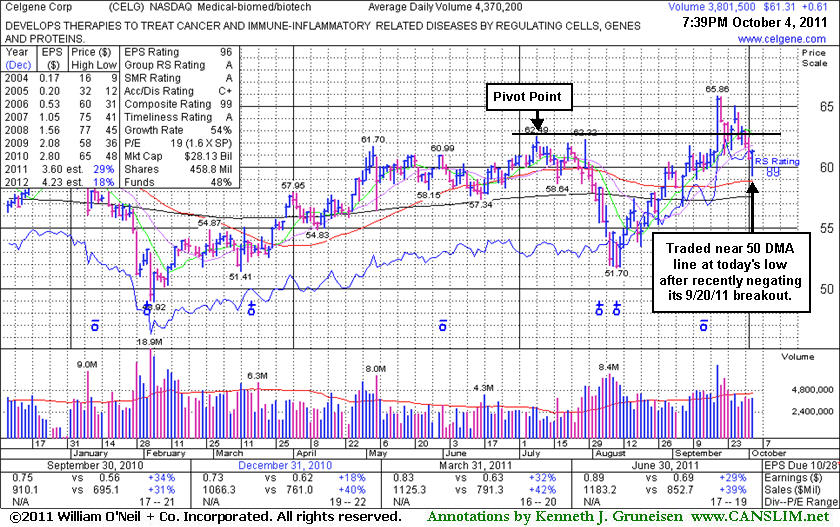
Slumped to Close in Prior Base Following Recent Breakout
Kenneth J. Gruneisen - Passed the CAN SLIM® Master's Exam
Celgene Corp (CELG +$0.61 or +1.00% to $61.31) managed a positive reversal today for a small gain on below average volume after initially slumping further below its pivot point to trade near its 50-day moving average (DMA) line. Disciplined investors may likely have been prompted to sell after a pullback of more than -7% at the lows today. Its Accumulation/Distribution Rating of C+ is actually up from a D+ at the time of its last appearance in this FSU section on 9/16/11 with an annotated graph under the headline, "Fundamentals Are Strong While Technical Action Has Yet To Confirm". Then it was perched within close striking distance of previously stubborn resistance in the $62 area. Fresh proof of institutional buying demand triggered a technical buy signal on 9/20/11, but it abruptly pulled back near previously stubborn resistance in the $62 area and then later slumped back into its prior base by closing under prior highs.
Keep in mind that a new confirmed rally with a follow-through day is needed to confirm that the market (M criteria) is again in a confirmed uptrend before any new buying efforts may be justified under the fact-based system's guidelines. In a confirmed rally investors' odds are more favorable, meanwhile, it is a good time to study up and keep high-ranked leaders like this one on a watchlist of most worthy buy candidates. CELG was featured in the August 2008 CANSLIM.net News (read here).
 |
|
|
Color Codes Explained :
Y - Better candidates highlighted by our
staff of experts.
G - Previously featured
in past reports as yellow but may no longer be buyable under the
guidelines.
***Last / Change / Volume data in this table is the closing quote data***
Symbol/Exchange
Company Name
Industry Group |
PRICE |
CHANGE
(%Change) |
Day High |
Volume
(% DAV)
(% 50 day avg vol) |
52 Wk Hi
% From Hi |
Featured
Date |
Price
Featured |
Pivot Featured |
|
Max Buy |
AAPL
-
NASDAQ
Apple Inc
COMPUTER HARDWARE - Personal Computers
|
$372.50
|
-2.10
-0.56% |
$381.80
|
44,040,532
194.25% of 50 DAV
50 DAV is 22,672,200
|
$422.86
-11.91%
|
9/16/2011
|
$399.14
|
PP = $404.60
|
|
MB = $424.83
|
 Most Recent Note - 10/4/2011 7:23:08 PM
G - Finished in the upper third of its intra-day range today with a small loss on heavy volume after trading near its 200 DMA line at the session lows. Gains above its 50 DMA line are needed for its outlook to improve.
>>> The latest Featured Stock Update with an annotated graph appeared on 9/19/2011. Click here.
View all notes |
Alert me of new notes |
CANSLIM.net Company Profile |
SEC |
Zacks Reports |
StockTalk |
News |
Chart |
Request a new note
C
A N
S L
I M


|
ALXN
-
NASDAQ
Alexion Pharmaceuticals
DRUGS - Drug Manufacturers - Other
|
$62.68
|
+1.81
2.97% |
$62.99
|
2,772,419
169.13% of 50 DAV
50 DAV is 1,639,200
|
$68.50
-8.50%
|
9/15/2011
|
$63.20
|
PP = $60.81
|
|
MB = $63.85
|
Most Recent Note - 10/4/2011 7:23:46 PM
G - Posted a gain today after pulling back near prior resistance in the $59-60 area noted as initial support to watch. Heavier distributional volume was behind its 4th consecutive loss on the prior session.
>>> The latest Featured Stock Update with an annotated graph appeared on 9/15/2011. Click here.
View all notes |
Alert me of new notes |
CANSLIM.net Company Profile |
SEC |
Zacks Reports |
StockTalk |
News |
Chart |
Request a new note
C
A N
S L
I M
|
CELG
-
NASDAQ
Celgene Corp
DRUGS - Drug Manufacturers - Major
|
$61.31
|
+0.61
1.00% |
$61.44
|
3,862,311
88.38% of 50 DAV
50 DAV is 4,370,200
|
$65.86
-6.91%
|
9/16/2011
|
$61.21
|
PP = $62.59
|
|
MB = $65.72
|
Most Recent Note - 10/4/2011 7:25:31 PM
Y - Managed a positive reversal today for a small gain on below average volume after initially slumping further below its pivot point to trade near its 50 DMA line. Following its breakout on 9/20/11 it abruptly pulled back near previously stubborn resistance in the $62 area which has acted as a support level.
>>> The latest Featured Stock Update with an annotated graph appeared on 10/4/2011. Click here.
View all notes |
Alert me of new notes |
CANSLIM.net Company Profile |
SEC |
Zacks Reports |
StockTalk |
News |
Chart |
Request a new note
C
A N
S L
I M
|
MA
-
NYSE
Mastercard Inc Cl A
DIVERSIFIED SERVICES - Business/Management Services
|
$307.66
|
-3.22
-1.04% |
$308.67
|
2,670,179
161.93% of 50 DAV
50 DAV is 1,649,000
|
$361.94
-15.00%
|
8/3/2011
|
$324.82
|
PP = $322.38
|
|
MB = $338.50
|
Most Recent Note - 10/4/2011 7:27:44 PM
Finished near the session high today with a small loss on above average volume after a gap down. Damaging losses recently triggered technical sell signals. Based on weak action it will be dropped from the Featured Stocks list tonight. A rebound above its short-term average is needed for its outlook to improve.
>>> The latest Featured Stock Update with an annotated graph appeared on 9/12/2011. Click here.
View all notes |
Alert me of new notes |
CANSLIM.net Company Profile |
SEC |
Zacks Reports |
StockTalk |
News |
Chart |
Request a new note
C
A N
S L
I M
|
MG
-
NYSE
Mistras Group Inc
DIVERSIFIED SERVICES - Bulding and Faci;ity Management Services
|
$20.23
|
+2.23
12.39% |
$20.30
|
200,030
95.57% of 50 DAV
50 DAV is 209,300
|
$20.82
-2.83%
|
8/10/2011
|
$17.89
|
PP = $17.58
|
|
MB = $18.46
|
Most Recent Note - 10/4/2011 7:29:22 PM
G - Rallied well above its 50 DMA line with today's gain and challenged its prior highs. See the latest FSU analysis for more details and a new annotated daily graph.
>>> The latest Featured Stock Update with an annotated graph appeared on 9/30/2011. Click here.
View all notes |
Alert me of new notes |
CANSLIM.net Company Profile |
SEC |
Zacks Reports |
StockTalk |
News |
Chart |
Request a new note
C
A N
S L
I M
|
Symbol/Exchange
Company Name
Industry Group |
PRICE |
CHANGE
(%Change) |
Day High |
Volume
(% DAV)
(% 50 day avg vol) |
52 Wk Hi
% From Hi |
Featured
Date |
Price
Featured |
Pivot Featured |
|
Max Buy |
V
-
NYSE
Visa Inc Cl A
DIVERSIFIED SERVICES - Business/Management Services
|
$84.78
|
+0.52
0.62% |
$85.09
|
7,853,870
127.06% of 50 DAV
50 DAV is 6,181,200
|
$94.75
-10.52%
|
9/20/2011
|
$93.91
|
PP = $90.93
|
|
MB = $95.48
|
Most Recent Note - 10/4/2011 7:30:27 PM
G - Managed a positive reversal today. Recent losses violated its 50 DMA line raising concerns. Color code was changed to green, meanwhile a prompt rebound above its short-term average is needed for its outlook to improve. It recently stalled after rallying to a new all-time high.
>>> The latest Featured Stock Update with an annotated graph appeared on 9/21/2011. Click here.
View all notes |
Alert me of new notes |
CANSLIM.net Company Profile |
SEC |
Zacks Reports |
StockTalk |
News |
Chart |
Request a new note
C
A N
S L
I M
|
|
|
|
THESE ARE NOT BUY RECOMMENDATIONS!
Comments contained in the body of this report are technical
opinions only. The material herein has been obtained
from sources believed to be reliable and accurate, however,
its accuracy and completeness cannot be guaranteed.
This site is not an investment advisor, hence it does
not endorse or recommend any securities or other investments.
Any recommendation contained in this report may not
be suitable for all investors and it is not to be deemed
an offer or solicitation on our part with respect to
the purchase or sale of any securities. All trademarks,
service marks and trade names appearing in this report
are the property of their respective owners, and are
likewise used for identification purposes only.
This report is a service available
only to active Paid Premium Members.
You may opt-out of receiving report notifications
at any time. Questions or comments may be submitted
by writing to Premium Membership Services 665 S.E. 10 Street, Suite 201 Deerfield Beach, FL 33441-5634 or by calling 1-800-965-8307
or 954-785-1121.
|
|
|

