You are not logged in.
This means you
CAN ONLY VIEW reports that were published prior to Tuesday, April 22, 2025.
You
MUST UPGRADE YOUR MEMBERSHIP if you want to see any current reports.
AFTER MARKET UPDATE - THURSDAY, OCTOBER 6TH, 2011
Previous After Market Report Next After Market Report >>>
|
|
|
|
DOW |
+183.38 |
11,123.33 |
+1.68% |
|
Volume |
1,117,433,570 |
-6% |
|
Volume |
2,157,988,010 |
-11% |
|
NASDAQ |
+46.31 |
2,506.82 |
+1.88% |
|
Advancers |
2,589 |
83% |
|
Advancers |
1,932 |
73% |
|
S&P 500 |
+20.94 |
1,164.97 |
+1.83% |
|
Decliners |
465 |
15% |
|
Decliners |
598 |
23% |
|
Russell 2000 |
+15.69 |
673.80 |
+2.38% |
|
52 Wk Highs |
5 |
|
|
52 Wk Highs |
10 |
|
|
S&P 600 |
+8.85 |
373.27 |
+2.43% |
|
52 Wk Lows |
20 |
|
|
52 Wk Lows |
49 |
|
|
 |
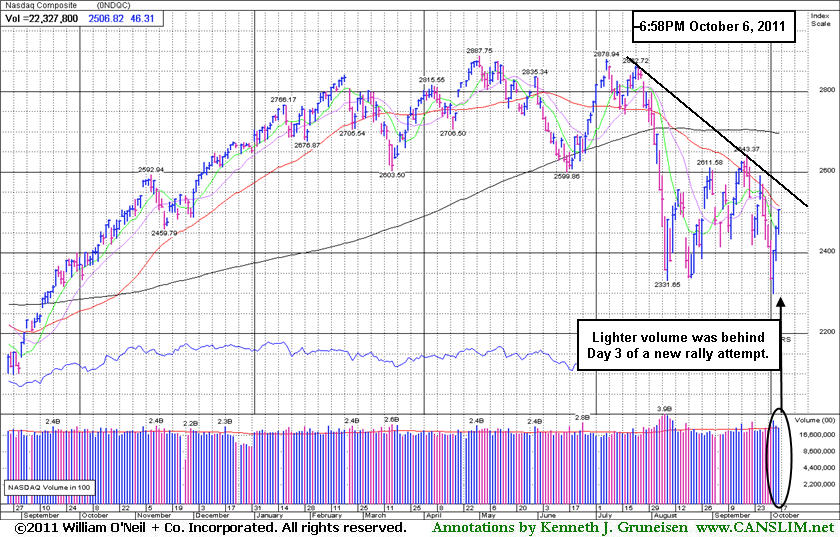
Major Averages Rise Again With Lighter Volume
Kenneth J. Gruneisen - Passed the CAN SLIM® Master's Exam
The major averages worked their way higher through another session, but Thurday's 3rd consecutive session of gains were backed by even lighter volume totals reported on the NYSE and on the Nasdaq exchange, revealing a lack of institutional buying demand. Breadth was positive as advancing issues beat decliners by 5-1 on the NYSE and by more than 3-1 on the Nasdaq exchange. A great contraction occurred in the new 52-week lows totals on both the Nasdaq exchange and the NYSE has occured since the major averages halted their recent slide after sinking to new 2011 lows. However new lows still outnumbered new 52-week highs on both major exchanges. There was only 1 high-ranked company from the CANSLIM.net Leaders List that made a new 52-week high and appeared on the CANSLIM.net BreakOuts Page, down from 2 on the prior session. There were gains for only 2 of the 5 high-ranked companies currently included on the Featured Stocks Page, a list that has been recently been shrinking.
September retail sales surprised investors and the market anticipated more progress on the European debt crisis. Financial stocks led the advance after the European Central Bank said it would buy bonds issued by banks, making it easier for them to lend. Bank of America Corp (BAC +8.8%) and Morgan Stanley (MS +4.8%) rose. Data on U.S. initial jobless claims were another plus. New claims increased less than forecast to 401,000 last week.
Retail stocks rang up gains after many posted better-than-expected sales in the important back-to-school month of September. Target gained 4.3% to 51.91. Apple Inc (AAPL) fluctuated between gains and losses as investors pondered the company's future following the death of Steve Jobs (more on AAPL in this evening's Featured Stock Update (FSU) section. Corning jumped 7.1% to 13.50. The company hiked its dividend and approved a share buyback plan.
The market environment (M criteria) is clearly under pressure and back in a correction after a heavy wave of distributional action. Disciplined investors are now watching for a follow-through day (FTD) of solid gains on higher volume from at least one of the major averages coupled with an expansion in the number of stocks hitting new highs. Historic studies suggest that it is most ideal for a FTD to come between Day 4-7 of a new rally attempt.
The Q3 2011 Webcast (aired on September 28th) is now available "ON DEMAND" - (CLICK HERE) It provides an informative review of current market conditions, leading groups, and best buy candidates. All upgraded members are eligible to access the webcast presentation at no additional cost! Via the Premium Member Homepage links to all prior reports and webcasts are always available.
PICTURED: There was lighter volume behid Day 3 of the new rally attempt for the Nasdaq Composite Index. It faces resistance at its 50-day moving average (DMA).
|
 Kenneth J. Gruneisen started out as a licensed stockbroker in August 1987, a couple of months prior to the historic stock market crash that took the Dow Jones Industrial Average down -22.6% in a single day. He has published daily fact-based fundamental and technical analysis on high-ranked stocks online for two decades. Through FACTBASEDINVESTING.COM, Kenneth provides educational articles, news, market commentary, and other information regarding proven investment systems that work in good times and bad.
Comments contained in the body of this report are technical opinions only and are not necessarily those of Gruneisen Growth Corp. The material herein has been obtained from sources believed to be reliable and accurate, however, its accuracy and completeness cannot be guaranteed. Our firm, employees, and customers may effect transactions, including transactions contrary to any recommendation herein, or have positions in the securities mentioned herein or options with respect thereto. Any recommendation contained in this report may not be suitable for all investors and it is not to be deemed an offer or solicitation on our part with respect to the purchase or sale of any securities. |
|
 |
Unanimous Gains in IGW Section Today
Kenneth J. Gruneisen - Passed the CAN SLIM® Master's Exam
There were unanimous gains from all groups regularly covered in this IGW section: Semiconductor Index ($SOX +1.25%), Integrated Oil Index ($XOI +1.60%), Healthcare Index ($HMO +2.44%),Gold & Silver Index ($XAU +2.57%), Biotechnology Index ($BTK +2.62%), Internet Index ($IIX +2.73%), Broker/Dealer Index ($XBD +2.74%), Networking Index ($NWX +2.96%), Oil Services Index ($OSX +4.09%), and Bank Index ($BKX +4.56%).
Charts courtesy www.stockcharts.com
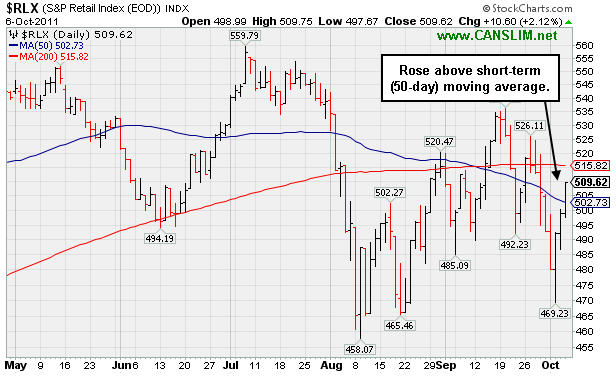
PICTURED: The Retail Index ($RLX +2.12%) rose above its 50 DMA line but faces resistance at its 200 DMA line.
| Oil Services |
$OSX |
200.60 |
+7.88 |
+4.09% |
-18.16% |
| Healthcare |
$HMO |
1,870.45 |
+44.47 |
+2.44% |
+10.55% |
| Integrated Oil |
$XOI |
1,078.34 |
+16.99 |
+1.60% |
-11.11% |
| Semiconductor |
$SOX |
355.17 |
+4.39 |
+1.25% |
-13.76% |
| Networking |
$NWX |
227.52 |
+6.55 |
+2.96% |
-18.90% |
| Internet |
$IIX |
276.90 |
+7.35 |
+2.73% |
-10.02% |
| Broker/Dealer |
$XBD |
83.21 |
+2.22 |
+2.74% |
-31.52% |
| Retail |
$RLX |
509.62 |
+10.60 |
+2.12% |
+0.24% |
| Gold & Silver |
$XAU |
191.68 |
+4.80 |
+2.57% |
-15.40% |
| Bank |
$BKX |
37.16 |
+1.62 |
+4.56% |
-28.83% |
| Biotech |
$BTK |
1,153.47 |
+29.47 |
+2.62% |
-11.11% |
|
|
|
 |
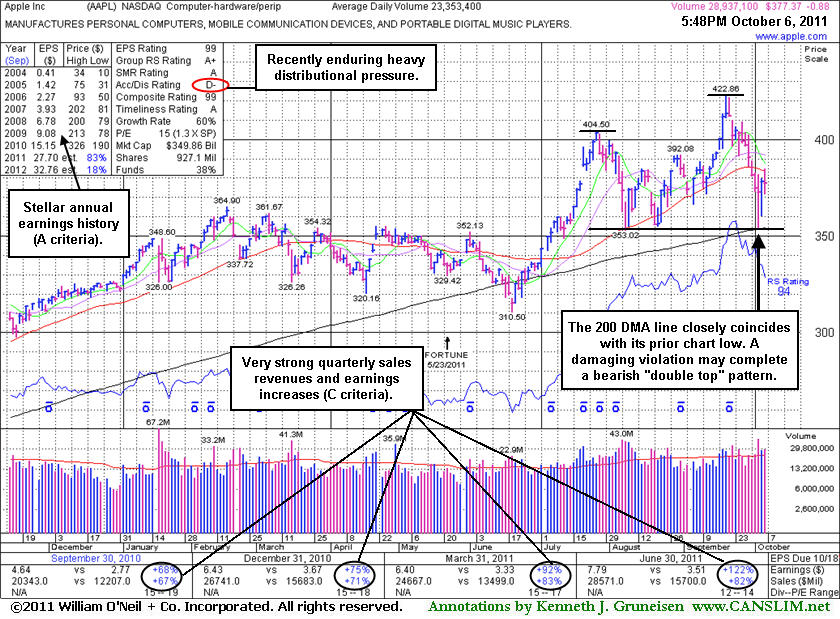
Fundamentally Strong Tech Leader Forming Possible "Double Top"
Kenneth J. Gruneisen - Passed the CAN SLIM® Master's Exam
Via the Company Profile pages members can review any stock's extensive history of prior analysis and notes via a tab labeled "Featured Articles and Graphs". It is a good idea to review prior reports that have been published and do some of your own "homework" to be familiar with any companies you might maintain on an active watchlist of possible buy candidates. Ongoing coverage also acknowledges technical sell signals and flaws which might be of concern. The annotated graph below shows a possible "double top" pattern which would be completed and trigger a technical sell signal by any violation of the mid-point (low point) between 2 prior chart highs, the second of which was higher after half-hearted (volume-wise) gains.
Apple Inc's (AAPL +$3.61 or +0.95% to $381.86) co-founder Steve Jobs lit up headlines with news of his passing at the age of 56. Shares of the well-known technology leader tried to rally but encountered resistance after rising near its 50-day moving average (DMA) line. Damaging losses triggered a technical sell signal and it tested support at its longer-term 200 DMA line this week. Prior reports cautioned "With the largest market cap of all publicly traded firms, AAPL does not fit the mold of a small growth firm unknown by the institutional crowd which would be more typical of the winning models of the fact-based investment system."
AAPL made its prior appearance in this FSU section on 9/19/11 with an annotated daily graph under the the headline, "Volume Requirement Not Met As Apple Hit New High", as it hit new 52-week and all-time highs with +35% above average volume behind a 6th consecutive gain. It had found support near its 50-day moving average (DMA) line and prior chart highs during its prior 8-week consolidation. The 9/16/11 mid-day report (read here) included it highlighted in yellow with pivot point based on its 52-week high plus 10 cents. The mid-day report earlier that day had cautiously noted - "A gain with at least +40% above average volume while rising above its pivot point may trigger a technical buy signal."
The 9/16/11 FSU analysis also told members - "Disciplined investors use a tactic called "pyramiding" to avoid chasing stocks more than +5% above prior highs. Today's gain today tested investors' discipline, and they should appreciate the volume shortfall's significance. It clearly hints that, at the late stage of the tech leader's ongoing advance, there may not be very many institutional investors willing to 'finally' turn bullish on it enough to decide to become buyers over other great growth candidates which might be more fleet footed."
AAPL recently rallied after reporting very strong earnings +122% on +82% sales revenues for the quarter ended June 30, 2011 versus the year ago period. Stellar earnings track record that solidly satisfies the C and A criteria. However, it is already heavily owned by the institutional crowd, with 4,374 top-rated funds reportedly owning its shares as of Jun '11.
It had been dropped from the Featured Stocks list on 8/20/10 after its last appearance in this FSU section (8/09/10) under the headline, "Quiet Consolidation Above 50 DMA Line". An annotated graph and detailed analysis in the 6/17/10 report under the headline "Saucy Details On Apple Worth Reviewing" summarized important details and some of the prior coverage published concerning of this long-time favorite. Members who have not followed the ongoing analysis provided should take time to review what has been written.
|
|
|
Color Codes Explained :
Y - Better candidates highlighted by our
staff of experts.
G - Previously featured
in past reports as yellow but may no longer be buyable under the
guidelines.
***Last / Change / Volume data in this table is the closing quote data***
Symbol/Exchange
Company Name
Industry Group |
PRICE |
CHANGE
(%Change) |
Day High |
Volume
(% DAV)
(% 50 day avg vol) |
52 Wk Hi
% From Hi |
Featured
Date |
Price
Featured |
Pivot Featured |
|
Max Buy |
AAPL
-
NASDAQ
Apple Inc
COMPUTER HARDWARE - Personal Computers
|
$377.37
|
-0.88
-0.23% |
$384.78
|
29,016,245
124.25% of 50 DAV
50 DAV is 23,353,400
|
$422.86
-10.76%
|
9/16/2011
|
$399.14
|
PP = $404.60
|
|
MB = $424.83
|
 Most Recent Note - 10/6/2011 12:16:33 PM
G - Rising near its 50 DMA line which may now act as a resistance level. Damaging losses triggered a technical sell signal and it tested support at its longer-term 200 DMA line this week.
>>> The latest Featured Stock Update with an annotated graph appeared on 10/6/2011. Click here.
View all notes |
Alert me of new notes |
CANSLIM.net Company Profile |
SEC |
Zacks Reports |
StockTalk |
News |
Chart |
Request a new note
C
A N
S L
I M


|
ALXN
-
NASDAQ
Alexion Pharmaceuticals
DRUGS - Drug Manufacturers - Other
|
$65.64
|
+0.93
1.44% |
$65.87
|
1,182,694
69.64% of 50 DAV
50 DAV is 1,698,400
|
$68.50
-4.18%
|
9/15/2011
|
$63.20
|
PP = $60.81
|
|
MB = $63.85
|
Most Recent Note - 10/6/2011 5:03:46 PM
G - Following 2 volume driven gains lighter volume was behind today's 3rd consecutive gain for this high-ranked Medical - Biomed/Biotech group leader. Support to watch includes prior resistance in the $59-60 area and its upwardly tilted 50 DMA line. See the latest FSU analysis for more details and a new annotated graph.
>>> The latest Featured Stock Update with an annotated graph appeared on 10/5/2011. Click here.
View all notes |
Alert me of new notes |
CANSLIM.net Company Profile |
SEC |
Zacks Reports |
StockTalk |
News |
Chart |
Request a new note
C
A N
S L
I M
|
CELG
-
NASDAQ
Celgene Corp
DRUGS - Drug Manufacturers - Major
|
$63.35
|
-0.73
-1.14% |
$63.80
|
4,313,642
96.86% of 50 DAV
50 DAV is 4,453,700
|
$65.86
-3.81%
|
9/16/2011
|
$61.21
|
PP = $62.59
|
|
MB = $65.72
|
Most Recent Note - 10/6/2011 5:06:23 PM
Y - Small loss today on lighter volume followed a prompt rebound above its pivot point following a positive reversal on 10/04/11 after slumping near its 50 DMA line.
>>> The latest Featured Stock Update with an annotated graph appeared on 10/4/2011. Click here.
View all notes |
Alert me of new notes |
CANSLIM.net Company Profile |
SEC |
Zacks Reports |
StockTalk |
News |
Chart |
Request a new note
C
A N
S L
I M
|
MG
-
NYSE
Mistras Group Inc
DIVERSIFIED SERVICES - Bulding and Faci;ity Management Services
|
$19.80
|
-0.87
-4.21% |
$20.41
|
278,509
129.78% of 50 DAV
50 DAV is 214,600
|
$21.18
-6.52%
|
8/10/2011
|
$17.89
|
PP = $17.58
|
|
MB = $18.46
|
Most Recent Note - 10/6/2011 5:22:59 PM
G - Gapped down today and suffered a loss with above average volume indicative of distributional pressure. On the prior session it touched a new all-time high, rising without great volume conviction from a 5-week consolidation that may be considered a "base-on-base" type pattern, however no new pivot point was cited. Additionally, the M criteria argues against new (or add-on) buying efforts in otherwise worthy buy candidates until the nascent new rally effort is confirmed by a solid follow-through day.
>>> The latest Featured Stock Update with an annotated graph appeared on 9/30/2011. Click here.
View all notes |
Alert me of new notes |
CANSLIM.net Company Profile |
SEC |
Zacks Reports |
StockTalk |
News |
Chart |
Request a new note
C
A N
S L
I M
|
V
-
NYSE
Visa Inc Cl A
DIVERSIFIED SERVICES - Business/Management Services
|
$87.13
|
+2.14
2.52% |
$87.28
|
4,871,537
76.80% of 50 DAV
50 DAV is 6,343,500
|
$94.75
-8.04%
|
9/20/2011
|
$93.91
|
PP = $90.93
|
|
MB = $95.48
|
Most Recent Note - 10/6/2011 5:34:14 PM
G - Following a positive reversal on 10/04/11 its subsequent 2 gains have lacked volume conviction. Today's gain helped it rise above its 50 DMA line which recently began sloping downward. It recently stalled after rallying to a new all-time high. Mastercard Inc (MA), its peer in the Finance - Credit Card/Payment Processing group, remains below its 50 DMA line after recently dropped from the Featured Stocks list.
>>> The latest Featured Stock Update with an annotated graph appeared on 9/21/2011. Click here.
View all notes |
Alert me of new notes |
CANSLIM.net Company Profile |
SEC |
Zacks Reports |
StockTalk |
News |
Chart |
Request a new note
C
A N
S L
I M
|
Symbol/Exchange
Company Name
Industry Group |
PRICE |
CHANGE
(%Change) |
Day High |
Volume
(% DAV)
(% 50 day avg vol) |
52 Wk Hi
% From Hi |
Featured
Date |
Price
Featured |
Pivot Featured |
|
Max Buy |
|
|
|
THESE ARE NOT BUY RECOMMENDATIONS!
Comments contained in the body of this report are technical
opinions only. The material herein has been obtained
from sources believed to be reliable and accurate, however,
its accuracy and completeness cannot be guaranteed.
This site is not an investment advisor, hence it does
not endorse or recommend any securities or other investments.
Any recommendation contained in this report may not
be suitable for all investors and it is not to be deemed
an offer or solicitation on our part with respect to
the purchase or sale of any securities. All trademarks,
service marks and trade names appearing in this report
are the property of their respective owners, and are
likewise used for identification purposes only.
This report is a service available
only to active Paid Premium Members.
You may opt-out of receiving report notifications
at any time. Questions or comments may be submitted
by writing to Premium Membership Services 665 S.E. 10 Street, Suite 201 Deerfield Beach, FL 33441-5634 or by calling 1-800-965-8307
or 954-785-1121.
|
|
|

