You are not logged in.
This means you
CAN ONLY VIEW reports that were published prior to Saturday, March 22, 2025.
You
MUST UPGRADE YOUR MEMBERSHIP if you want to see any current reports.
AFTER MARKET UPDATE - TUESDAY, SEPTEMBER 27TH, 2011
Previous After Market Report Next After Market Report >>>
|
|
|
|
DOW |
+146.83 |
11,190.69 |
+1.33% |
|
Volume |
1,190,103,830 |
+3% |
|
Volume |
2,061,804,460 |
+6% |
|
NASDAQ |
+30.14 |
2,546.83 |
+1.20% |
|
Advancers |
2,496 |
80% |
|
Advancers |
1,963 |
73% |
|
S&P 500 |
+12.43 |
1,175.38 |
+1.07% |
|
Decliners |
565 |
18% |
|
Decliners |
662 |
25% |
|
Russell 2000 |
+14.61 |
680.23 |
+2.19% |
|
52 Wk Highs |
21 |
|
|
52 Wk Highs |
16 |
|
|
S&P 600 |
+8.20 |
373.63 |
+2.24% |
|
52 Wk Lows |
23 |
|
|
52 Wk Lows |
79 |
|
|
 |
Stocks Continued Rally Effort But Finished Off Session Highs
Kenneth J. Gruneisen - Passed the CAN SLIM® Master's Exam
The Dow Industrials, S&P 500 Index, and the Nasdaq Composite Index picked up where they left off Monday afternoon, charging higher on Tuesday morning, however a late-afternoon slump ate into the session's gains. Higher volume totals were reported on the NYSE and on the Nasdaq exchange. Breadth was positive as advancing issues beat decliners by more than 4-1 on the NYSE and by 3-1 on the Nasdaq exchange. The new 52-week lows totals still outnumbered new 52-week highs on both the Nasdaq exchange and the NYSE. There were 12 high-ranked companies from the CANSLIM.net Leaders List that made new 52-week highs and appeared on the CANSLIM.net BreakOuts Page, up from 2 on the prior session. There were gains from 9 of the 15 high-ranked companies currently included on the Featured Stocks Page.
U.S economic reports were lackluster. Confidence among U.S. consumers rose less than forecast in September, as a measure of the difficulty of finding jobs rose to the highest in almost three decades. The S&P/Case-Shiller index of property values in 20 cities fell -4.1% from July 2010. That was a smaller decline than forecast. It may be a sign that bank delays in processing foreclosures have temporarily slowed the slump in real-estate values. The Treasury's $35 billion auction of two-year notes produced the highest demand in a year as demand for safety remained. The 10-year Treasury note was down 24/32 to yield 1.98%.
Stocks extended Monday's rally on increasing hopes that Europe will take action to prevent the debt crisis from worsening. Attention was on a meeting between the prime minister of Greece and the chancellor of Germany. The meeting comes before a key vote in the German parliament later this week on a new bailout plan for Greece. The market also may have been somewhat relieved by a vote in the U.S. Senate to avoid a government shutdown. The Senate reached a bipartisan deal on stopgap spending to defuse a fight over aid to victims of natural disasters. However, Tuesday's sizable rally lost ground in the final hour as the stock market remained vulnerable to headlines out of Europe. Investors anticipated a more ambitious plan to contain the European debt crisis. Much of the early gain evaporated following a report that some euro companies are asking private creditors to take bigger write-downs on Greek debt.
Mining and energy stocks helped lead Tuesday's gains while gold prices were up for the first time in five days and silver futures advanced +5.2%. Oil stocks rose as the price of crude settled in New York up more than $4 per barrel, the biggest one-day gain in more than four months.
Walgreen Co (WAG -6.27%) posted profits that beat estimates, but shares fell as the drug chain failed to report progress on a new contract with Express Scripts Inc (ESRX +0.92%).
The market environment (M criteria) is clearly under pressure and back in a correction after the heavy wave of distributional action last week. The latest confirmed rally may, at best, be considered barely alive by the fact that the Nasdaq Composite Index and S&P 500 Index are still fighting to stay above their respective Day 1 (8/09/11) lows.
The September 2011 issue of CANSLIM.net News is now available - (click here). The Q3 2011 Webcast airs on Wednesday, September 28th at 8PM EST. Links to all prior reports and webcasts are available on the Premium Member Homepage.
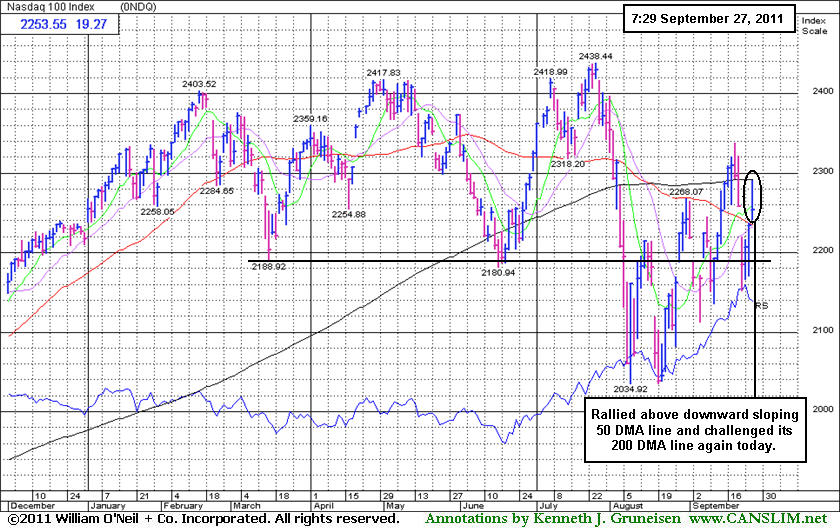
PICTURED: The non-financial Nasdaq 100 Index rallied above its downward sloping 50-day moving average (DMA) line to challenge its 200 DMA line again today. The major indices are technically in worse shape, while the lack of a negative influence from financial shares obviously helps this index look better.
|
 Kenneth J. Gruneisen started out as a licensed stockbroker in August 1987, a couple of months prior to the historic stock market crash that took the Dow Jones Industrial Average down -22.6% in a single day. He has published daily fact-based fundamental and technical analysis on high-ranked stocks online for two decades. Through FACTBASEDINVESTING.COM, Kenneth provides educational articles, news, market commentary, and other information regarding proven investment systems that work in good times and bad.
Comments contained in the body of this report are technical opinions only and are not necessarily those of Gruneisen Growth Corp. The material herein has been obtained from sources believed to be reliable and accurate, however, its accuracy and completeness cannot be guaranteed. Our firm, employees, and customers may effect transactions, including transactions contrary to any recommendation herein, or have positions in the securities mentioned herein or options with respect thereto. Any recommendation contained in this report may not be suitable for all investors and it is not to be deemed an offer or solicitation on our part with respect to the purchase or sale of any securities. |
|
 |
Healthcare, Technology, and Energy-Related Shares Rose
Kenneth J. Gruneisen - Passed the CAN SLIM® Master's Exam
While the Retail Index ($RLX -0.50%) had a slightly negative bias and the Bank Index ($BKX -0.05%) ended marginally lower, the Broker/Dealer Index ($XBD +0.77%) was a positive influence, and gains in other groups helped the major averages finish the day higher. The Healthcare Index ($HMO +1.95%) was among Tuesday's best gaining groups and the tech sector was led higher by the Networking Index ($NWX +2.60%), followed by gains from the Semiconductor Index ($SOX +1.81%), Biotechnology Index ($BTK +1.24%), and the Internet Index ($IIX +1.50%). The Integrated Oil Index ($XOI +1.71%) posted a solid gain, meanwhile the Oil Services Index ($OSX +0.33%) edged higher and the Gold & Silver Index ($XAU +0.15%) posted a small gain.
Charts courtesy www.stockcharts.com
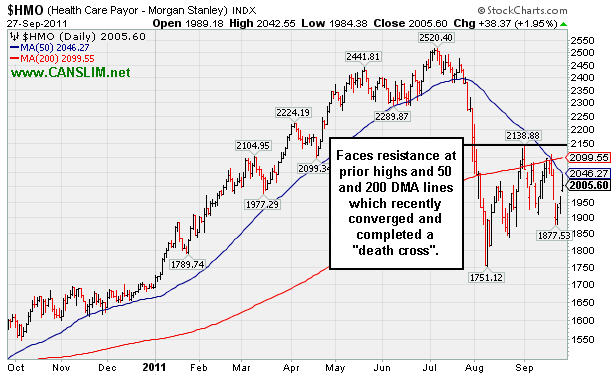
PICTURED: The Healthcare Index ($HMO +1.95%) faces resistance at its prior hghs and its 50-day and 200-day moving average (DMA) lines which recently converged and completed a "death cross".
| Oil Services |
$OSX |
208.19 |
+0.69 |
+0.33% |
-15.07% |
| Healthcare |
$HMO |
2,005.60 |
+38.37 |
+1.95% |
+18.54% |
| Integrated Oil |
$XOI |
1,083.24 |
+18.17 |
+1.71% |
-10.71% |
| Semiconductor |
$SOX |
366.01 |
+6.51 |
+1.81% |
-11.12% |
| Networking |
$NWX |
229.86 |
+5.83 |
+2.60% |
-18.07% |
| Internet |
$IIX |
280.05 |
+4.13 |
+1.50% |
-8.99% |
| Broker/Dealer |
$XBD |
84.55 |
+0.65 |
+0.77% |
-30.42% |
| Retail |
$RLX |
515.59 |
-2.61 |
-0.50% |
+1.42% |
| Gold & Silver |
$XAU |
192.96 |
+0.28 |
+0.15% |
-14.84% |
| Bank |
$BKX |
36.83 |
-0.02 |
-0.05% |
-29.46% |
| Biotech |
$BTK |
1,162.37 |
+14.23 |
+1.24% |
-10.42% |
|
|
|
 |
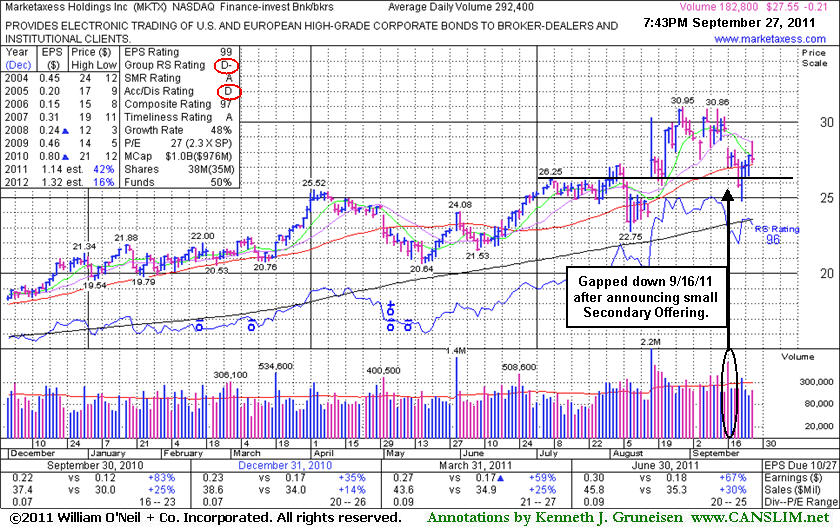
Holding its Ground Following News of Small Secondary Offering
Kenneth J. Gruneisen - Passed the CAN SLIM® Master's Exam
Marketaxess Holdings Inc (MKTX -$0.21 or -0.76% to $27.55) erased its early gain today, and after a negative reversal it ended near the session low with a small loss on below average volume. It inched back above its 50-day moving average (DMA) line with lighter volume after recently finding support near that important short-term average and its prior highs in the $26 area. It endured some distributional pressure after its last appearance in this FSU section on 9/02/11 with an annotated graph under the headline, "Volume Totals Cooling While Hovering Near Highs". Since then, its Accumulation/Distribution rating has slumped from a B- to a D, and it has been struggling to hold its ground since a gap down on 9/16/11 following news of a small Secondary Offering of 950,000 shares priced at $28.65.
It proved resilient near its short-term average in the past after undercutting it, and it stayed well above its longer-term 200 DMA line. MKTX has earned high ranks and reasonably satisfies the guidelines concerning quarterly and annual earnings (C and A criteria), however a downturn in FY '08 (see red oval) was previously noted as a flaw. Additionally, the Finance - Investment Bankers industry group currently has a Relative Strength rating of D- which indicates the group has been a poor performer rather than a strong leader (L criteria). The number of top-rated funds owning its shares rose from 195 in Dec '10 to 227 in Jun '11, a reassuring sign concerning the I criteria.
All prior notes can be reviewed on the Company Profile page under the "View All Notes" tab. The "Featured Articles and Daily Graphs" tab on the Company Profile page allows members to view all of the previous detailed analysis and annotated graphs published on any stocks we have covered.
|
|
|
Color Codes Explained :
Y - Better candidates highlighted by our
staff of experts.
G - Previously featured
in past reports as yellow but may no longer be buyable under the
guidelines.
***Last / Change / Volume data in this table is the closing quote data***
Symbol/Exchange
Company Name
Industry Group |
PRICE |
CHANGE
(%Change) |
Day High |
Volume
(% DAV)
(% 50 day avg vol) |
52 Wk Hi
% From Hi |
Featured
Date |
Price
Featured |
Pivot Featured |
|
Max Buy |
AAPL
-
NASDAQ
Apple Inc
COMPUTER HARDWARE - Personal Computers
|
$399.26
|
-3.91
-0.97% |
$409.25
|
22,517,362
97.94% of 50 DAV
50 DAV is 22,990,300
|
$422.86
-5.58%
|
9/16/2011
|
$399.14
|
PP = $404.60
|
|
MB = $424.83
|
Most Recent Note - 9/26/2011 12:44:02 PM
Y - Pulling back under its prior highs and pivot point, raising concerns. Recent rally to a new all-time high was not marked by very heavy volume. It is already heavily owned by the institutional crowd, and ownership by top-rated funds fell from 4,368 in Mar '11 to 4,347 in Jun '11.
>>> The latest Featured Stock Update with an annotated graph appeared on 9/19/2011. Click here.
View all notes |
Alert me of new notes |
CANSLIM.net Company Profile |
SEC |
Zacks Reports |
StockTalk |
News |
Chart |
Request a new note
C
A N
S L
I M


|
ALXN
-
NASDAQ
Alexion Pharmaceuticals
DRUGS - Drug Manufacturers - Other
|
$66.99
|
+0.81
1.22% |
$68.50
|
1,979,016
120.12% of 50 DAV
50 DAV is 1,647,500
|
$68.46
-2.15%
|
9/15/2011
|
$63.20
|
PP = $60.81
|
|
MB = $63.85
|
 Most Recent Note - 9/27/2011 1:17:53 PM
G - Touched another new all-time high today while on track for a 3rd consecutive gain with above average volume. Prior resistance in the $59-60 area defines initial support to watch on pullbacks.
>>> The latest Featured Stock Update with an annotated graph appeared on 9/15/2011. Click here.
View all notes |
Alert me of new notes |
CANSLIM.net Company Profile |
SEC |
Zacks Reports |
StockTalk |
News |
Chart |
Request a new note
C
A N
S L
I M
|
ATHN
-
NASDAQ
Athenahealth Inc
DIVERSIFIED SERVICES - Business/Management Services
|
$64.52
|
+0.62
0.97% |
$66.53
|
515,943
60.44% of 50 DAV
50 DAV is 853,700
|
$72.70
-11.25%
|
9/8/2011
|
$61.93
|
PP = $61.78
|
|
MB = $64.87
|
Most Recent Note - 9/26/2011 1:35:37 PM
G - Consolidating above prior highs in the $61 area previously noted as initial support on pullbacks. Its 50 DMA line is the next nearest support level.
>>> The latest Featured Stock Update with an annotated graph appeared on 9/8/2011. Click here.
View all notes |
Alert me of new notes |
CANSLIM.net Company Profile |
SEC |
Zacks Reports |
StockTalk |
News |
Chart |
Request a new note
C
A N
S L
I M
|
CELG
-
NASDAQ
Celgene Corp
DRUGS - Drug Manufacturers - Major
|
$63.97
|
+0.87
1.38% |
$65.10
|
4,290,371
100.46% of 50 DAV
50 DAV is 4,270,600
|
$65.86
-2.87%
|
9/16/2011
|
$61.21
|
PP = $62.59
|
|
MB = $65.72
|
Most Recent Note - 9/27/2011 8:17:15 PM
Y - Gapped up today for a small gain with average volume finishing at its second best close ever. Following its breakout on 9/20/11 it abruptly pulled back near previously stubborn resistance in the $62 area which acted as a support level.
>>> The latest Featured Stock Update with an annotated graph appeared on 9/16/2011. Click here.
View all notes |
Alert me of new notes |
CANSLIM.net Company Profile |
SEC |
Zacks Reports |
StockTalk |
News |
Chart |
Request a new note
C
A N
S L
I M
|
CPA
-
NYSE
Copa Holdings Sa
TRANSPORTATION - Regional Airlines
|
$63.60
|
+0.09
0.14% |
$65.68
|
304,426
97.95% of 50 DAV
50 DAV is 310,800
|
$72.86
-12.71%
|
9/21/2011
|
$69.67
|
PP = $72.86
|
|
MB = $76.50
|
Most Recent Note - 9/26/2011 7:05:40 PM
G - Gain today with above average volume halted a streak of 3 consecutive losses with above average volume that violated its 50 DMA line and raised concerns. See latest FSU analysis for more details and a new annotated weekly graph.
>>> The latest Featured Stock Update with an annotated graph appeared on 9/26/2011. Click here.
View all notes |
Alert me of new notes |
CANSLIM.net Company Profile |
SEC |
Zacks Reports |
StockTalk |
News |
Chart |
Request a new note
C
A N
S L
I M
|
Symbol/Exchange
Company Name
Industry Group |
PRICE |
CHANGE
(%Change) |
Day High |
Volume
(% DAV)
(% 50 day avg vol) |
52 Wk Hi
% From Hi |
Featured
Date |
Price
Featured |
Pivot Featured |
|
Max Buy |
DMND
-
NASDAQ
Diamond Foods Inc
FOOD and; BEVERAGE - Processed and; Packaged Goods
|
$82.06
|
-3.20
-3.75% |
$85.99
|
1,656,424
499.07% of 50 DAV
50 DAV is 331,900
|
$96.13
-14.64%
|
9/13/2011
|
$75.57
|
PP = $80.16
|
|
MB = $84.17
|
Most Recent Note - 9/27/2011 8:19:50 PM
G - Higher volume behind its 5th consecutive loss today led to a finish below its "max buy" level after testing prior highs in the $80 area previously noted as initial chart support to watch on pullbacks.
>>> The latest Featured Stock Update with an annotated graph appeared on 9/13/2011. Click here.
View all notes |
Alert me of new notes |
CANSLIM.net Company Profile |
SEC |
Zacks Reports |
StockTalk |
News |
Chart |
Request a new note
C
A N
S L
I M
|
EXLS
-
NASDAQ
Exlservice Holdings Inc
DIVERSIFIED SERVICES - Business/Management Services
|
$22.66
|
+0.32
1.43% |
$22.93
|
168,136
81.58% of 50 DAV
50 DAV is 206,100
|
$26.55
-14.65%
|
8/2/2011
|
$24.85
|
PP = $24.85
|
|
MB = $26.09
|
Most Recent Note - 9/26/2011 4:28:43 PM
G - Testing support at its 200 DMA line with lighter than average volume behind today's 6th consecutive loss. Its 50 DMA line may act as resistance, while a rebound above that short-term average is needed to help its outlook.
>>> The latest Featured Stock Update with an annotated graph appeared on 9/7/2011. Click here.
View all notes |
Alert me of new notes |
CANSLIM.net Company Profile |
SEC |
Zacks Reports |
StockTalk |
News |
Chart |
Request a new note
C
A N
S L
I M
|
JAZZ
-
NASDAQ
Jazz Pharmaceuticals Inc
DRUGS - Biotechnology
|
$45.04
|
+1.82
4.21% |
$46.62
|
768,616
81.21% of 50 DAV
50 DAV is 946,500
|
$47.88
-5.94%
|
9/20/2011
|
$46.56
|
PP = $44.63
|
|
MB = $46.86
|
Most Recent Note - 9/27/2011 8:21:23 PM
Y - Gain today with below average volume broke a streak of 4 consecutive losses. Its 50 DMA line defines important chart support to watch.
>>> The latest Featured Stock Update with an annotated graph appeared on 9/20/2011. Click here.
View all notes |
Alert me of new notes |
CANSLIM.net Company Profile |
SEC |
Zacks Reports |
StockTalk |
News |
Chart |
Request a new note
C
A N
S L
I M
|
JCOM
-
NASDAQ
J 2 Global Communication
INTERNET - Internet Software and Services
|
$29.22
|
-0.22
-0.75% |
$30.00
|
729,206
149.64% of 50 DAV
50 DAV is 487,300
|
$32.67
-10.57%
|
8/8/2011
|
$30.38
|
PP = $29.31
|
|
MB = $30.78
|
Most Recent Note - 9/27/2011 8:22:48 PM
G - Suffered another small loss today with above average volume indicating distributional pressure. Testing support near its closely coinciding 50 and 200 DMA lines.
>>> The latest Featured Stock Update with an annotated graph appeared on 9/23/2011. Click here.
View all notes |
Alert me of new notes |
CANSLIM.net Company Profile |
SEC |
Zacks Reports |
StockTalk |
News |
Chart |
Request a new note
C
A N
S L
I M
|
MA
-
NYSE
Mastercard Inc Cl A
DIVERSIFIED SERVICES - Business/Management Services
|
$338.11
|
+3.71
1.11% |
$341.99
|
1,226,182
76.28% of 50 DAV
50 DAV is 1,607,400
|
$361.94
-6.58%
|
8/3/2011
|
$324.82
|
PP = $322.38
|
|
MB = $338.50
|
Most Recent Note - 9/27/2011 8:07:14 PM
G - Stalled after recently rallying above prior resistance in the $340 area, and now consolidating above important support at its 50 DMA line.
>>> The latest Featured Stock Update with an annotated graph appeared on 9/12/2011. Click here.
View all notes |
Alert me of new notes |
CANSLIM.net Company Profile |
SEC |
Zacks Reports |
StockTalk |
News |
Chart |
Request a new note
C
A N
S L
I M
|
Symbol/Exchange
Company Name
Industry Group |
PRICE |
CHANGE
(%Change) |
Day High |
Volume
(% DAV)
(% 50 day avg vol) |
52 Wk Hi
% From Hi |
Featured
Date |
Price
Featured |
Pivot Featured |
|
Max Buy |
MG
-
NYSE
Mistras Group Inc
DIVERSIFIED SERVICES - Bulding and Faci;ity Management Services
|
$18.86
|
+0.24
1.29% |
$18.98
|
149,563
76.27% of 50 DAV
50 DAV is 196,100
|
$20.82
-9.41%
|
8/10/2011
|
$17.89
|
PP = $17.58
|
|
MB = $18.46
|
Most Recent Note - 9/26/2011 12:13:37 PM
G - Testing prior highs in the $18 area and its 50 DMA line previously noted as important chart support to watch on pullbacks.
>>> The latest Featured Stock Update with an annotated graph appeared on 9/9/2011. Click here.
View all notes |
Alert me of new notes |
CANSLIM.net Company Profile |
SEC |
Zacks Reports |
StockTalk |
News |
Chart |
Request a new note
C
A N
S L
I M
|
MKTX
-
NASDAQ
Marketaxess Holdings Inc
FINANCIAL SERVICES - Investment Brokerage - Nationa
|
$27.55
|
-0.21
-0.76% |
$28.73
|
182,796
62.52% of 50 DAV
50 DAV is 292,400
|
$30.95
-10.98%
|
7/29/2011
|
$25.87
|
PP = $26.35
|
|
MB = $27.67
|
Most Recent Note - 9/27/2011 8:13:44 PM
G - Consolidating above its 50 DMA line and support near prior highs in the $26 area. See the latest FSU analysis for more details and a new annotated graph.
>>> The latest Featured Stock Update with an annotated graph appeared on 9/27/2011. Click here.
View all notes |
Alert me of new notes |
CANSLIM.net Company Profile |
SEC |
Zacks Reports |
StockTalk |
News |
Chart |
Request a new note
C
A N
S L
I M
|
PCLN
-
NASDAQ
Priceline.Com Inc
INTERNET - Internet Software and Services
|
$511.12
|
-2.47
-0.48% |
$523.58
|
1,323,642
95.81% of 50 DAV
50 DAV is 1,381,500
|
$561.88
-9.03%
|
9/20/2011
|
$539.46
|
PP = $552.25
|
|
MB = $579.86
|
Most Recent Note - 9/26/2011 5:56:47 PM
G - Closed near the session high today after overcoming early weakness that had it slumping near its 200 DMA line. Color code is changed to green due to recent distributional action. A volume-driven gain did not yet trigger a proper technical buy signal.
>>> The latest Featured Stock Update with an annotated graph appeared on 9/22/2011. Click here.
View all notes |
Alert me of new notes |
CANSLIM.net Company Profile |
SEC |
Zacks Reports |
StockTalk |
News |
Chart |
Request a new note
C
A N
S L
I M
|
PSMT
-
NASDAQ
Pricesmart Inc
RETAIL - Drug Stores
|
$67.02
|
+0.87
1.32% |
$68.58
|
359,562
116.10% of 50 DAV
50 DAV is 309,700
|
$75.16
-10.83%
|
8/30/2011
|
$63.01
|
PP = $62.37
|
|
MB = $65.49
|
Most Recent Note - 9/26/2011 5:42:29 PM
G - Today's 5th consecutive loss came with above average volume. Prior highs and its 50 DMA line define important support levels to watch.
>>> The latest Featured Stock Update with an annotated graph appeared on 9/14/2011. Click here.
View all notes |
Alert me of new notes |
CANSLIM.net Company Profile |
SEC |
Zacks Reports |
StockTalk |
News |
Chart |
Request a new note
C
A N
S L
I M
|
V
-
NYSE
Visa Inc Cl A
DIVERSIFIED SERVICES - Business/Management Services
|
$89.48
|
-0.80
-0.89% |
$91.70
|
5,015,252
82.62% of 50 DAV
50 DAV is 6,070,100
|
$94.75
-5.56%
|
9/20/2011
|
$93.91
|
PP = $90.93
|
|
MB = $95.48
|
Most Recent Note - 9/27/2011 8:12:18 PM
Y - Consolidating quietly just under its pivot point and above important support at its 50 DMA line. It recently stalled after rallying to a new all-time high.
>>> The latest Featured Stock Update with an annotated graph appeared on 9/21/2011. Click here.
View all notes |
Alert me of new notes |
CANSLIM.net Company Profile |
SEC |
Zacks Reports |
StockTalk |
News |
Chart |
Request a new note
C
A N
S L
I M
|
Symbol/Exchange
Company Name
Industry Group |
PRICE |
CHANGE
(%Change) |
Day High |
Volume
(% DAV)
(% 50 day avg vol) |
52 Wk Hi
% From Hi |
Featured
Date |
Price
Featured |
Pivot Featured |
|
Max Buy |
|
|
|
THESE ARE NOT BUY RECOMMENDATIONS!
Comments contained in the body of this report are technical
opinions only. The material herein has been obtained
from sources believed to be reliable and accurate, however,
its accuracy and completeness cannot be guaranteed.
This site is not an investment advisor, hence it does
not endorse or recommend any securities or other investments.
Any recommendation contained in this report may not
be suitable for all investors and it is not to be deemed
an offer or solicitation on our part with respect to
the purchase or sale of any securities. All trademarks,
service marks and trade names appearing in this report
are the property of their respective owners, and are
likewise used for identification purposes only.
This report is a service available
only to active Paid Premium Members.
You may opt-out of receiving report notifications
at any time. Questions or comments may be submitted
by writing to Premium Membership Services 665 S.E. 10 Street, Suite 201 Deerfield Beach, FL 33441-5634 or by calling 1-800-965-8307
or 954-785-1121.
|
|
|

