You are not logged in.
This means you
CAN ONLY VIEW reports that were published prior to Friday, April 11, 2025.
You
MUST UPGRADE YOUR MEMBERSHIP if you want to see any current reports.
AFTER MARKET UPDATE - WEDNESDAY, SEPTEMBER 28TH, 2011
Previous After Market Report Next After Market Report >>>
|
|
|
|
DOW |
-179.79 |
11,010.90 |
-1.61% |
|
Volume |
1,049,021,760 |
-12% |
|
Volume |
1,892,412,120 |
-8% |
|
NASDAQ |
-55.25 |
2,491.58 |
-2.17% |
|
Advancers |
410 |
13% |
|
Advancers |
378 |
15% |
|
S&P 500 |
-24.32 |
1,151.06 |
-2.07% |
|
Decliners |
2,639 |
85% |
|
Decliners |
2,137 |
82% |
|
Russell 2000 |
-28.26 |
651.97 |
-4.15% |
|
52 Wk Highs |
8 |
|
|
52 Wk Highs |
8 |
|
|
S&P 600 |
-14.58 |
359.05 |
-3.90% |
|
52 Wk Lows |
101 |
|
|
52 Wk Lows |
130 |
|
|
 |
Major Averages Erased Early Gains and Closed in the Red
Kenneth J. Gruneisen - Passed the CAN SLIM® Master's Exam
The Dow hit its low for the day in the final 30 minutes, wiping out an early advance of 126 points on Wednesday. Lighter volume totals were reported on the NYSE and on the Nasdaq exchange, but that did little to ease investors' jitters. Breadth was negative as declining issues beat advancers by 6-1 on the NYSE and 5-1 on the Nasdaq exchange. The new 52-week lows totals still outnumbered new 52-week highs on both the Nasdaq exchange and the NYSE, and new highs totals slumped to the single digits on both exchanges again. There was only 1 high-ranked company from the CANSLIM.net Leaders List that made a new 52-week high and appeared on the CANSLIM.net BreakOuts Page, down from 12 on the prior session. There were losses for all of the 15 high-ranked companies currently included on the Featured Stocks Page.
The S&P 500 appeared set to extend its biggest three-day rally in a month, but the session's early gains were erased and throughout the session the market continually weakened as investors fretted about global growth and signs of discord in Europe. Finland's parliament approved the expansion of the fund, bringing to nine the number of euro members voting in favor of ratification. European markets were mixed after the European Union proposed a tax on financial transactions that would take effect in 2014 and raise about 57 billion euros a year. Meanwhile, investors awaited the results of tomorrow's German parliament vote to expand the European bailout fund.
A report on U.S. durable goods orders was not as weak as expected. August orders declined 0.1%, whereas analysts were looking for a drop of 0.2%. The report showed orders for U.S. capital goods climbed in August by the most in three months, a sign business investment continues to support the recovery.
Amazon.com Inc (AMZN -2.45%) rallied as the company prepared to unveil its first tablet computer, the Kindle Fire, priced at $199. The move takes aim at Apple's iPad. Shares of Apple Inc (AAPL -0.56%) fell. Jabil Circuit Inc (JBL +8.40%) was a leader in the technology group after the company said it sees profits in the current quarter coming in above estimates. Family Dollar Stores Inc (FDO -1.61%) and technology consulting company Accenture Plc (ACN +0.34%) reported earnings that beat expectations.
Metals stocks took the biggest hits. Commodity prices weakened on signs that demand in China may slow. China's benchmark stock index retreated to its lowest level since July of last year. Oil settled down over $3 per barrel in New York. Silver prices fell -5%, and copper prices were down -7%. Agricultural products were not immune. Soybeans dropped to a ten-month low. The 10-year Treasury note was down 7/32 to yield 2.00%. A government auction of five-year notes drew the highest demand in four months.
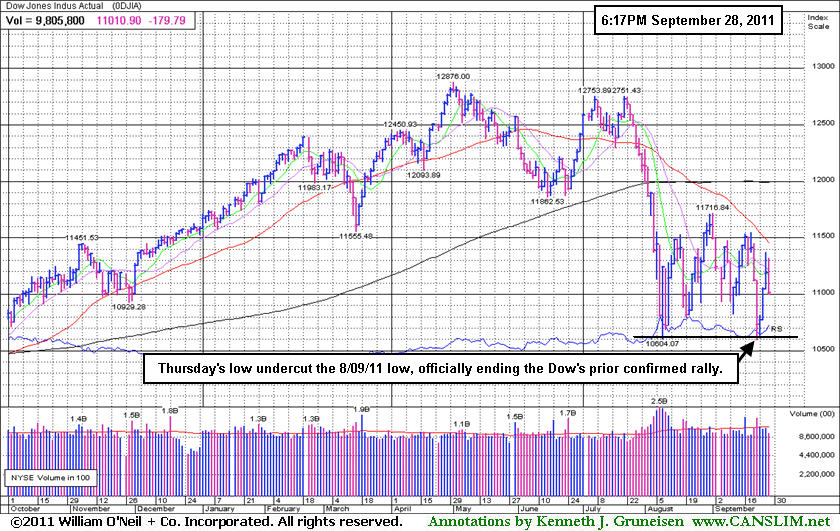
The market environment (M criteria) is clearly under pressure and back in a correction after the heavy wave of distributional action last week. The latest confirmed rally may, at best, be considered barely alive by the fact that the Nasdaq Composite Index and S&P 500 Index are still fighting to stay above their respective Day 1 (8/09/11) lows.
The September 2011 issue of CANSLIM.net News is now available - (click here). The Q3 2011 Webcast airs TONIGHT - Wednesday, September 28th at 8PM EST. All upgraded members are eligible to access the webcast and should receive a separate email reminder with a link to allow easy access to the presentation at no additional cost. The link to the webcast will also be placed near the top of the archives on the Premium Member Homepage where links to all prior reports and webcasts are always available.
PICTURED: The Dow Jones Industrial Average's low last Thursday undercut its 8/09/11 low, officially ending the Dow's prior confirmed rally.
|
 Kenneth J. Gruneisen started out as a licensed stockbroker in August 1987, a couple of months prior to the historic stock market crash that took the Dow Jones Industrial Average down -22.6% in a single day. He has published daily fact-based fundamental and technical analysis on high-ranked stocks online for two decades. Through FACTBASEDINVESTING.COM, Kenneth provides educational articles, news, market commentary, and other information regarding proven investment systems that work in good times and bad.
Comments contained in the body of this report are technical opinions only and are not necessarily those of Gruneisen Growth Corp. The material herein has been obtained from sources believed to be reliable and accurate, however, its accuracy and completeness cannot be guaranteed. Our firm, employees, and customers may effect transactions, including transactions contrary to any recommendation herein, or have positions in the securities mentioned herein or options with respect thereto. Any recommendation contained in this report may not be suitable for all investors and it is not to be deemed an offer or solicitation on our part with respect to the purchase or sale of any securities. |
|
 |
Widespread Losses Hurt Most Groups Worse Than Retail Index
Kenneth J. Gruneisen - Passed the CAN SLIM® Master's Exam
Commodity-linked groups led broad-based declines as the Gold & Silver Index ($XAU -4.59%) and Oil Services Index ($OSX -4.68%) took big hits and the Integrated Oil Index ($XOI -2.96%) fell. The Healthcare Index ($HMO -4.28%) also was smacked with a greater than -4% loss. The Bank Index ($BKX -3.45%) and Broker/Dealer Index ($XBD -3.29%) added to the market's negative bias. The tech sector saw unanimous losses from the Networking Index ($NWX -3.97%), Biotechnology Index ($BTK -3.27%), Semiconductor Index ($SOX -2.91%), and Internet Index ($IIX -2.38%).
Charts courtesy www.stockcharts.com
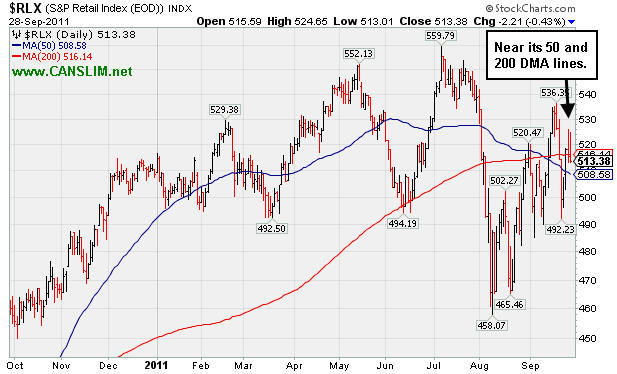
PICTURED: The The Retail Index ($RLX -0.43%) held up relatively well on such a negative session, ending the day with a modest loss. It is consolidating near its 50-day and 200-day moving average (DMA) lines which recently converged and crossed over, forming a "death cross".
| Oil Services |
$OSX |
198.45 |
-9.74 |
-4.68% |
-19.04% |
| Healthcare |
$HMO |
1,919.68 |
-85.93 |
-4.28% |
+13.46% |
| Integrated Oil |
$XOI |
1,051.21 |
-32.03 |
-2.96% |
-13.35% |
| Semiconductor |
$SOX |
355.36 |
-10.65 |
-2.91% |
-13.71% |
| Networking |
$NWX |
220.74 |
-9.12 |
-3.97% |
-21.32% |
| Internet |
$IIX |
273.39 |
-6.65 |
-2.38% |
-11.16% |
| Broker/Dealer |
$XBD |
81.77 |
-2.78 |
-3.29% |
-32.71% |
| Retail |
$RLX |
513.38 |
-2.21 |
-0.43% |
+0.98% |
| Gold & Silver |
$XAU |
184.10 |
-8.86 |
-4.59% |
-18.75% |
| Bank |
$BKX |
35.56 |
-1.27 |
-3.45% |
-31.89% |
| Biotech |
$BTK |
1,124.31 |
-38.06 |
-3.27% |
-13.36% |
|
|
|
 |
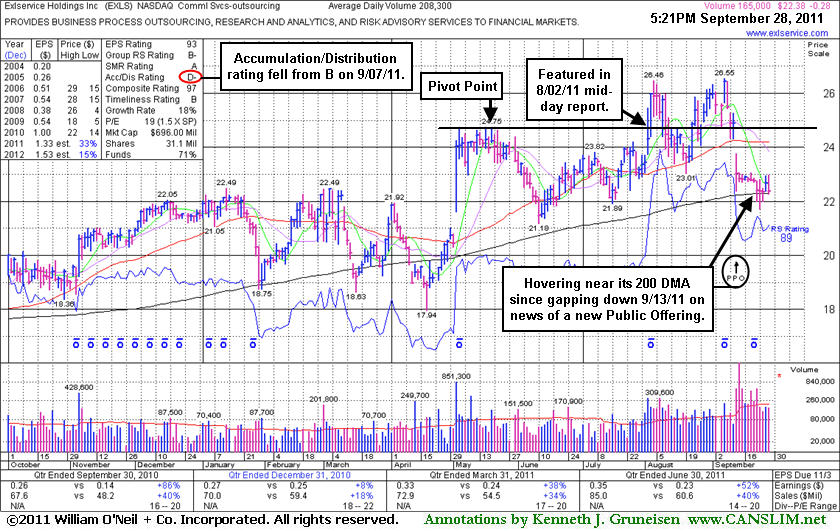
Struggling Near 200-Day Average After Recent News Of Public Offering
Kenneth J. Gruneisen - Passed the CAN SLIM® Master's Exam
Exlservice Holdings Inc (EXLS -$0.11 or -0.46% to $22.56) has been testing support at its 200-day moving average (DMA) line with lighter than average volume on recent sessions following damaging losses with heavier volume that were indicative of distributional pressure. Its 50 DMA line may act as resistance if it rallies again, while a rebound above that short-term average is needed to truly help its outlook, technically. Its Accumulation/Distribution rating has fallen from a B to a D- since it was last shown in this FSU section on 9/07/11 with an annotated graph under the headline, "Gain With Twice Average Volume Lifts Firm Above 'Max Buy' Level". After barely trading above its earlier high, it promptly slumped back near its prior highs and its 50 DMA line. Then, rather than finding support, it gapped down and triggered a technical sell signal on 9/13/11 following news of a new Public Offering. More damaging losses leading to a violation of its 200 DMA and recent lows may trigger another more worrisome technical sell signal. That may prompt it to be dropped from the Featured Stocks list, meanwhile it is already -15% off its 52-week high.
It reported earnings +52% on +40% sales revenues for the quarter ended June 30, 2011 versus the year ago period. Quarterly comparisons (C criteria) have shown mostly impressive sales and earnings increases. A downturn in its FY '08 earnings was previously noted as a small flaw with respect to the A criteria of the fact-based investment system.
|
|
|
Color Codes Explained :
Y - Better candidates highlighted by our
staff of experts.
G - Previously featured
in past reports as yellow but may no longer be buyable under the
guidelines.
***Last / Change / Volume data in this table is the closing quote data***
Symbol/Exchange
Company Name
Industry Group |
PRICE |
CHANGE
(%Change) |
Day High |
Volume
(% DAV)
(% 50 day avg vol) |
52 Wk Hi
% From Hi |
Featured
Date |
Price
Featured |
Pivot Featured |
|
Max Buy |
AAPL
-
NASDAQ
Apple Inc
COMPUTER HARDWARE - Personal Computers
|
$397.01
|
-2.25
-0.56% |
$403.74
|
15,329,826
66.56% of 50 DAV
50 DAV is 23,033,000
|
$422.86
-6.11%
|
9/16/2011
|
$399.14
|
PP = $404.60
|
|
MB = $424.83
|
Most Recent Note - 9/26/2011 12:44:02 PM
Y - Pulling back under its prior highs and pivot point, raising concerns. Recent rally to a new all-time high was not marked by very heavy volume. It is already heavily owned by the institutional crowd, and ownership by top-rated funds fell from 4,368 in Mar '11 to 4,347 in Jun '11.
>>> The latest Featured Stock Update with an annotated graph appeared on 9/19/2011. Click here.
View all notes |
Alert me of new notes |
CANSLIM.net Company Profile |
SEC |
Zacks Reports |
StockTalk |
News |
Chart |
Request a new note
C
A N
S L
I M


|
ALXN
-
NASDAQ
Alexion Pharmaceuticals
DRUGS - Drug Manufacturers - Other
|
$65.90
|
-1.09
-1.63% |
$68.31
|
1,361,201
82.13% of 50 DAV
50 DAV is 1,657,400
|
$68.50
-3.80%
|
9/15/2011
|
$63.20
|
PP = $60.81
|
|
MB = $63.85
|
Most Recent Note - 9/27/2011 1:17:53 PM
G - Touched another new all-time high today while on track for a 3rd consecutive gain with above average volume. Prior resistance in the $59-60 area defines initial support to watch on pullbacks.
>>> The latest Featured Stock Update with an annotated graph appeared on 9/15/2011. Click here.
View all notes |
Alert me of new notes |
CANSLIM.net Company Profile |
SEC |
Zacks Reports |
StockTalk |
News |
Chart |
Request a new note
C
A N
S L
I M
|
ATHN
-
NASDAQ
Athenahealth Inc
DIVERSIFIED SERVICES - Business/Management Services
|
$62.65
|
-1.87
-2.90% |
$65.11
|
449,976
52.44% of 50 DAV
50 DAV is 858,000
|
$72.70
-13.82%
|
9/8/2011
|
$61.93
|
PP = $61.78
|
|
MB = $64.87
|
 Most Recent Note - 9/28/2011 6:53:27 PM
G - Quietly consolidating above prior highs in the $61 area previously noted as initial support on pullbacks. Its 50 DMA line is the next nearest support level.
>>> The latest Featured Stock Update with an annotated graph appeared on 9/8/2011. Click here.
View all notes |
Alert me of new notes |
CANSLIM.net Company Profile |
SEC |
Zacks Reports |
StockTalk |
News |
Chart |
Request a new note
C
A N
S L
I M
|
CELG
-
NASDAQ
Celgene Corp
DRUGS - Drug Manufacturers - Major
|
$62.40
|
-1.57
-2.45% |
$64.51
|
2,862,105
66.87% of 50 DAV
50 DAV is 4,280,200
|
$65.86
-5.25%
|
9/16/2011
|
$61.21
|
PP = $62.59
|
|
MB = $65.72
|
Most Recent Note - 9/28/2011 6:55:09 PM
Y - Down considerably today with a loss on below average volume, closing just under its pivot point. Following its breakout on 9/20/11 it abruptly pulled back near previously stubborn resistance in the $62 area which acted as a support level.
>>> The latest Featured Stock Update with an annotated graph appeared on 9/16/2011. Click here.
View all notes |
Alert me of new notes |
CANSLIM.net Company Profile |
SEC |
Zacks Reports |
StockTalk |
News |
Chart |
Request a new note
C
A N
S L
I M
|
CPA
-
NYSE
Copa Holdings Sa
TRANSPORTATION - Regional Airlines
|
$63.34
|
-0.26
-0.41% |
$64.36
|
222,250
71.03% of 50 DAV
50 DAV is 312,900
|
$72.86
-13.07%
|
9/21/2011
|
$69.67
|
PP = $72.86
|
|
MB = $76.50
|
Most Recent Note - 9/26/2011 7:05:40 PM
G - Gain today with above average volume halted a streak of 3 consecutive losses with above average volume that violated its 50 DMA line and raised concerns. See latest FSU analysis for more details and a new annotated weekly graph.
>>> The latest Featured Stock Update with an annotated graph appeared on 9/26/2011. Click here.
View all notes |
Alert me of new notes |
CANSLIM.net Company Profile |
SEC |
Zacks Reports |
StockTalk |
News |
Chart |
Request a new note
C
A N
S L
I M
|
Symbol/Exchange
Company Name
Industry Group |
PRICE |
CHANGE
(%Change) |
Day High |
Volume
(% DAV)
(% 50 day avg vol) |
52 Wk Hi
% From Hi |
Featured
Date |
Price
Featured |
Pivot Featured |
|
Max Buy |
DMND
-
NASDAQ
Diamond Foods Inc
FOOD and; BEVERAGE - Processed and; Packaged Goods
|
$80.16
|
-1.90
-2.32% |
$84.69
|
1,249,689
344.65% of 50 DAV
50 DAV is 362,600
|
$96.13
-16.61%
|
9/13/2011
|
$75.57
|
PP = $80.16
|
|
MB = $84.17
|
Most Recent Note - 9/27/2011 8:19:50 PM
G - Higher volume behind its 5th consecutive loss today led to a finish below its "max buy" level after testing prior highs in the $80 area previously noted as initial chart support to watch on pullbacks.
>>> The latest Featured Stock Update with an annotated graph appeared on 9/13/2011. Click here.
View all notes |
Alert me of new notes |
CANSLIM.net Company Profile |
SEC |
Zacks Reports |
StockTalk |
News |
Chart |
Request a new note
C
A N
S L
I M
|
EXLS
-
NASDAQ
Exlservice Holdings Inc
DIVERSIFIED SERVICES - Business/Management Services
|
$22.38
|
-0.28
-1.24% |
$22.96
|
167,068
80.21% of 50 DAV
50 DAV is 208,300
|
$26.55
-15.71%
|
8/2/2011
|
$24.85
|
PP = $24.85
|
|
MB = $26.09
|
Most Recent Note - 9/28/2011 6:46:22 PM
G - Testing support at its 200 DMA line. See the latest FSU analysis for more details and a new annotated graph.
>>> The latest Featured Stock Update with an annotated graph appeared on 9/28/2011. Click here.
View all notes |
Alert me of new notes |
CANSLIM.net Company Profile |
SEC |
Zacks Reports |
StockTalk |
News |
Chart |
Request a new note
C
A N
S L
I M
|
JAZZ
-
NASDAQ
Jazz Pharmaceuticals Inc
DRUGS - Biotechnology
|
$43.53
|
-1.51
-3.35% |
$45.90
|
604,979
63.57% of 50 DAV
50 DAV is 951,700
|
$47.88
-9.09%
|
9/20/2011
|
$46.56
|
PP = $44.63
|
|
MB = $46.86
|
Most Recent Note - 9/28/2011 6:58:47 PM
Y - Down today on light volume, ending near the session low. Its 50 DMA line defines important chart support to watch.
>>> The latest Featured Stock Update with an annotated graph appeared on 9/20/2011. Click here.
View all notes |
Alert me of new notes |
CANSLIM.net Company Profile |
SEC |
Zacks Reports |
StockTalk |
News |
Chart |
Request a new note
C
A N
S L
I M
|
JCOM
-
NASDAQ
J 2 Global Communication
INTERNET - Internet Software and Services
|
$28.00
|
-1.22
-4.18% |
$29.48
|
610,833
122.31% of 50 DAV
50 DAV is 499,400
|
$32.67
-14.30%
|
8/8/2011
|
$30.38
|
PP = $29.31
|
|
MB = $30.78
|
Most Recent Note - 9/28/2011 6:51:47 PM
Suffered a damaging loss today and violated its 200 DMA line. Based on weak action it will be dropped from the Featured Stocks list tonight.
>>> The latest Featured Stock Update with an annotated graph appeared on 9/23/2011. Click here.
View all notes |
Alert me of new notes |
CANSLIM.net Company Profile |
SEC |
Zacks Reports |
StockTalk |
News |
Chart |
Request a new note
C
A N
S L
I M
|
MA
-
NYSE
Mastercard Inc Cl A
DIVERSIFIED SERVICES - Business/Management Services
|
$329.82
|
-8.29
-2.45% |
$340.00
|
1,026,510
63.82% of 50 DAV
50 DAV is 1,608,400
|
$361.94
-8.87%
|
8/3/2011
|
$324.82
|
PP = $322.38
|
|
MB = $338.50
|
Most Recent Note - 9/27/2011 8:07:14 PM
G - Stalled after recently rallying above prior resistance in the $340 area, and now consolidating above important support at its 50 DMA line.
>>> The latest Featured Stock Update with an annotated graph appeared on 9/12/2011. Click here.
View all notes |
Alert me of new notes |
CANSLIM.net Company Profile |
SEC |
Zacks Reports |
StockTalk |
News |
Chart |
Request a new note
C
A N
S L
I M
|
Symbol/Exchange
Company Name
Industry Group |
PRICE |
CHANGE
(%Change) |
Day High |
Volume
(% DAV)
(% 50 day avg vol) |
52 Wk Hi
% From Hi |
Featured
Date |
Price
Featured |
Pivot Featured |
|
Max Buy |
MG
-
NYSE
Mistras Group Inc
DIVERSIFIED SERVICES - Bulding and Faci;ity Management Services
|
$18.10
|
-0.76
-4.03% |
$18.83
|
181,517
91.54% of 50 DAV
50 DAV is 198,300
|
$20.82
-13.06%
|
8/10/2011
|
$17.89
|
PP = $17.58
|
|
MB = $18.46
|
Most Recent Note - 9/28/2011 12:51:42 PM
G - Quietly slumping below its 50 DMA line today, raising concerns while testing prior lows in the $18 area previously noted as important chart support to watch.
>>> The latest Featured Stock Update with an annotated graph appeared on 9/9/2011. Click here.
View all notes |
Alert me of new notes |
CANSLIM.net Company Profile |
SEC |
Zacks Reports |
StockTalk |
News |
Chart |
Request a new note
C
A N
S L
I M
|
MKTX
-
NASDAQ
Marketaxess Holdings Inc
FINANCIAL SERVICES - Investment Brokerage - Nationa
|
$26.36
|
-1.19
-4.32% |
$27.64
|
126,983
43.00% of 50 DAV
50 DAV is 295,300
|
$30.95
-14.83%
|
7/29/2011
|
$25.87
|
PP = $26.35
|
|
MB = $27.67
|
Most Recent Note - 9/28/2011 12:54:13 PM
G - Quietly slumping just under its 50 DMA line today after recently finding support near prior highs in the $26 area. See the latest FSU analysis for more details and a new annotated graph.
>>> The latest Featured Stock Update with an annotated graph appeared on 9/27/2011. Click here.
View all notes |
Alert me of new notes |
CANSLIM.net Company Profile |
SEC |
Zacks Reports |
StockTalk |
News |
Chart |
Request a new note
C
A N
S L
I M
|
PCLN
-
NASDAQ
Priceline.Com Inc
INTERNET - Internet Software and Services
|
$498.09
|
-13.03
-2.55% |
$518.00
|
1,080,010
77.38% of 50 DAV
50 DAV is 1,395,800
|
$561.88
-11.35%
|
9/20/2011
|
$539.46
|
PP = $552.25
|
|
MB = $579.86
|
Most Recent Note - 9/28/2011 6:49:01 PM
G - Closed near the session low today with its 5th loss in the span of 6 sessions, slumping near its 200 DMA line. A volume-driven gain did not yet trigger a proper new technical buy signal.
>>> The latest Featured Stock Update with an annotated graph appeared on 9/22/2011. Click here.
View all notes |
Alert me of new notes |
CANSLIM.net Company Profile |
SEC |
Zacks Reports |
StockTalk |
News |
Chart |
Request a new note
C
A N
S L
I M
|
PSMT
-
NASDAQ
Pricesmart Inc
RETAIL - Drug Stores
|
$65.72
|
-1.30
-1.94% |
$68.00
|
181,075
57.45% of 50 DAV
50 DAV is 315,200
|
$75.16
-12.56%
|
8/30/2011
|
$63.01
|
PP = $62.37
|
|
MB = $65.49
|
Most Recent Note - 9/26/2011 5:42:29 PM
G - Today's 5th consecutive loss came with above average volume. Prior highs and its 50 DMA line define important support levels to watch.
>>> The latest Featured Stock Update with an annotated graph appeared on 9/14/2011. Click here.
View all notes |
Alert me of new notes |
CANSLIM.net Company Profile |
SEC |
Zacks Reports |
StockTalk |
News |
Chart |
Request a new note
C
A N
S L
I M
|
V
-
NYSE
Visa Inc Cl A
DIVERSIFIED SERVICES - Business/Management Services
|
$87.63
|
-1.85
-2.07% |
$89.85
|
4,272,502
70.01% of 50 DAV
50 DAV is 6,102,800
|
$94.75
-7.51%
|
9/20/2011
|
$93.91
|
PP = $90.93
|
|
MB = $95.48
|
Most Recent Note - 9/27/2011 8:12:18 PM
Y - Consolidating quietly just under its pivot point and above important support at its 50 DMA line. It recently stalled after rallying to a new all-time high.
>>> The latest Featured Stock Update with an annotated graph appeared on 9/21/2011. Click here.
View all notes |
Alert me of new notes |
CANSLIM.net Company Profile |
SEC |
Zacks Reports |
StockTalk |
News |
Chart |
Request a new note
C
A N
S L
I M
|
Symbol/Exchange
Company Name
Industry Group |
PRICE |
CHANGE
(%Change) |
Day High |
Volume
(% DAV)
(% 50 day avg vol) |
52 Wk Hi
% From Hi |
Featured
Date |
Price
Featured |
Pivot Featured |
|
Max Buy |
|
|
|
THESE ARE NOT BUY RECOMMENDATIONS!
Comments contained in the body of this report are technical
opinions only. The material herein has been obtained
from sources believed to be reliable and accurate, however,
its accuracy and completeness cannot be guaranteed.
This site is not an investment advisor, hence it does
not endorse or recommend any securities or other investments.
Any recommendation contained in this report may not
be suitable for all investors and it is not to be deemed
an offer or solicitation on our part with respect to
the purchase or sale of any securities. All trademarks,
service marks and trade names appearing in this report
are the property of their respective owners, and are
likewise used for identification purposes only.
This report is a service available
only to active Paid Premium Members.
You may opt-out of receiving report notifications
at any time. Questions or comments may be submitted
by writing to Premium Membership Services 665 S.E. 10 Street, Suite 201 Deerfield Beach, FL 33441-5634 or by calling 1-800-965-8307
or 954-785-1121.
|
|
|

