You are not logged in.
This means you
CAN ONLY VIEW reports that were published prior to Sunday, April 13, 2025.
You
MUST UPGRADE YOUR MEMBERSHIP if you want to see any current reports.
AFTER MARKET UPDATE - MONDAY, SEPTEMBER 26TH, 2011
Previous After Market Report Next After Market Report >>>
|
|
|
|
DOW |
+272.38 |
11,043.86 |
+2.53% |
|
Volume |
1,157,378,560 |
-6% |
|
Volume |
1,945,914,540 |
+1% |
|
NASDAQ |
+33.46 |
2,516.69 |
+1.35% |
|
Advancers |
2,209 |
71% |
|
Advancers |
1,669 |
62% |
|
S&P 500 |
+26.52 |
1,162.95 |
+2.33% |
|
Decliners |
819 |
26% |
|
Decliners |
938 |
35% |
|
Russell 2000 |
+13.19 |
665.62 |
+2.02% |
|
52 Wk Highs |
7 |
|
|
52 Wk Highs |
9 |
|
|
S&P 600 |
+7.54 |
365.43 |
+2.11% |
|
52 Wk Lows |
225 |
|
|
52 Wk Lows |
206 |
|
|
 |
Volume Totals Unimpressive Behind Big Afternoon Gains
Kenneth J. Gruneisen - Passed the CAN SLIM® Master's Exam
The Dow Industrials, S&P 500 Index, and the Nasdaq Composite Index finished Monday afternoon rallying. However, a slightly lower volume total was reported on the NYSE and volume was barely higher on the Nasdaq exchange, action suggesting that institutional investors still did not have a very hearty appetite for buying stocks. Breadth was positive as advancing issues beat decliners by 11-4 on the NYSE and by 16-9 on the Nasdaq exchange. The new 52-week lows totals still greatly outnumbered new 52-week highs on both the Nasdaq exchange and the NYSE while new highs totals on both exchanges remained in the single digits for a third consecutive session. There were 2 high-ranked companies from the CANSLIM.net Leaders List that made new 52-week highs and appeared on the CANSLIM.net BreakOuts Page, up from 1 on the prior session. There were gains from 7 of the 15 high-ranked companies currently included on the Featured Stocks Page.
As discussions began in Europe on containing the continent's debt crisis, reports said the European Central bank may consider borrowing against the existing bank bailout fund to increase its effective size. They were said to be debating re-starting covered-bond purchases, and they were not ruling out a cut in interest rates.
Financial stocks were stronger. Treasury yields rose from almost record lows as stocks rallied. German bank Deutsche Bank (DB +12.16%) rallied in New York trading. Berkshire Hathaway Class B (BRKB +8.62%) rose after the company announced a stock buyback program, the first share repurchase program by Buffett in four decades.
Technology stocks had to battle weakness in Apple Inc (AAPL -0.28%), which pared its early loss, but struggled after an analyst said the company is cutting orders to vendors in its supply chain for the iPad tablet computer. Energy and mining sectors were at the forefront of Monday's revival as commodities reversed early declines.
Dow component Boeing Co's (BA +4.20%) shares finished higher after delivering to All Nippon Airways its first 787 Dreamliner more than three years behind schedule. Homebuilding stocks were little changed as investors appeared numb to the latest weak report on U.S. housing. New home sales declined in August to a six-month low. The biggest drop in prices in two years failed to lure buyers away from even less expensive distressed properties.
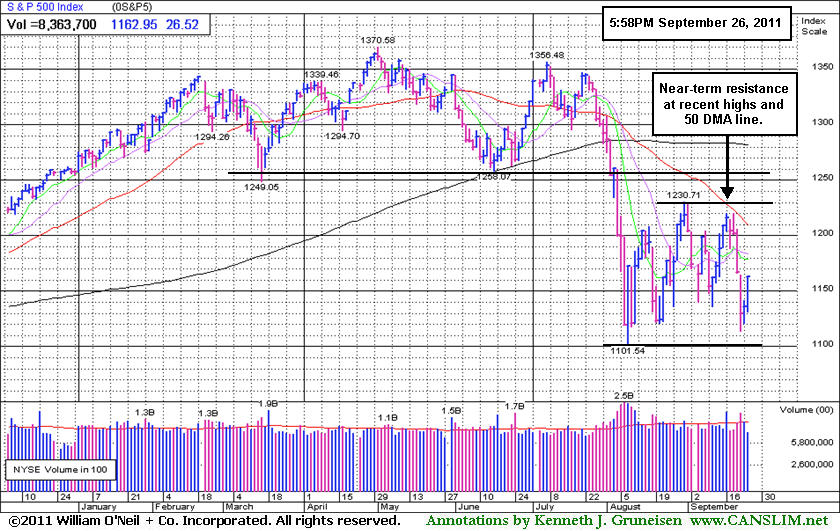
The market environment (M criteria) is clearly under pressure and back in a correction after the heavy wave of distributional action last week. The latest confirmed rally may, at best, be considered barely alive by the fact that the Nasdaq Composite Index and S&P 500 Index are still fighting to stay above their respective Day 1 (8/09/11) lows.
The September 2011 issue of CANSLIM.net News is now available - (click here). The Q3 2011 Webcast airs on Wednesday, September 28th at 8PM EST. Links to all prior reports and webcasts are available on the Premium Member Homepage.
PICTURED: The S&P 500 Index faces near-term resistance at its 50-day moving average (DMA) line and recent chart highs.
|
 Kenneth J. Gruneisen started out as a licensed stockbroker in August 1987, a couple of months prior to the historic stock market crash that took the Dow Jones Industrial Average down -22.6% in a single day. He has published daily fact-based fundamental and technical analysis on high-ranked stocks online for two decades. Through FACTBASEDINVESTING.COM, Kenneth provides educational articles, news, market commentary, and other information regarding proven investment systems that work in good times and bad.
Comments contained in the body of this report are technical opinions only and are not necessarily those of Gruneisen Growth Corp. The material herein has been obtained from sources believed to be reliable and accurate, however, its accuracy and completeness cannot be guaranteed. Our firm, employees, and customers may effect transactions, including transactions contrary to any recommendation herein, or have positions in the securities mentioned herein or options with respect thereto. Any recommendation contained in this report may not be suitable for all investors and it is not to be deemed an offer or solicitation on our part with respect to the purchase or sale of any securities. |
|
 |
Financial, Energy, Retail, and Defensive Groups Rose
Kenneth J. Gruneisen - Passed the CAN SLIM® Master's Exam
The Bank Index ($BKX +5.29%) and Broker/Dealer Index ($XBD +2.84%) posted solid gains and helped underpin the major averages' gains on Monday. The Retail Index ($RLX +2.39%) also had a positive influence, as did defensive groups including the Healthcare Index ($HMO +1.78%) and Gold & Silver Index ($XAU +1.99%). Energy-related shares powered higher as the Oil Services Index ($OSX +3.23%) and Integrated Oil Index ($XOI +3.65%) got a boost. The Internet Index ($IIX +1.52%) and Networking Index ($NWX +2.11%) led the tech sector higher while the Biotechnology Index ($BTK +0.49%) posted a smaller gain and the Semiconductor Index ($SOX -0.13%) lagged and finished the session with a small loss.
Charts courtesy www.stockcharts.com
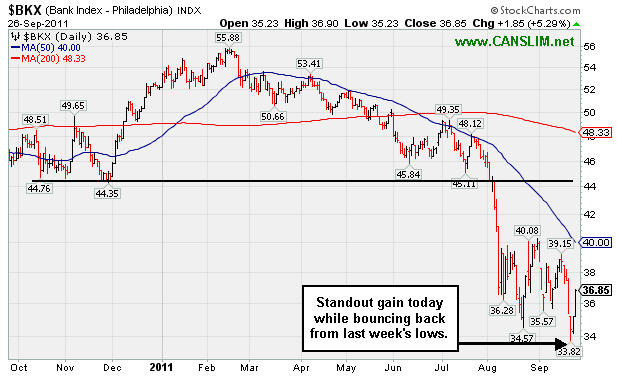
PICTURED: The Bank Index ($BKX +5.29%) posted a standout gain today while bouncing back from last week's lows.
| Oil Services |
$OSX |
207.50 |
+6.50 |
+3.23% |
-15.35% |
| Healthcare |
$HMO |
1,967.23 |
+34.40 |
+1.78% |
+16.27% |
| Integrated Oil |
$XOI |
1,065.08 |
+37.46 |
+3.65% |
-12.21% |
| Semiconductor |
$SOX |
359.50 |
-0.45 |
-0.13% |
-12.70% |
| Networking |
$NWX |
224.03 |
+4.63 |
+2.11% |
-20.15% |
| Internet |
$IIX |
275.92 |
+4.14 |
+1.52% |
-10.34% |
| Broker/Dealer |
$XBD |
83.90 |
+2.32 |
+2.84% |
-30.96% |
| Retail |
$RLX |
518.20 |
+12.12 |
+2.39% |
+1.93% |
| Gold & Silver |
$XAU |
192.68 |
+3.76 |
+1.99% |
-14.96% |
| Bank |
$BKX |
36.85 |
+1.85 |
+5.29% |
-29.42% |
| Biotech |
$BTK |
1,148.14 |
+5.63 |
+0.49% |
-11.52% |
|
|
|
 |
Distributional Damage Followed Recent Mid-Day Report Appearance
Kenneth J. Gruneisen - Passed the CAN SLIM® Master's Exam
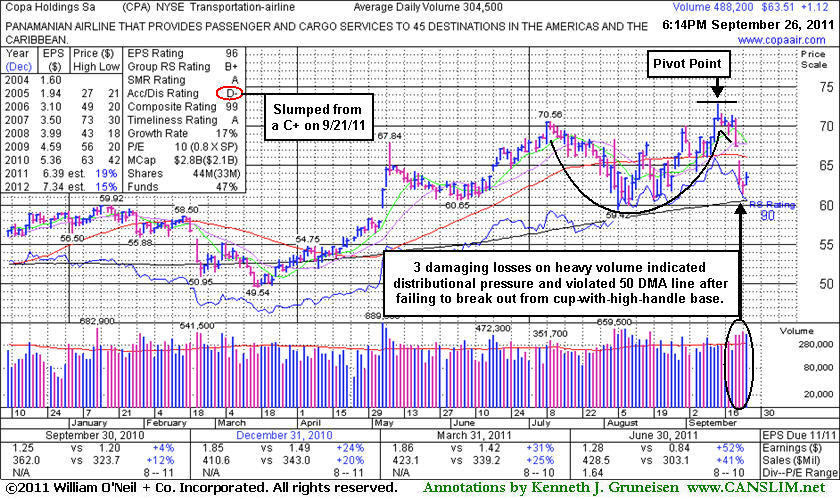
Copa Holdings Sa (CPA +$1.12 or +1.80% to $63.51) posted a gain today with above average volume. An annotated weekly graph was included as it was highlighted in yellow in the 9/21/11 mid-day report (read here) while forming a cup-with-high-handle type base pattern with a pivot point based on its 9/14/11 high. However, it finished that session on a sour note with a loss that was the first in a streak of 3 consecutive losses with above average volume including a 9/22/11 gap down that violated its 50-day moving average (DMA) line raising concerns.
It is normally best if the volume totals are light while a "handle" is formed, so it was noted that the distributional loss it immediately suffered may not bode well. Additionally, as it was noted - "Confirming gains with heavy volume for a new high close are needed before disciplined investors might consider this high-ranked Panama-based airline a legitimate buy candidate." It reported earnings +52% on +41% sales revenues for the quarter ended June 30, 2011 versus the year ago period. Sales revenues and earnings have improved in the 3 most recent quarterly comparisons (Dec '10, Mar and Jun '11) after a streak of negative or weak comparisons. Annual earnings (the A criteria) growth has been good, and increasing institutional ownership (the I criteria) is an encouraging sign.
It may again find support above its 200 DMA line and prior highs in the $59 area like it did during its recent consolidation. The Accumulation/Distribution rank has slumped from a C+ when last shown in this FSU section on 9/21/11 to a D- today (see red circle). It obviously has some work to do before it might reach a new 52-week high and rally again within close striking distance of its 2007 all-time high ($73.33). In the meanwhile, any fundamental disappointment could hurt its chances of becoming an action-worthy buy candidate. A poor market environment (M criteria) also argues for now against new buying efforts until there is a new confirmed rally.
|
|
|
Color Codes Explained :
Y - Better candidates highlighted by our
staff of experts.
G - Previously featured
in past reports as yellow but may no longer be buyable under the
guidelines.
***Last / Change / Volume data in this table is the closing quote data***
Microsoft OLE DB Provider for SQL Server error '80004005'
[DBNETLIB][ConnectionOpen (Connect()).]SQL Server does not exist or access denied.
/FeaturedStocks/featuredraw.asp, line 157
|
|
|
THESE ARE NOT BUY RECOMMENDATIONS!
Comments contained in the body of this report are technical
opinions only. The material herein has been obtained
from sources believed to be reliable and accurate, however,
its accuracy and completeness cannot be guaranteed.
This site is not an investment advisor, hence it does
not endorse or recommend any securities or other investments.
Any recommendation contained in this report may not
be suitable for all investors and it is not to be deemed
an offer or solicitation on our part with respect to
the purchase or sale of any securities. All trademarks,
service marks and trade names appearing in this report
are the property of their respective owners, and are
likewise used for identification purposes only.
This report is a service available
only to active Paid Premium Members.
You may opt-out of receiving report notifications
at any time. Questions or comments may be submitted
by writing to Premium Membership Services 665 S.E. 10 Street, Suite 201 Deerfield Beach, FL 33441-5634 or by calling 1-800-965-8307
or 954-785-1121.
|
|
|

