You are not logged in.
This means you
CAN ONLY VIEW reports that were published prior to Monday, April 14, 2025.
You
MUST UPGRADE YOUR MEMBERSHIP if you want to see any current reports.
AFTER MARKET UPDATE - FRIDAY, SEPTEMBER 26TH, 2014
Previous After Market Report Next After Market Report >>>
|
|
|
|
DOW |
+167.35 |
17,113.15 |
+0.99% |
|
Volume |
616,902,950 |
-14% |
|
Volume |
1,522,266,690 |
-15% |
|
NASDAQ |
+45.44 |
4,512.19 |
+1.02% |
|
Advancers |
2,241 |
71% |
|
Advancers |
1,912 |
67% |
|
S&P 500 |
+16.86 |
1,982.85 |
+0.86% |
|
Decliners |
829 |
26% |
|
Decliners |
865 |
30% |
|
Russell 2000 |
+9.09 |
1,119.33 |
+0.82% |
|
52 Wk Highs |
17 |
|
|
52 Wk Highs |
31 |
|
|
S&P 600 |
+4.12 |
643.65 |
+0.64% |
|
52 Wk Lows |
142 |
|
|
52 Wk Lows |
95 |
|
|
 |
Market Rebounded With Less Volume Conviction Behind Gains
Kenneth J. Gruneisen - Passed the CAN SLIM® Master's Exam
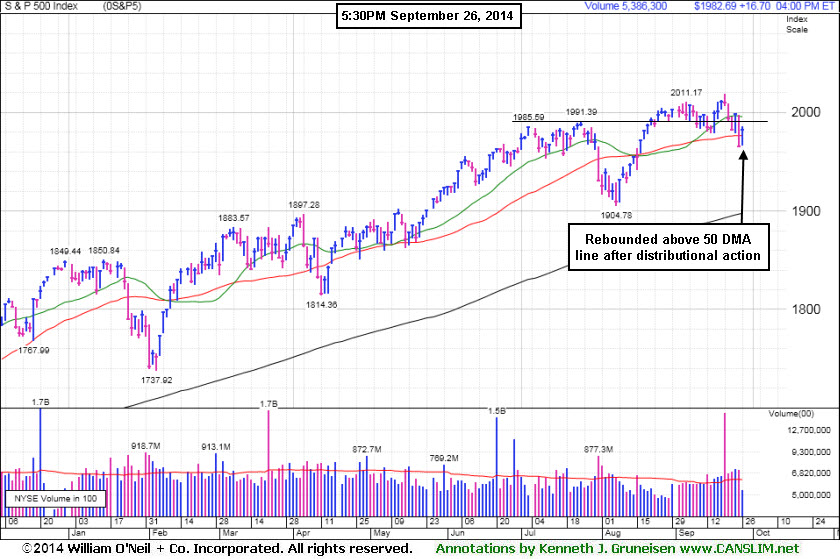
For the week, the Nasdaq Composite Index lost -1.48%, the S&P 500 Index fell -1.38% and the Dow Jones Industrial Average shed -0.97%. Friday's gains helped the S&P 500 Index and Nasdaq Composite Index both rebound above their respective 50-day moving average (DMA) lines. Behind the gains, however, the volume totals were reported lighter than the prior session totals on the NYSE and on the Nasdaq exchange, a sign of lackluster buying demand from large institutional investors. Breadth was positive as advancers led decliners by an 11-4 margin on the NYSE and by more than 2-1 on the NASDAQ exchange. There were 9 high-ranked companies from the CANSLIM.net Leaders List that made new 52-week highs and appeared on the CANSLIM.net BreakOuts Page, matching the prior session total of 9 stocks. New 52-week lows outnumbered new 52-week highs on the NYSE and on the Nasdaq exchange. There were gains for 10 of the 11 high-ranked companies currently included on the Featured Stocks Page. Distributional action raised concerns while leadership (stocks hitting new 52-week highs) waned and a deteriorating market (M criteria) environment was noted this week. Remember that the fact-based investment system prompts disciplined investors to reduce market exposure by selling any faltering stocks during rough market periods.
PICTURED: The S&P 500 advanced 16 points to 1,982, rebounding to end the week above its 50-day moving average after a spurt of damaging losses with above average volume.
Stocks finished Friday's session higher. The Dow gained 167 points to 17,113, and the NASDAQ finished 45 points higher at 4,512, as the major averages rebounded from Thursday's rout. Investors focused on positive economic data and corporate activity.
The economy expanded at a 4.6% pace in the second quarter, in line with estimates. Personal consumption also held steady at a 2.5% rate in the second quarter. A gauge of consumer confidence from the University of Michigan rose in September to 84.6 from 82.5 in August.
In company news, Janus Capital Group, Inc. (JNS +43.02%) rallied after Bill Gross announced he would be joining the firm, meanwhile there was a decline for Allianz (AZSEY -6.14%), Gross' previous firm. Following positive earnings announcements, Nike (NKE +12.23%) and Micron Technologies (MU +6.72%) rallied.
At the close all 10 sectors of the S&P 500 were higher. Energy and tech stocks led the rally. Halliburton (HAL +3.49%) rose as the price of WTI crude climbed +1% to $93.44. Apple (AAPL +2.94%) helped lift the tech sector. Weakness in PPL Corp (PPL -0.30%) helped the defensive utilities sector to be an underperformer.
Treasuries fell on the session. The benchmark 10-year note lost 8/32 to yield 2.53%.
The CANSLIM.net Featured Stocks Page shows the most action-worthy candidates and their latest notes and a Headline Link directs members to the latest detailed analysis with data-packed graphs annotated by a Certified expert along with links to additional resources. The Premium Member Homepage includes "dynamic archives" to all prior pay reports published.
|
 Kenneth J. Gruneisen started out as a licensed stockbroker in August 1987, a couple of months prior to the historic stock market crash that took the Dow Jones Industrial Average down -22.6% in a single day. He has published daily fact-based fundamental and technical analysis on high-ranked stocks online for two decades. Through FACTBASEDINVESTING.COM, Kenneth provides educational articles, news, market commentary, and other information regarding proven investment systems that work in good times and bad.
Comments contained in the body of this report are technical opinions only and are not necessarily those of Gruneisen Growth Corp. The material herein has been obtained from sources believed to be reliable and accurate, however, its accuracy and completeness cannot be guaranteed. Our firm, employees, and customers may effect transactions, including transactions contrary to any recommendation herein, or have positions in the securities mentioned herein or options with respect thereto. Any recommendation contained in this report may not be suitable for all investors and it is not to be deemed an offer or solicitation on our part with respect to the purchase or sale of any securities. |
|
 |
Financial, Retail, Tech and Energy Groups Rose
Kenneth J. Gruneisen - Passed the CAN SLIM® Master's Exam
Modest gains from financial shares had a positive influence on the major averages on Friday as the Bank Index ($BKX +0.64%) and the Broker/Dealer Index ($XBD +0.72%) rose. The Retail Index ($RLX +0.72%) also posted a modest gain. The Semiconductor Index ($SOX +1.25%) led the tech sector higher while the Biotechnology Index ($BTK +0.89%) and the Networking Index ($NWX +0.46%) each tallied a smaller gain. Commodity-linked groups were mixed as gains in energy-related shares boosted the Integrated Oil Index ($XOI +1.07%) and the Oil Services Index ($OSX +1.51%), meanwhile, the Gold & Silver Index ($XAU -1.21%) was a standout laggard as it fell.
Charts courtesy www.stockcharts.com
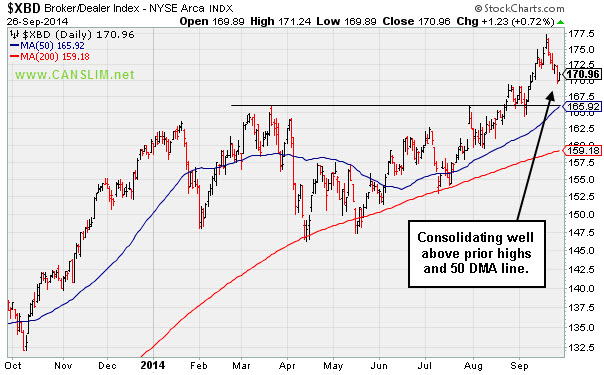
PICTURED: The Broker/Dealer Index ($XBD +0.72%) is consolidating well above prior highs and above its 50-day moving average (DMA) line. Healthy action in the financial indexes is a reassuring sign as a "leading indicator", whereas the major averages have been prone to their most severe downdrafts when financial stocks were already showing technical weakness. Damaging losses leading to deterioration in the weeks ahead would bode poorly for the broader market outlook.
Charts courtesy www.stockcharts.com
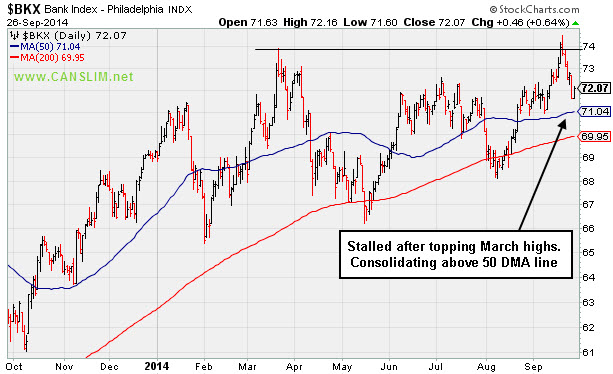
PICTURED: The Bank Index ($BKX +0.64%) stalled after briefly topping its March highs and it is consolidating above its 50-day moving average (DMA) line.
| Oil Services |
$OSX |
271.77 |
+4.03 |
+1.51% |
-3.30% |
| Integrated Oil |
$XOI |
1,583.15 |
+16.82 |
+1.07% |
+5.32% |
| Semiconductor |
$SOX |
643.34 |
+7.92 |
+1.25% |
+20.24% |
| Networking |
$NWX |
325.31 |
+1.47 |
+0.46% |
+0.42% |
| Broker/Dealer |
$XBD |
170.96 |
+1.23 |
+0.72% |
+6.48% |
| Retail |
$RLX |
938.39 |
+6.75 |
+0.72% |
-0.15% |
| Gold & Silver |
$XAU |
83.92 |
-1.03 |
-1.21% |
-0.27% |
| Bank |
$BKX |
72.07 |
+0.46 |
+0.64% |
+4.06% |
| Biotech |
$BTK |
3,127.09 |
+27.68 |
+0.89% |
+34.19% |
|
|
|
 |
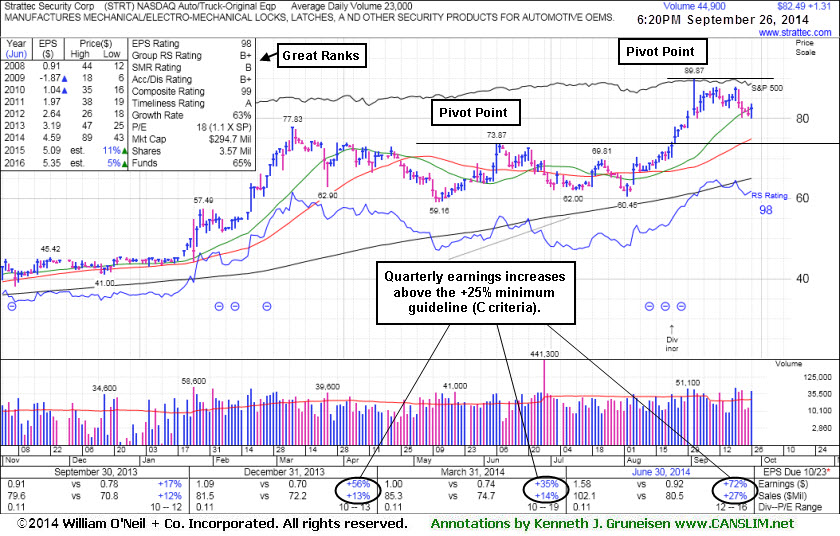
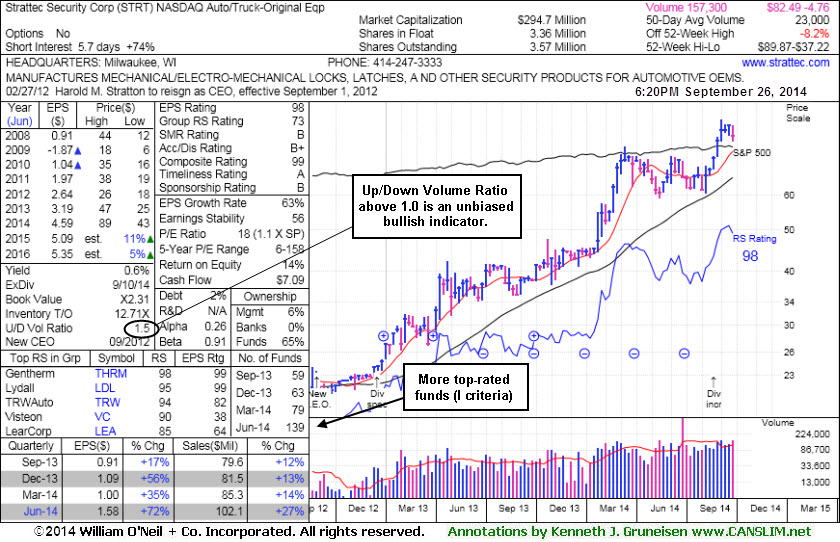
Consolidating Above Prior Highs and 50-Day Moving Average Line
Kenneth J. Gruneisen - Passed the CAN SLIM® Master's Exam
Strattec Security Corp (STRT +$1.31 or +1.61% to $82.49) is perched -8.2% off its 52-week high. It has pulled back after forming an advanced "3-weeks tight" base. Subsequent volume-driven gains above the new pivot point cited may trigger a new (or add-on) technical buy signal. Its 50-day moving average (DMA) line ($74.87) and prior highs define important support to watch on pullbacks.
STRT was last shown in this FSU section on 9/10/14 with annotated graphs under the headline, "Extended From Prior Highs and Previously Noted Base". It was first highlighted in yellow at $71.47 with pivot point based on its 6/06/14 high plus 10 cents in the 8/22/14 mid-day report (read here).
Quarterly earnings increases through Jun '14 above the +25% minimum guideline satisfy the C criteria and its annual earnings (A criteria) history has been strong. Increasing ownership by top-rated funds (I criteria) is a reassuring sign. The number of top-rated funds owning its shares rose from 59 in Sep '14 to 139 in Jun '14, a very reassuring sign concerning the I criteria. Its current Up/Down Volume Ratio of 1.5 is an unbiased indication its shares have been under accumulation over the past 50 days. The Auto/Truck - Original Equipment group's strong Group Relative Strength rank is a reassuring sign concerning the L criteria. The thinly-traded stock has a small supply (S criteria) of only 3.36 million shares in the public float which can contribute to greater price volatility in the event of institutional buying or selling.
|
|
|
Color Codes Explained :
Y - Better candidates highlighted by our
staff of experts.
G - Previously featured
in past reports as yellow but may no longer be buyable under the
guidelines.
***Last / Change / Volume data in this table is the closing quote data***
Symbol/Exchange
Company Name
Industry Group |
PRICE |
CHANGE
(%Change) |
Day High |
Volume
(% DAV)
(% 50 day avg vol) |
52 Wk Hi
% From Hi |
Featured
Date |
Price
Featured |
Pivot Featured |
|
Max Buy |
ACT
-
NYSE
Actavis plc
Medical-Generic Drugs
|
$244.64
|
+0.11
0.04% |
$245.72
|
1,729,815
76.00% of 50 DAV
50 DAV is 2,276,000
|
$249.94
-2.12%
|
6/20/2014
|
$216.53
|
PP = $230.87
|
|
MB = $242.41
|
Most Recent Note - 9/24/2014 5:28:51 PM
G - Finished at a best-ever close well above its "max buy" level and its color code is changed to green. Prior highs near $230 define near-term support to watch on pullbacks.
>>> FEATURED STOCK ARTICLE : Finally Volume-backed Gains Confirmed a Technical Buy Signal - 9/19/2014
View all notes |
Set NEW NOTE alert |
CANSLIM.net Company Profile |
SEC
News |
Chart |
Request a new note
C
A N
S L
I M


|
BITA
-
NYSE
Bitauto Hldgs Ltd Ads
Internet-Content
|
$78.93
|
+3.37
4.46% |
$79.70
|
866,746
50.10% of 50 DAV
50 DAV is 1,730,000
|
$98.28
-19.69%
|
6/26/2014
|
$46.20
|
PP = $47.03
|
|
MB = $49.38
|
 Most Recent Note - 9/26/2014 6:57:44 PM
G - Rose today with light volume, halting its slide at its 50 DMA line ($74.72). A violation would raise concerns and trigger a technical sell signal. Noted repeatedly with caution - "Has the look of a 'climax run' with volume-driven gains getting very extended from its prior base."
>>> FEATURED STOCK ARTICLE : Volume Totals Recently Cooling After Halting Slide - 9/18/2014
View all notes |
Set NEW NOTE alert |
CANSLIM.net Company Profile |
SEC
News |
Chart |
Request a new note
C
A N
S L
I M
|
FB
-
NASDAQ
Facebook Inc Cl A
INTERNET
|
$78.79
|
+1.57
2.03% |
$78.84
|
27,477,204
76.49% of 50 DAV
50 DAV is 35,922,000
|
$78.94
-0.19%
|
9/9/2014
|
$76.67
|
PP = $76.84
|
|
MB = $80.68
|
Most Recent Note - 9/25/2014 6:09:18 PM
Y - Reversed into the red for a loss on near average volume after touching a new high. Its 50 DMA line ($74.60) defines important near term support. See the latest FSU analysis for more details and new annotated graphs.
>>> FEATURED STOCK ARTICLE : Fell Toward 50-day Moving Average; Recent Gains Lacked Great Volume - 9/25/2014
View all notes |
Set NEW NOTE alert |
CANSLIM.net Company Profile |
SEC
News |
Chart |
Request a new note
C
A N
S L
I M
|
NVGS
-
NYSE
Navigator Holdings Ltd
Transportation-Ship
|
$28.99
|
+0.13
0.45% |
$29.25
|
165,840
65.55% of 50 DAV
50 DAV is 253,000
|
$31.90
-9.12%
|
9/16/2014
|
$30.33
|
PP = $30.56
|
|
MB = $32.09
|
Most Recent Note - 9/25/2014 12:55:52 PM
G - Up from the session's earlier lows after violating its 50 DMA line with a damaging volume-driven loss triggering a technical sell signal. Color code was changed to green. Only a prompt rebound above the 50 DMA line would help its outlook improve. Disciplined investors do not chase stocks more than +5% above their pivot point, and they always limit losses by selling if any stock falls more than -7% from their purchase price.
>>> FEATURED STOCK ARTICLE : Finished Strong While Challenging Pivot Point and Recent Highs - 9/16/2014
View all notes |
Set NEW NOTE alert |
CANSLIM.net Company Profile |
SEC
News |
Chart |
Request a new note
C
A N
S L
I M
|
NXPI
-
NASDAQ
Nxp Semiconductors N V
ELECTRONICS - Semiconductor - Broad Line
|
$71.09
|
+1.28
1.83% |
$71.37
|
1,773,321
51.40% of 50 DAV
50 DAV is 3,450,000
|
$73.82
-3.70%
|
8/29/2014
|
$68.50
|
PP = $67.89
|
|
MB = $71.28
|
Most Recent Note - 9/25/2014 6:13:35 PM
Y- Color code is changed to yellow after dipping below its "max buy" level. Weakening market conditions (M criteria) are prompting investors to reduce exposure in any faltering stocks and avoid new buying efforts until strength returns. Prior highs in the $67 area define initial support to watch on pullbacks.
>>> FEATURED STOCK ARTICLE : Consolidating Above Pivot Point and Below "Max Buy" Level - 9/17/2014
View all notes |
Set NEW NOTE alert |
CANSLIM.net Company Profile |
SEC
News |
Chart |
Request a new note
C
A N
S L
I M
|
Symbol/Exchange
Company Name
Industry Group |
PRICE |
CHANGE
(%Change) |
Day High |
Volume
(% DAV)
(% 50 day avg vol) |
52 Wk Hi
% From Hi |
Featured
Date |
Price
Featured |
Pivot Featured |
|
Max Buy |
PANW
-
NYSE
Palo Alto Networks
Computer Sftwr-Security
|
$97.95
|
+1.65
1.71% |
$98.15
|
1,050,960
63.01% of 50 DAV
50 DAV is 1,668,000
|
$102.45
-4.39%
|
7/30/2014
|
$84.21
|
PP = $85.88
|
|
MB = $90.17
|
Most Recent Note - 9/24/2014 5:31:05 PM
G - Holding its ground near all-time highs with volume totals cooling. Prior highs in the $87 area define initial support to watch above its 50 DMA line ($86.74). Disciplined investors avoid chasing extended stocks. See the latest FSU analysis for more details and new annotated graphs.
>>> FEATURED STOCK ARTICLE : Holding Ground Near Highs After Big Volume-Driven Gains - 9/24/2014
View all notes |
Set NEW NOTE alert |
CANSLIM.net Company Profile |
SEC
News |
Chart |
Request a new note
C
A N
S L
I M
|
STRT
-
NASDAQ
Strattec Security Corp
AUTOMOTIVE - Auto Parts
|
$82.49
|
+1.31
1.61% |
$83.78
|
44,904
195.23% of 50 DAV
50 DAV is 23,000
|
$89.87
-8.22%
|
9/19/2014
|
$86.06
|
PP = $89.97
|
|
MB = $94.47
|
Most Recent Note - 9/26/2014 6:55:39 PM
Y - Subsequent volume-driven gains above the new pivot point cited may trigger a new (or add-on) technical buy signal. Its 50 DMA line and prior highs define important support to watch on pullbacks. See the latest FSU analysis for more details and new annotated graphs.
>>> FEATURED STOCK ARTICLE : Consolidating Above Prior Highs and 50-Day Moving Average Line - 9/26/2014
View all notes |
Set NEW NOTE alert |
CANSLIM.net Company Profile |
SEC
News |
Chart |
Request a new note
C
A N
S L
I M
|
TARO
-
NYSE
Taro Pharmaceutical Inds
DRUGS - Drug Manufacturers - Other
|
$158.86
|
+6.14
4.02% |
$159.76
|
127,224
146.23% of 50 DAV
50 DAV is 87,000
|
$165.30
-3.90%
|
7/30/2014
|
$144.24
|
PP = $149.99
|
|
MB = $157.49
|
Most Recent Note - 9/26/2014 12:32:51 PM
G - Still consolidating above its 50 DMA line after enduring recent distributional pressure. Repeatedly noted with caution - "Recently reported earnings for the Jun '14 quarter below the +25% minimum earnings guideline (C criteria) raising fundamental concerns."
>>> FEATURED STOCK ARTICLE : Consolidating Above 50-day Moving Average and Prior Highs - 9/23/2014
View all notes |
Set NEW NOTE alert |
CANSLIM.net Company Profile |
SEC
News |
Chart |
Request a new note
C
A N
S L
I M
|
TRN
-
NYSE
Trinity Industries Inc
TRANSPORTATION - Railroads
|
$47.86
|
-0.07
-0.15% |
$48.46
|
3,088,521
116.86% of 50 DAV
50 DAV is 2,643,000
|
$50.77
-5.74%
|
4/30/2014
|
$37.79
|
PP = $38.03
|
|
MB = $39.93
|
Most Recent Note - 9/22/2014 5:44:01 PM
G - Pulled back today with above average volume following 4 consecutive volume-driven gains. It has not formed a sound base. Prior highs near $46-47 define near-term support above its 50 DMA line.
>>> FEATURED STOCK ARTICLE : Consolidating Above 50-Day Moving Average Line - 9/12/2014
View all notes |
Set NEW NOTE alert |
CANSLIM.net Company Profile |
SEC
News |
Chart |
Request a new note
C
A N
S L
I M
|
UA
-
NYSE
Under Armour Inc Cl A
CONSUMER NON-DURABLES - Textile - Apparel Clothing
|
$69.82
|
+2.27
3.36% |
$70.57
|
4,418,261
179.75% of 50 DAV
50 DAV is 2,458,000
|
$73.42
-4.90%
|
7/10/2014
|
$58.50
|
PP = $60.79
|
|
MB = $63.83
|
Most Recent Note - 9/26/2014 12:35:07 PM
G - Consolidating above its 50 DMA line within striking distance of its 52-week high. Prior notes cautioned members - "Fundamental concerns were raised by earnings reported +0% on +34% sales revenues for the Jun '14 quarter, below the +25% minimum earnings guideline (C criteria)."
>>> FEATURED STOCK ARTICLE : Higher Volume Behind Loss Testing 50-Day Moving Average - 9/15/2014
View all notes |
Set NEW NOTE alert |
CANSLIM.net Company Profile |
SEC
News |
Chart |
Request a new note
C
A N
S L
I M
|
Symbol/Exchange
Company Name
Industry Group |
PRICE |
CHANGE
(%Change) |
Day High |
Volume
(% DAV)
(% 50 day avg vol) |
52 Wk Hi
% From Hi |
Featured
Date |
Price
Featured |
Pivot Featured |
|
Max Buy |
WLK
-
NYSE
Westlake Chemical Corp
CHEMICALS - Specialty Chemicals
|
$91.25
|
+1.12
1.24% |
$91.75
|
538,228
103.51% of 50 DAV
50 DAV is 520,000
|
$98.44
-7.30%
|
4/29/2014
|
$72.79
|
PP = $69.31
|
|
MB = $72.78
|
Most Recent Note - 9/23/2014 5:16:07 PM
G - Churned higher volume today while slumping and testing prior highs in the $92 area and its 50 DMA line ($91.50). More damaging losses would raise greater concerns and trigger technical sell signals. Recent fundamental concerns were noted.
>>> FEATURED STOCK ARTICLE : Consolidating Above Near-Term Support Levels - 9/11/2014
View all notes |
Set NEW NOTE alert |
CANSLIM.net Company Profile |
SEC
News |
Chart |
Request a new note
C
A N
S L
I M
|
|
|
|
THESE ARE NOT BUY RECOMMENDATIONS!
Comments contained in the body of this report are technical
opinions only. The material herein has been obtained
from sources believed to be reliable and accurate, however,
its accuracy and completeness cannot be guaranteed.
This site is not an investment advisor, hence it does
not endorse or recommend any securities or other investments.
Any recommendation contained in this report may not
be suitable for all investors and it is not to be deemed
an offer or solicitation on our part with respect to
the purchase or sale of any securities. All trademarks,
service marks and trade names appearing in this report
are the property of their respective owners, and are
likewise used for identification purposes only.
This report is a service available
only to active Paid Premium Members.
You may opt-out of receiving report notifications
at any time. Questions or comments may be submitted
by writing to Premium Membership Services 665 S.E. 10 Street, Suite 201 Deerfield Beach, FL 33441-5634 or by calling 1-800-965-8307
or 954-785-1121.
|
|
|