You are not logged in.
This means you
CAN ONLY VIEW reports that were published prior to Wednesday, April 9, 2025.
You
MUST UPGRADE YOUR MEMBERSHIP if you want to see any current reports.
AFTER MARKET UPDATE - MONDAY, SEPTEMBER 29TH, 2014
Previous After Market Report Next After Market Report >>>
|
|
|
|
DOW |
-41.93 |
17,071.22 |
-0.25% |
|
Volume |
638,992,660 |
+4% |
|
Volume |
1,604,112,580 |
+5% |
|
NASDAQ |
-6.34 |
4,505.85 |
-0.14% |
|
Advancers |
1,273 |
40% |
|
Advancers |
1,192 |
42% |
|
S&P 500 |
-5.05 |
1,977.80 |
-0.25% |
|
Decliners |
1,817 |
57% |
|
Decliners |
1,571 |
55% |
|
Russell 2000 |
-1.43 |
1,117.90 |
-0.13% |
|
52 Wk Highs |
28 |
|
|
52 Wk Highs |
35 |
|
|
S&P 600 |
-0.54 |
643.11 |
-0.08% |
|
52 Wk Lows |
172 |
|
|
52 Wk Lows |
122 |
|
|
 |
Major Averages Fell With Higher Volume Totals on Exchanges
Kenneth J. Gruneisen - Passed the CAN SLIM® Master's Exam
The major averages pared losses to finish modestly lower on Monday. The Dow fell 42 points to 17,071. The S&P 500 lost 5 points at 1,977. The NASDAQ declined 6 points to 4,505. The S&P 500 Index and Nasdaq Composite Index both rebounded to finish above their respective 50-day moving average (DMA) lines after undercutting the 50 DMA line intra-day. The volume totals were reported higher than the prior session totals on the NYSE and on the Nasdaq exchange, a sign of selling pressure from large institutional investors. Breadth was negative as decliners led advances by a 3-2 margin on the NYSE and 5-4 on the NASDAQ exchange. There were 14 high-ranked companies from the CANSLIM.net Leaders List that made new 52-week highs and appeared on the CANSLIM.net BreakOuts Page, up from the prior session total of 9 stocks. New 52-week lows outnumbered new 52-week highs on the NYSE and on the Nasdaq exchange. There were gains for 3 of the 11 high-ranked companies currently included on the Featured Stocks Page. Distributional action raised concerns while leadership (stocks hitting new 52-week highs) waned and a deteriorating market (M criteria) environment was noted last week. Remember that the fact-based investment system prompts disciplined investors to reduce market exposure by selling any faltering stocks during rough market periods.
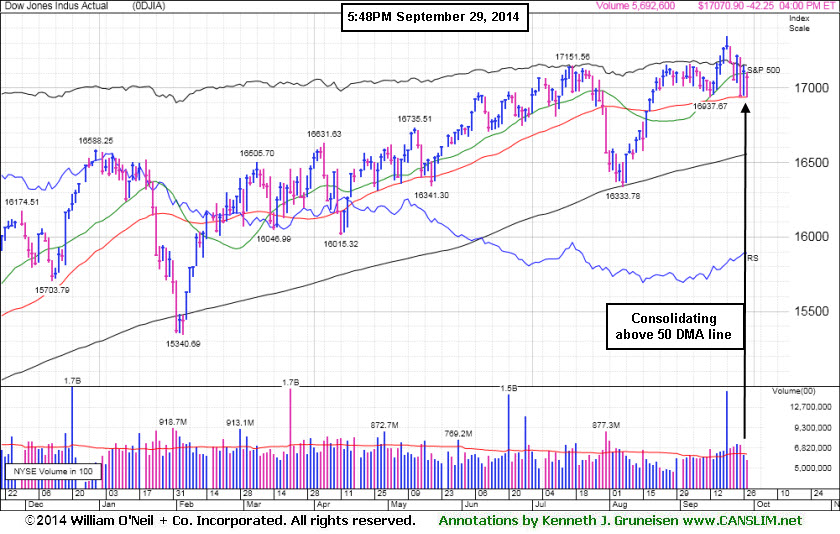
PICTURED: The Dow Jones Industrial Average Is consolidating above its 50-day moving average (DMA) line.
The major averages were down amid mixed economic data and geopolitical uncertainty. Personal spending surprisingly increased by 0.5% in August while pending home sales fell more than expected. The Dallas Fed reported manufacturing activity in the region rose by more than anticipated. On the geopolitical front, protests in Hong Kong shuttered the city, as the fight for democracy continued.
Nine of 10 sectors in the S&P 500 were in negative territory. Consumer discretionary paced the decline, while the defensive utilities sector limited losses. Ford (F -7.5%) fell as it forecasted disappointing earnings results. Shares of NiSource (NI +5.9%) rose after the company disclosed plans to increase tax-efficiency. DreamWorks (DWA +26%) rallied on reports Japan's SoftBank (SFTBY -3.13%) may make a bid to buy the company.
Treasuries gained as the benchmark 10-year note advanced 13/32 to yield 2.48%. High yield securities continued their decline putting the sector on pace for its worst month in more than a year. In commodities, West Texas Intermediate crude oil gained 1% to $94.50 a barrel on the NYMEX. COMEX gold rose 0.3% to $1,217.50 an ounce
The CANSLIM.net Featured Stocks Page shows the most action-worthy candidates and their latest notes and a Headline Link directs members to the latest detailed analysis with data-packed graphs annotated by a Certified expert along with links to additional resources. The Premium Member Homepage includes "dynamic archives" to all prior pay reports published.
|
 Kenneth J. Gruneisen started out as a licensed stockbroker in August 1987, a couple of months prior to the historic stock market crash that took the Dow Jones Industrial Average down -22.6% in a single day. He has published daily fact-based fundamental and technical analysis on high-ranked stocks online for two decades. Through FACTBASEDINVESTING.COM, Kenneth provides educational articles, news, market commentary, and other information regarding proven investment systems that work in good times and bad.
Comments contained in the body of this report are technical opinions only and are not necessarily those of Gruneisen Growth Corp. The material herein has been obtained from sources believed to be reliable and accurate, however, its accuracy and completeness cannot be guaranteed. Our firm, employees, and customers may effect transactions, including transactions contrary to any recommendation herein, or have positions in the securities mentioned herein or options with respect thereto. Any recommendation contained in this report may not be suitable for all investors and it is not to be deemed an offer or solicitation on our part with respect to the purchase or sale of any securities. |
|
 |
Financial and Commodity-Linked Groups Led Decliners
Kenneth J. Gruneisen - Passed the CAN SLIM® Master's Exam
The Broker/Dealer Index ($XBD -0.98%) and the Bank Index ($BKX -0.46%) both lost ground. Weakness in energy-related shares dragged the Integrated Oil Index ($XOI -0.80%) and the Oil Services Index ($OSX -0.49%) lower. The Gold & Silver Index ($XAU -1.28%) also fell. The Retail Index ($RLX -0.33%) edged lower. Technology-related groups showed little decisiveness as the Networking Index ($NWX -0.13%) edged lower and the Semiconductor Index ($SOX +0.14%) and Biotechnology Index ($BTK +0.21%) posted small gains.
Charts courtesy www.stockcharts.com

PICTURED: The Biotechnology Index ($BTK +0.21%).is consolidating well above its prior highs and above its 50-day moving average (DMA) line.
| Oil Services |
$OSX |
270.43 |
-1.34 |
-0.49% |
-3.77% |
| Integrated Oil |
$XOI |
1,570.46 |
-12.69 |
-0.80% |
+4.48% |
| Semiconductor |
$SOX |
644.23 |
+0.89 |
+0.14% |
+20.41% |
| Networking |
$NWX |
324.88 |
-0.43 |
-0.13% |
+0.29% |
| Broker/Dealer |
$XBD |
169.28 |
-1.67 |
-0.98% |
+5.43% |
| Retail |
$RLX |
935.33 |
-3.06 |
-0.33% |
-0.48% |
| Gold & Silver |
$XAU |
82.85 |
-1.07 |
-1.28% |
-1.54% |
| Bank |
$BKX |
71.74 |
-0.33 |
-0.46% |
+3.58% |
| Biotech |
$BTK |
3,133.68 |
+6.59 |
+0.21% |
+34.47% |
|
|
|
 |
Submit Your Request for a Featured Stock Update
Kenneth J. Gruneisen - Passed the CAN SLIM® Master's Exam
There are few stocks currently included on the Featured Stocks list and none of the companies need additional review in detail with annotated graphs. At times like these we have an opportunity to look back and review previously featured stocks which were dropped. This can serve as an educational review of the investment system's tactics and a reminder that even high-ranked leaders eventually fall out of favor. If you wish to request for a specific stock to receive more detailed coverage in this section please use the inquiry form to submit your request. Thank you! |
|
|
Color Codes Explained :
Y - Better candidates highlighted by our
staff of experts.
G - Previously featured
in past reports as yellow but may no longer be buyable under the
guidelines.
***Last / Change / Volume data in this table is the closing quote data***
Symbol/Exchange
Company Name
Industry Group |
PRICE |
CHANGE
(%Change) |
Day High |
Volume
(% DAV)
(% 50 day avg vol) |
52 Wk Hi
% From Hi |
Featured
Date |
Price
Featured |
Pivot Featured |
|
Max Buy |
ACT
-
NYSE
Actavis plc
Medical-Generic Drugs
|
$244.39
|
-0.25
-0.10% |
$246.83
|
1,734,002
76.25% of 50 DAV
50 DAV is 2,274,000
|
$249.94
-2.22%
|
6/20/2014
|
$216.53
|
PP = $230.87
|
|
MB = $242.41
|
Most Recent Note - 9/24/2014 5:28:51 PM
G - Finished at a best-ever close well above its "max buy" level and its color code is changed to green. Prior highs near $230 define near-term support to watch on pullbacks.
>>> FEATURED STOCK ARTICLE : Finally Volume-backed Gains Confirmed a Technical Buy Signal - 9/19/2014
View all notes |
Set NEW NOTE alert |
CANSLIM.net Company Profile |
SEC
News |
Chart |
Request a new note
C
A N
S L
I M


|
BITA
-
NYSE
Bitauto Hldgs Ltd Ads
Internet-Content
|
$77.86
|
-1.07
-1.36% |
$78.77
|
843,644
48.68% of 50 DAV
50 DAV is 1,733,000
|
$98.28
-20.78%
|
6/26/2014
|
$46.20
|
PP = $47.03
|
|
MB = $49.38
|
Most Recent Note - 9/26/2014 6:57:44 PM
G - Rose today with light volume, halting its slide at its 50 DMA line ($74.72). A violation would raise concerns and trigger a technical sell signal. Noted repeatedly with caution - "Has the look of a 'climax run' with volume-driven gains getting very extended from its prior base."
>>> FEATURED STOCK ARTICLE : Volume Totals Recently Cooling After Halting Slide - 9/18/2014
View all notes |
Set NEW NOTE alert |
CANSLIM.net Company Profile |
SEC
News |
Chart |
Request a new note
C
A N
S L
I M
|
FB
-
NASDAQ
Facebook Inc Cl A
INTERNET
|
$79.00
|
+0.21
0.27% |
$79.20
|
33,969,437
95.06% of 50 DAV
50 DAV is 35,735,000
|
$78.94
0.08%
|
9/9/2014
|
$76.67
|
PP = $76.84
|
|
MB = $80.68
|
Most Recent Note - 9/25/2014 6:09:18 PM
Y - Reversed into the red for a loss on near average volume after touching a new high. Its 50 DMA line ($74.60) defines important near term support. See the latest FSU analysis for more details and new annotated graphs.
>>> FEATURED STOCK ARTICLE : Fell Toward 50-day Moving Average; Recent Gains Lacked Great Volume - 9/25/2014
View all notes |
Set NEW NOTE alert |
CANSLIM.net Company Profile |
SEC
News |
Chart |
Request a new note
C
A N
S L
I M
|
NVGS
-
NYSE
Navigator Holdings Ltd
Transportation-Ship
|
$28.59
|
-0.40
-1.38% |
$28.82
|
174,862
69.12% of 50 DAV
50 DAV is 253,000
|
$31.90
-10.38%
|
9/16/2014
|
$30.33
|
PP = $30.56
|
|
MB = $32.09
|
Most Recent Note - 9/25/2014 12:55:52 PM
G - Up from the session's earlier lows after violating its 50 DMA line with a damaging volume-driven loss triggering a technical sell signal. Color code was changed to green. Only a prompt rebound above the 50 DMA line would help its outlook improve. Disciplined investors do not chase stocks more than +5% above their pivot point, and they always limit losses by selling if any stock falls more than -7% from their purchase price.
>>> FEATURED STOCK ARTICLE : Finished Strong While Challenging Pivot Point and Recent Highs - 9/16/2014
View all notes |
Set NEW NOTE alert |
CANSLIM.net Company Profile |
SEC
News |
Chart |
Request a new note
C
A N
S L
I M
|
NXPI
-
NASDAQ
Nxp Semiconductors N V
ELECTRONICS - Semiconductor - Broad Line
|
$70.28
|
-0.81
-1.14% |
$70.82
|
1,883,280
54.97% of 50 DAV
50 DAV is 3,426,000
|
$73.82
-4.80%
|
8/29/2014
|
$68.50
|
PP = $67.89
|
|
MB = $71.28
|
Most Recent Note - 9/25/2014 6:13:35 PM
Y- Color code is changed to yellow after dipping below its "max buy" level. Weakening market conditions (M criteria) are prompting investors to reduce exposure in any faltering stocks and avoid new buying efforts until strength returns. Prior highs in the $67 area define initial support to watch on pullbacks.
>>> FEATURED STOCK ARTICLE : Consolidating Above Pivot Point and Below "Max Buy" Level - 9/17/2014
View all notes |
Set NEW NOTE alert |
CANSLIM.net Company Profile |
SEC
News |
Chart |
Request a new note
C
A N
S L
I M
|
Symbol/Exchange
Company Name
Industry Group |
PRICE |
CHANGE
(%Change) |
Day High |
Volume
(% DAV)
(% 50 day avg vol) |
52 Wk Hi
% From Hi |
Featured
Date |
Price
Featured |
Pivot Featured |
|
Max Buy |
PANW
-
NYSE
Palo Alto Networks
Computer Sftwr-Security
|
$99.28
|
+1.33
1.36% |
$99.67
|
1,468,016
88.54% of 50 DAV
50 DAV is 1,658,000
|
$102.45
-3.09%
|
7/30/2014
|
$84.21
|
PP = $85.88
|
|
MB = $90.17
|
Most Recent Note - 9/24/2014 5:31:05 PM
G - Holding its ground near all-time highs with volume totals cooling. Prior highs in the $87 area define initial support to watch above its 50 DMA line ($86.74). Disciplined investors avoid chasing extended stocks. See the latest FSU analysis for more details and new annotated graphs.
>>> FEATURED STOCK ARTICLE : Holding Ground Near Highs After Big Volume-Driven Gains - 9/24/2014
View all notes |
Set NEW NOTE alert |
CANSLIM.net Company Profile |
SEC
News |
Chart |
Request a new note
C
A N
S L
I M
|
STRT
-
NASDAQ
Strattec Security Corp
AUTOMOTIVE - Auto Parts
|
$81.62
|
-0.87
-1.05% |
$82.44
|
17,437
75.81% of 50 DAV
50 DAV is 23,000
|
$89.87
-9.18%
|
9/19/2014
|
$86.06
|
PP = $89.97
|
|
MB = $94.47
|
Most Recent Note - 9/26/2014 6:55:39 PM
Y - Subsequent volume-driven gains above the new pivot point cited may trigger a new (or add-on) technical buy signal. Its 50 DMA line and prior highs define important support to watch on pullbacks. See the latest FSU analysis for more details and new annotated graphs.
>>> FEATURED STOCK ARTICLE : Consolidating Above Prior Highs and 50-Day Moving Average Line - 9/26/2014
View all notes |
Set NEW NOTE alert |
CANSLIM.net Company Profile |
SEC
News |
Chart |
Request a new note
C
A N
S L
I M
|
TARO
-
NYSE
Taro Pharmaceutical Inds
DRUGS - Drug Manufacturers - Other
|
$154.76
|
-4.10
-2.58% |
$158.55
|
173,317
194.74% of 50 DAV
50 DAV is 89,000
|
$165.30
-6.38%
|
7/30/2014
|
$144.24
|
PP = $149.99
|
|
MB = $157.49
|
 Most Recent Note - 9/29/2014 12:34:28 PM
G - Found support last week while consolidating above its 50 DMA line. Repeatedly noted with caution - "Recently reported earnings for the Jun '14 quarter below the +25% minimum earnings guideline (C criteria) raising fundamental concerns."
>>> FEATURED STOCK ARTICLE : Consolidating Above 50-day Moving Average and Prior Highs - 9/23/2014
View all notes |
Set NEW NOTE alert |
CANSLIM.net Company Profile |
SEC
News |
Chart |
Request a new note
C
A N
S L
I M
|
TRN
-
NYSE
Trinity Industries Inc
TRANSPORTATION - Railroads
|
$47.31
|
-0.55
-1.15% |
$47.51
|
1,769,565
66.03% of 50 DAV
50 DAV is 2,680,000
|
$50.77
-6.82%
|
4/30/2014
|
$37.79
|
PP = $38.03
|
|
MB = $39.93
|
Most Recent Note - 9/22/2014 5:44:01 PM
G - Pulled back today with above average volume following 4 consecutive volume-driven gains. It has not formed a sound base. Prior highs near $46-47 define near-term support above its 50 DMA line.
>>> FEATURED STOCK ARTICLE : Consolidating Above 50-Day Moving Average Line - 9/12/2014
View all notes |
Set NEW NOTE alert |
CANSLIM.net Company Profile |
SEC
News |
Chart |
Request a new note
C
A N
S L
I M
|
UA
-
NYSE
Under Armour Inc Cl A
CONSUMER NON-DURABLES - Textile - Apparel Clothing
|
$70.12
|
+0.30
0.43% |
$70.29
|
1,964,872
78.22% of 50 DAV
50 DAV is 2,512,000
|
$73.42
-4.49%
|
7/10/2014
|
$58.50
|
PP = $60.79
|
|
MB = $63.83
|
Most Recent Note - 9/26/2014 12:35:07 PM
G - Consolidating above its 50 DMA line within striking distance of its 52-week high. Prior notes cautioned members - "Fundamental concerns were raised by earnings reported +0% on +34% sales revenues for the Jun '14 quarter, below the +25% minimum earnings guideline (C criteria)."
>>> FEATURED STOCK ARTICLE : Higher Volume Behind Loss Testing 50-Day Moving Average - 9/15/2014
View all notes |
Set NEW NOTE alert |
CANSLIM.net Company Profile |
SEC
News |
Chart |
Request a new note
C
A N
S L
I M
|
Symbol/Exchange
Company Name
Industry Group |
PRICE |
CHANGE
(%Change) |
Day High |
Volume
(% DAV)
(% 50 day avg vol) |
52 Wk Hi
% From Hi |
Featured
Date |
Price
Featured |
Pivot Featured |
|
Max Buy |
WLK
-
NYSE
Westlake Chemical Corp
CHEMICALS - Specialty Chemicals
|
$90.24
|
-1.01
-1.11% |
$90.98
|
717,257
137.41% of 50 DAV
50 DAV is 522,000
|
$98.44
-8.33%
|
4/29/2014
|
$72.79
|
PP = $69.31
|
|
MB = $72.78
|
Most Recent Note - 9/23/2014 5:16:07 PM
G - Churned higher volume today while slumping and testing prior highs in the $92 area and its 50 DMA line ($91.50). More damaging losses would raise greater concerns and trigger technical sell signals. Recent fundamental concerns were noted.
>>> FEATURED STOCK ARTICLE : Consolidating Above Near-Term Support Levels - 9/11/2014
View all notes |
Set NEW NOTE alert |
CANSLIM.net Company Profile |
SEC
News |
Chart |
Request a new note
C
A N
S L
I M
|
|
|
|
THESE ARE NOT BUY RECOMMENDATIONS!
Comments contained in the body of this report are technical
opinions only. The material herein has been obtained
from sources believed to be reliable and accurate, however,
its accuracy and completeness cannot be guaranteed.
This site is not an investment advisor, hence it does
not endorse or recommend any securities or other investments.
Any recommendation contained in this report may not
be suitable for all investors and it is not to be deemed
an offer or solicitation on our part with respect to
the purchase or sale of any securities. All trademarks,
service marks and trade names appearing in this report
are the property of their respective owners, and are
likewise used for identification purposes only.
This report is a service available
only to active Paid Premium Members.
You may opt-out of receiving report notifications
at any time. Questions or comments may be submitted
by writing to Premium Membership Services 665 S.E. 10 Street, Suite 201 Deerfield Beach, FL 33441-5634 or by calling 1-800-965-8307
or 954-785-1121.
|
|
|

