You are not logged in.
This means you
CAN ONLY VIEW reports that were published prior to Monday, April 21, 2025.
You
MUST UPGRADE YOUR MEMBERSHIP if you want to see any current reports.
AFTER MARKET UPDATE - THURSDAY, SEPTEMBER 25TH, 2014
Previous After Market Report Next After Market Report >>>
|
|
|
|
DOW |
-264.26 |
16,945.80 |
-1.54% |
|
Volume |
719,733,470 |
-1% |
|
Volume |
1,791,943,850 |
+10% |
|
NASDAQ |
-88.47 |
4,466.75 |
-1.94% |
|
Advancers |
527 |
17% |
|
Advancers |
522 |
18% |
|
S&P 500 |
-32.31 |
1,965.99 |
-1.62% |
|
Decliners |
2,568 |
81% |
|
Decliners |
2,305 |
80% |
|
Russell 2000 |
-18.07 |
1,110.24 |
-1.60% |
|
52 Wk Highs |
17 |
|
|
52 Wk Highs |
25 |
|
|
S&P 600 |
-9.40 |
639.53 |
-1.45% |
|
52 Wk Lows |
193 |
|
|
52 Wk Lows |
166 |
|
|
 |
Indices' Technical Deterioration Hurts Market Outlook
Kenneth J. Gruneisen - Passed the CAN SLIM® Master's Exam
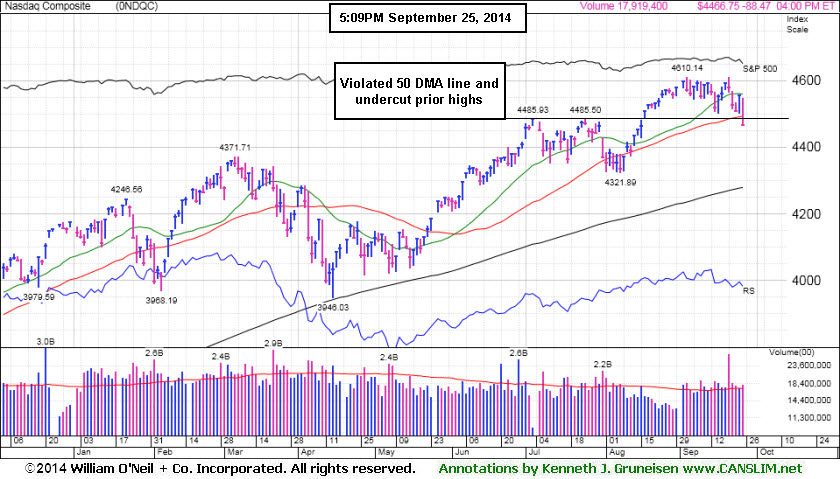
With Thursday's considerable losses the S&P 500 Index and Nasdaq Composite Index both violated their respective 50-day moving average (DMA) lines. Volume totals were reported mixed, lighter than the prior session total on the NYSE, but higher on the Nasdaq exchange, a sign of increased selling or "distribution" from large institutional investors. Breadth was clearly negative as decliners led advancers by nearly a 5-1 margin on the NYSE and more than 4-1 on the NASDAQ exchange. There were 9 high-ranked companies from the CANSLIM.net Leaders List that made new 52-week highs and appeared on the CANSLIM.net BreakOuts Page, up from the prior session total of 7 stocks. The new 52-week lows list expanded and solidly outnumbered new highs on the NYSE and on the Nasdaq exchange. Also, there were losses for all 11 high-ranked companies currently included on the Featured Stocks Page. Prior commentaries noted distributional action while leadership (stocks hitting new 52-week highs) waned. Broader market (M criteria) weakness and technical deterioration has now arguably earned the label of a "correction" raising a caution flag for investors. The fact-based investment system prompts disciplined investors to reduce market exposure by selling any faltering stocks during rough periods.
PICTURED: The Nasdaq Composite Index was 88 points lower at 4,466 as the tech-heavy index slumped below prior highs and violated its 50-day moving average (DMA) line with a damaging loss on higher volume.
Stocks finished the session lower for the fourth time in five days. The Dow Jones Industrial Average finished 12 points above its 50-day moving average (DMA) line as it fell 264 points to 16,945. The S&P 500 lost 32 points to 1,965.
The major averages finished the session firmly in negative territory, amid ongoing geopolitical events. The U.S. and Arab allies stepped up airstrikes aimed at key militant targets, which included oilfields, in Syria. Russian lawmakers also began drafting legislation to allow the government to seize foreign assets in response to sanctions.
Looking at economic data, a measure of durable goods orders fell 18.2% in August, following an 18% increase in July. The number of unemployed initially claiming benefits increased 13,000, which was less than the projected 16,000 increase. While a gauge of service sector sentiment fell more than expected, it was still in expansionary territory.
At the close all 10 sectors in the S&P 500 were lower. Tech and financials led the decline. JP Morgan Chase & Co (JPM -2.4%) sank. Apple (AAPL -3.8%) fell after reports surfaced about operating platform glitches and a defective phone case. The utility sector limited losses, as Duke Energy (DUK +0.3%) bucked the trend with a small gain.
Treasuries were higher, following an auction of $29 billion in seven-year notes. The benchmark 10-year note climbed 17/32 to yield 2.51%.
The CANSLIM.net Featured Stocks Page shows the most action-worthy candidates and their latest notes and a Headline Link directs members to the latest detailed analysis with data-packed graphs annotated by a Certified expert along with links to additional resources. The Premium Member Homepage includes "dynamic archives" to all prior pay reports published.00
|
 Kenneth J. Gruneisen started out as a licensed stockbroker in August 1987, a couple of months prior to the historic stock market crash that took the Dow Jones Industrial Average down -22.6% in a single day. He has published daily fact-based fundamental and technical analysis on high-ranked stocks online for two decades. Through FACTBASEDINVESTING.COM, Kenneth provides educational articles, news, market commentary, and other information regarding proven investment systems that work in good times and bad.
Comments contained in the body of this report are technical opinions only and are not necessarily those of Gruneisen Growth Corp. The material herein has been obtained from sources believed to be reliable and accurate, however, its accuracy and completeness cannot be guaranteed. Our firm, employees, and customers may effect transactions, including transactions contrary to any recommendation herein, or have positions in the securities mentioned herein or options with respect thereto. Any recommendation contained in this report may not be suitable for all investors and it is not to be deemed an offer or solicitation on our part with respect to the purchase or sale of any securities. |
|
 |
Financial, Tech, Retail, and Energy-Linked Groups Fell
Kenneth J. Gruneisen - Passed the CAN SLIM® Master's Exam
Weakness in influential financial shares created a drag on the major averages as the Broker/Dealer Index ($XBD -1.50%) and the Bank Index ($BKX -1.58%) slumped. The Retail Index ($RLX -1.48%) fell and there were unanimous losses in the tech sector as the Biotechnology Index ($BTK -1.92%), Networking Index ($NWX -1.91%), and the Semiconductor Index ($SOX -1.87%) each fell. Energy-related shares also faced pressure as the Oil Services Index ($OSX -1.74%) Integrated Oil Index ($XOI -1.59%) were both lower, meanwhile the Gold & Silver Index ($XAU -0.04%) finished flat.
Charts courtesy www.stockcharts.com
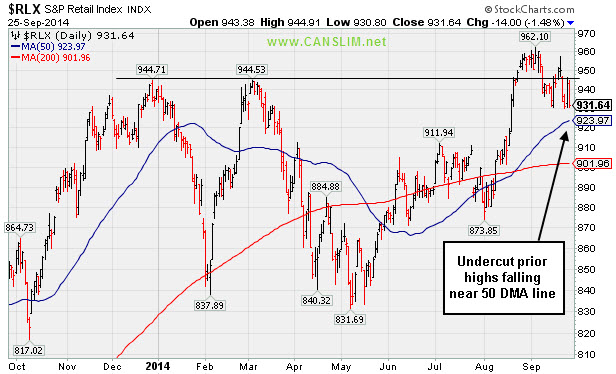
PICTURED: The Retail Index ($RLX -1.48%) undercut prior highs while falling near its 50-day moving average (DMA) line.
| Oil Services |
$OSX |
267.74 |
-4.73 |
-1.74% |
-4.73% |
| Integrated Oil |
$XOI |
1,566.33 |
-25.30 |
-1.59% |
+4.20% |
| Semiconductor |
$SOX |
635.42 |
-12.11 |
-1.87% |
+18.76% |
| Networking |
$NWX |
323.83 |
-6.32 |
-1.91% |
-0.03% |
| Broker/Dealer |
$XBD |
169.73 |
-2.58 |
-1.50% |
+5.71% |
| Retail |
$RLX |
931.64 |
-14.00 |
-1.48% |
-0.87% |
| Gold & Silver |
$XAU |
84.95 |
-0.03 |
-0.04% |
+0.95% |
| Bank |
$BKX |
71.61 |
-1.15 |
-1.58% |
+3.39% |
| Biotech |
$BTK |
3,100.04 |
-60.58 |
-1.92% |
+33.02% |
|
|
|
 |
Fell Toward 50-day Moving Average; Recent Gains Lacked Great Volume
Kenneth J. Gruneisen - Passed the CAN SLIM® Master's Exam
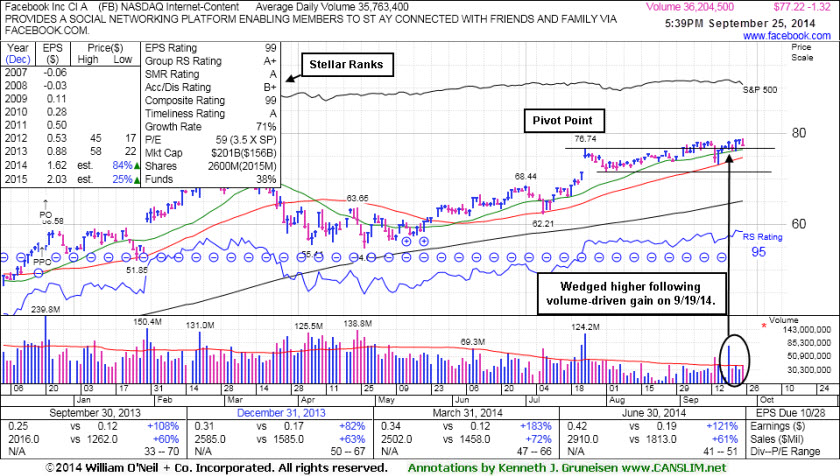
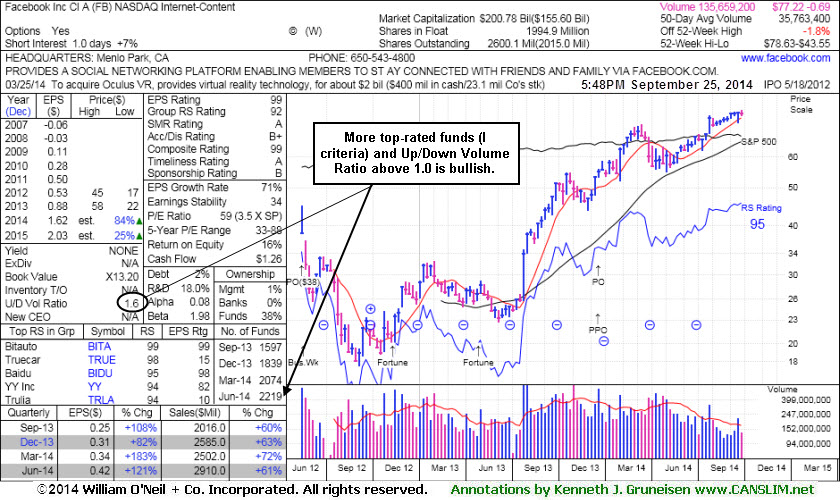
Facebook Inc (FB -$1.32 or -1.67% to $77.22) fell with higher (near average) volume today. It recently wedged higher with gains lacking great volume conviction since the big volume-driven gain on 9/19/14 helped confirm a new (or add-on) technical buy signal. Its 50-day moving average (DMA) line ($74.60) defines important near-term support to watch on pullbacks where a violation would trigger a technical sell signal. It was last shown in this FSU section on 9/09/14 with annotated graphs under the headline, "Wedging Gains Not Indicative of Institutional Conviction". Disciplined investors always limit losses by selling any stock that falls more than -7% from their purchase price.
It reported earnings +121% on +61% sales revenues for the Jun '14 quarter, its 5th consecutive quarterly comparison with earnings increasing well above the +25% minimum (C criteria). Its current Up/Down Volume Ratio of 1.6 is an unbiased bullish indication its shares have been under accumulation over the past 50 days. The high-ranked Internet - Content group leader has seen the number of top-rated funds owning its shares rise from 1,116 in Dec '12 to 2,219 in Jun '14, a reassuring sign concerning the I criteria. However, members were previously warned - "Keep in mind that its large supply of 2.54 billion shares in the public float makes it an unlikely sprinter, especially as it is already well known by the institutional crowd and the general public."
|
|
|
Color Codes Explained :
Y - Better candidates highlighted by our
staff of experts.
G - Previously featured
in past reports as yellow but may no longer be buyable under the
guidelines.
***Last / Change / Volume data in this table is the closing quote data***
Symbol/Exchange
Company Name
Industry Group |
PRICE |
CHANGE
(%Change) |
Day High |
Volume
(% DAV)
(% 50 day avg vol) |
52 Wk Hi
% From Hi |
Featured
Date |
Price
Featured |
Pivot Featured |
|
Max Buy |
ACT
-
NYSE
Actavis plc
Medical-Generic Drugs
|
$244.53
|
-3.47
-1.40% |
$249.94
|
1,728,811
76.16% of 50 DAV
50 DAV is 2,270,000
|
$248.81
-1.72%
|
6/20/2014
|
$216.53
|
PP = $230.87
|
|
MB = $242.41
|
Most Recent Note - 9/24/2014 5:28:51 PM
G - Finished at a best-ever close well above its "max buy" level and its color code is changed to green. Prior highs near $230 define near-term support to watch on pullbacks.
>>> FEATURED STOCK ARTICLE : Finally Volume-backed Gains Confirmed a Technical Buy Signal - 9/19/2014
View all notes |
Set NEW NOTE alert |
CANSLIM.net Company Profile |
SEC
News |
Chart |
Request a new note
C
A N
S L
I M


|
BITA
-
NYSE
Bitauto Hldgs Ltd Ads
Internet-Content
|
$75.56
|
-2.97
-3.78% |
$78.93
|
813,953
47.21% of 50 DAV
50 DAV is 1,724,000
|
$98.28
-23.12%
|
6/26/2014
|
$46.20
|
PP = $47.03
|
|
MB = $49.38
|
 Most Recent Note - 9/25/2014 6:07:02 PM
G - Fell near its 50 DMA line ($74.16) with lighter volume behind today's loss. A violation would raise concerns and trigger a technical sell signal. Noted repeatedly with caution - "Has the look of a 'climax run' with volume-driven gains getting very extended from its prior base."
>>> FEATURED STOCK ARTICLE : Volume Totals Recently Cooling After Halting Slide - 9/18/2014
View all notes |
Set NEW NOTE alert |
CANSLIM.net Company Profile |
SEC
News |
Chart |
Request a new note
C
A N
S L
I M
|
FB
-
NASDAQ
Facebook Inc Cl A
INTERNET
|
$77.22
|
-1.32
-1.67% |
$78.94
|
37,390,129
104.55% of 50 DAV
50 DAV is 35,763,000
|
$78.63
-1.79%
|
9/9/2014
|
$76.67
|
PP = $76.84
|
|
MB = $80.68
|
Most Recent Note - 9/25/2014 6:09:18 PM
Y - Reversed into the red for a loss on near average volume after touching a new high. Its 50 DMA line ($74.60) defines important near term support. See the latest FSU analysis for more details and new annotated graphs.
>>> FEATURED STOCK ARTICLE : Fell Toward 50-day Moving Average; Recent Gains Lacked Great Volume - 9/25/2014
View all notes |
Set NEW NOTE alert |
CANSLIM.net Company Profile |
SEC
News |
Chart |
Request a new note
C
A N
S L
I M
|
NVGS
-
NYSE
Navigator Holdings Ltd
Transportation-Ship
|
$28.86
|
-0.48
-1.64% |
$29.64
|
581,837
233.67% of 50 DAV
50 DAV is 249,000
|
$31.90
-9.53%
|
9/16/2014
|
$30.33
|
PP = $30.56
|
|
MB = $32.09
|
Most Recent Note - 9/25/2014 12:55:52 PM
G - Up from the session's earlier lows after violating its 50 DMA line with a damaging volume-driven loss triggering a technical sell signal. Color code was changed to green. Only a prompt rebound above the 50 DMA line would help its outlook improve. Disciplined investors do not chase stocks more than +5% above their pivot point, and they always limit losses by selling if any stock falls more than -7% from their purchase price.
>>> FEATURED STOCK ARTICLE : Finished Strong While Challenging Pivot Point and Recent Highs - 9/16/2014
View all notes |
Set NEW NOTE alert |
CANSLIM.net Company Profile |
SEC
News |
Chart |
Request a new note
C
A N
S L
I M
|
NXPI
-
NASDAQ
Nxp Semiconductors N V
ELECTRONICS - Semiconductor - Broad Line
|
$69.81
|
-2.40
-3.32% |
$72.19
|
2,977,925
87.05% of 50 DAV
50 DAV is 3,421,000
|
$73.82
-5.43%
|
8/29/2014
|
$68.50
|
PP = $67.89
|
|
MB = $71.28
|
Most Recent Note - 9/25/2014 6:13:35 PM
Y- Color code is changed to yellow after dipping below its "max buy" level. Weakening market conditions (M criteria) are prompting investors to reduce exposure in any faltering stocks and avoid new buying efforts until strength returns. Prior highs in the $67 area define initial support to watch on pullbacks.
>>> FEATURED STOCK ARTICLE : Consolidating Above Pivot Point and Below "Max Buy" Level - 9/17/2014
View all notes |
Set NEW NOTE alert |
CANSLIM.net Company Profile |
SEC
News |
Chart |
Request a new note
C
A N
S L
I M
|
Symbol/Exchange
Company Name
Industry Group |
PRICE |
CHANGE
(%Change) |
Day High |
Volume
(% DAV)
(% 50 day avg vol) |
52 Wk Hi
% From Hi |
Featured
Date |
Price
Featured |
Pivot Featured |
|
Max Buy |
PANW
-
NYSE
Palo Alto Networks
Computer Sftwr-Security
|
$96.30
|
-2.84
-2.86% |
$99.35
|
1,206,713
72.04% of 50 DAV
50 DAV is 1,675,000
|
$102.45
-6.00%
|
7/30/2014
|
$84.21
|
PP = $85.88
|
|
MB = $90.17
|
Most Recent Note - 9/24/2014 5:31:05 PM
G - Holding its ground near all-time highs with volume totals cooling. Prior highs in the $87 area define initial support to watch above its 50 DMA line ($86.74). Disciplined investors avoid chasing extended stocks. See the latest FSU analysis for more details and new annotated graphs.
>>> FEATURED STOCK ARTICLE : Holding Ground Near Highs After Big Volume-Driven Gains - 9/24/2014
View all notes |
Set NEW NOTE alert |
CANSLIM.net Company Profile |
SEC
News |
Chart |
Request a new note
C
A N
S L
I M
|
STRT
-
NASDAQ
Strattec Security Corp
AUTOMOTIVE - Auto Parts
|
$81.18
|
-0.59
-0.72% |
$82.94
|
12,926
56.20% of 50 DAV
50 DAV is 23,000
|
$89.87
-9.67%
|
9/19/2014
|
$86.06
|
PP = $89.97
|
|
MB = $94.47
|
Most Recent Note - 9/23/2014 12:30:32 PM
Y - Rebounded from today's early lows. Formed an advanced "3-weeks tight" base while holding its ground stubbornly. Subsequent volume-driven gains above the new pivot point cited may trigger a new (or add-on) technical buy signal. Prior highs in the $74-77 area define initial support to watch on pullbacks.
>>> FEATURED STOCK ARTICLE : Extended From Prior Highs and Previously Noted Base - 9/10/2014
View all notes |
Set NEW NOTE alert |
CANSLIM.net Company Profile |
SEC
News |
Chart |
Request a new note
C
A N
S L
I M
|
TARO
-
NYSE
Taro Pharmaceutical Inds
DRUGS - Drug Manufacturers - Other
|
$152.72
|
-5.12
-3.24% |
$158.15
|
57,665
65.53% of 50 DAV
50 DAV is 88,000
|
$165.30
-7.61%
|
7/30/2014
|
$144.24
|
PP = $149.99
|
|
MB = $157.49
|
Most Recent Note - 9/23/2014 5:11:40 PM
G - Consolidating above its 50 DMA line and -6% off its 52-week high. Enduring recent distributional pressure. See the latest FSU analysis for more details and new annotated graphs. Repeatedly noted with caution - "Recently reported earnings for the Jun '14 quarter below the +25% minimum earnings guideline (C criteria) raising fundamental concerns."
>>> FEATURED STOCK ARTICLE : Consolidating Above 50-day Moving Average and Prior Highs - 9/23/2014
View all notes |
Set NEW NOTE alert |
CANSLIM.net Company Profile |
SEC
News |
Chart |
Request a new note
C
A N
S L
I M
|
TRN
-
NYSE
Trinity Industries Inc
TRANSPORTATION - Railroads
|
$47.93
|
-0.21
-0.44% |
$48.27
|
3,369,619
128.61% of 50 DAV
50 DAV is 2,620,000
|
$50.77
-5.60%
|
4/30/2014
|
$37.79
|
PP = $38.03
|
|
MB = $39.93
|
Most Recent Note - 9/22/2014 5:44:01 PM
G - Pulled back today with above average volume following 4 consecutive volume-driven gains. It has not formed a sound base. Prior highs near $46-47 define near-term support above its 50 DMA line.
>>> FEATURED STOCK ARTICLE : Consolidating Above 50-Day Moving Average Line - 9/12/2014
View all notes |
Set NEW NOTE alert |
CANSLIM.net Company Profile |
SEC
News |
Chart |
Request a new note
C
A N
S L
I M
|
UA
-
NYSE
Under Armour Inc Cl A
CONSUMER NON-DURABLES - Textile - Apparel Clothing
|
$67.55
|
-1.13
-1.65% |
$68.88
|
3,015,726
123.65% of 50 DAV
50 DAV is 2,439,000
|
$73.42
-8.00%
|
7/10/2014
|
$58.50
|
PP = $60.79
|
|
MB = $63.83
|
Most Recent Note - 9/24/2014 5:32:59 PM
G - Rebounded above its 50 DMA line helping its outlook improve with today's 2nd consecutive gain on lighter volume. Prior notes cautioned members - "Fundamental concerns were raised by earnings reported +0% on +34% sales revenues for the Jun '14 quarter, below the +25% minimum earnings guideline (C criteria)."
>>> FEATURED STOCK ARTICLE : Higher Volume Behind Loss Testing 50-Day Moving Average - 9/15/2014
View all notes |
Set NEW NOTE alert |
CANSLIM.net Company Profile |
SEC
News |
Chart |
Request a new note
C
A N
S L
I M
|
Symbol/Exchange
Company Name
Industry Group |
PRICE |
CHANGE
(%Change) |
Day High |
Volume
(% DAV)
(% 50 day avg vol) |
52 Wk Hi
% From Hi |
Featured
Date |
Price
Featured |
Pivot Featured |
|
Max Buy |
WLK
-
NYSE
Westlake Chemical Corp
CHEMICALS - Specialty Chemicals
|
$90.13
|
-2.00
-2.17% |
$92.27
|
713,132
139.56% of 50 DAV
50 DAV is 511,000
|
$98.44
-8.44%
|
4/29/2014
|
$72.79
|
PP = $69.31
|
|
MB = $72.78
|
Most Recent Note - 9/23/2014 5:16:07 PM
G - Churned higher volume today while slumping and testing prior highs in the $92 area and its 50 DMA line ($91.50). More damaging losses would raise greater concerns and trigger technical sell signals. Recent fundamental concerns were noted.
>>> FEATURED STOCK ARTICLE : Consolidating Above Near-Term Support Levels - 9/11/2014
View all notes |
Set NEW NOTE alert |
CANSLIM.net Company Profile |
SEC
News |
Chart |
Request a new note
C
A N
S L
I M
|
|
|
|
THESE ARE NOT BUY RECOMMENDATIONS!
Comments contained in the body of this report are technical
opinions only. The material herein has been obtained
from sources believed to be reliable and accurate, however,
its accuracy and completeness cannot be guaranteed.
This site is not an investment advisor, hence it does
not endorse or recommend any securities or other investments.
Any recommendation contained in this report may not
be suitable for all investors and it is not to be deemed
an offer or solicitation on our part with respect to
the purchase or sale of any securities. All trademarks,
service marks and trade names appearing in this report
are the property of their respective owners, and are
likewise used for identification purposes only.
This report is a service available
only to active Paid Premium Members.
You may opt-out of receiving report notifications
at any time. Questions or comments may be submitted
by writing to Premium Membership Services 665 S.E. 10 Street, Suite 201 Deerfield Beach, FL 33441-5634 or by calling 1-800-965-8307
or 954-785-1121.
|
|
|