You are not logged in.
This means you
CAN ONLY VIEW reports that were published prior to Monday, February 26, 2024.
You
MUST UPGRADE YOUR MEMBERSHIP if you want to see any current reports.
AFTER MARKET UPDATE - TUESDAY, SEPTEMBER 24TH, 2019
Previous After Market Report Next After Market Report >>>
|
|
|
|
DOW |
-142.22 |
26,807.77 |
-0.53% |
|
Volume |
952,219,230 |
+16% |
|
Volume |
2,291,985,160 |
+32% |
|
NASDAQ |
-118.83 |
7,993.63 |
-1.46% |
|
Advancers |
864 |
31% |
|
Advancers |
675 |
22% |
|
S&P 500 |
-25.18 |
2,966.60 |
-0.84% |
|
Decliners |
1,920 |
69% |
|
Decliners |
2,415 |
78% |
|
Russell 2000 |
-24.66 |
1,533.59 |
-1.58% |
|
52 Wk Highs |
112 |
|
|
52 Wk Highs |
62 |
|
|
S&P 600 |
-12.38 |
950.06 |
-1.29% |
|
52 Wk Lows |
28 |
|
|
52 Wk Lows |
102 |
|
|
 |
Major Indices Fell With Heavier Volume Indicating Distribution
Kenneth J. Gruneisen - Passed the CAN SLIM® Master's Exam
The Dow dropped 142 points, while the S&P 500 fell 0.8%, to post its worst day in a month. The Nasdaq Composite shed 1.5%. The volume totals reported were higher than the prior session on the NYSE and on the Nasdaq exchange, indicative of distributional pressure. Decliners led advancers by almost a 4-1 margin on the Nasdaq exchange and by more than a 2-1 margin on the NYSE. Leadership remained thin as there were 21 high-ranked companies from the Leaders List hit new 52-week highs and were listed on the BreakOuts Page, versus the total of 17 on the prior session. New 52-week highs totals outnumbered new 52-week lows totals on the NYSE, but new lows outnumbered new high on the Nasdaq exchange. The uptrend for the major indices (M criteria) has come under pressure while leadership has recently been waning. Disciplined investors know to make new buying efforts only in stocks fitting all of the key criteria of the fact-based investment system. The Featured Stocks Page provides the most timely analysis on high-ranked leaders. Charts used courtesy of www.stockcharts.com
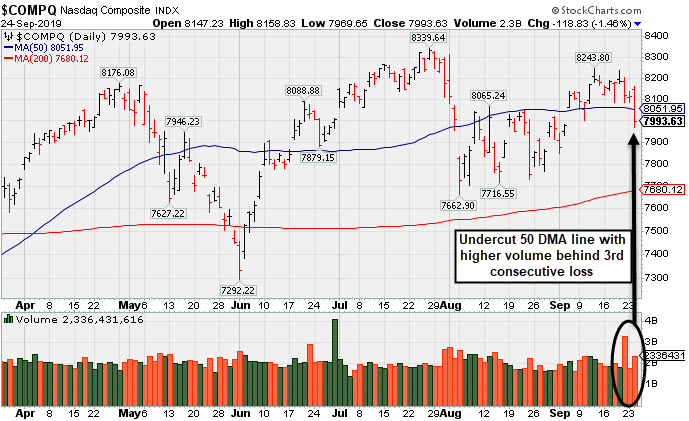
PICTURED: The Nasdaq Composite Index undercut its 50-day moving average (DMA) line with higher volume behind its 3rd consecutive loss.
Stocks finished lower in volatile trading Tuesday. Investor sentiment was upbeat early in the session after U.S. Treasury Secretary Steven Mnuchin confirmed plans of high level trade talks in two weeks. Reports that China had granted waivers to several companies for tariff-free U.S. soybean purchases also had helped boost the mood. Trade optimism faded, however, following a United Nations speech from President Trump in which he was critical of China. Political uncertainty also provided a headwind after reports surfaced that House Speaker Nancy Pelosi planned to announce a formal impeachment inquiry of the president.
On the data front, a report from the Conference Board showed consumer confidence declined by the most in nine months in September. Additionally, an update from the Richmond Fed showed manufacturing activity in the region eased this month. Separately, S&P CoreLogic Case Shiller’s 20-City Index revealed home prices rose 2% year-over-year in July, the slowest clip since August 2012. Treasuries caught a bid, with the yield on the 10-year note dropping seven basis points to 1.64%. In commodities, WTI crude lost 2.8% to $57.01/barrel.
The often cited “FAANG” cohort was pressured after comments from President Trump concerning the “growing power” of social media platforms, which caused concern surrounding heightened regulatory scrutiny. Netflix (NFLX -4.26%) is now in negative territory for the year amid increased concerns surrounding competition.
|
 Kenneth J. Gruneisen started out as a licensed stockbroker in August 1987, a couple of months prior to the historic stock market crash that took the Dow Jones Industrial Average down -22.6% in a single day. He has published daily fact-based fundamental and technical analysis on high-ranked stocks online for two decades. Through FACTBASEDINVESTING.COM, Kenneth provides educational articles, news, market commentary, and other information regarding proven investment systems that work in good times and bad.
Comments contained in the body of this report are technical opinions only and are not necessarily those of Gruneisen Growth Corp. The material herein has been obtained from sources believed to be reliable and accurate, however, its accuracy and completeness cannot be guaranteed. Our firm, employees, and customers may effect transactions, including transactions contrary to any recommendation herein, or have positions in the securities mentioned herein or options with respect thereto. Any recommendation contained in this report may not be suitable for all investors and it is not to be deemed an offer or solicitation on our part with respect to the purchase or sale of any securities. |
|
 |
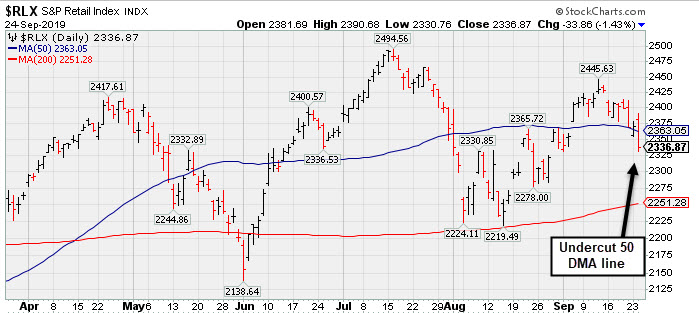
Gold & Silver Index Rose Amid Widespread Group Weakness
Kenneth J. Gruneisen - Passed the CAN SLIM® Master's Exam
The Bank Index ($BKX -1.28%), Broker/Dealer Index ($XBD -2.03%), and the Retail Index ($RLX -1.43%) ended unanimously lower. The tech sector also had a negative bias as the Semiconductor Index ($SOX -1.65%), Networking Index ($NWX -1.41%), and the Biotech Index ($BTK -2.39%) finished the session with losses. Commodity-linked groups were mixed as the Oil Services Index ($OSX -5.12%) was a standout decliner and the Integrated Oil Index ($XOI -1.57%) fell, meanwhile, the Gold & Silver Index ($XAU +1.04%) was a standout gainer on the widely negative session.
PICTURED: The Retail Index ($RLX -1.43%) undercut its 50-day moving average (DMA) line again.
| Oil Services |
$OSX |
68.77 |
-3.72 |
-5.13% |
-14.68% |
| Integrated Oil |
$XOI |
1,227.63 |
-19.57 |
-1.57% |
+5.91% |
| Semiconductor |
$SOX |
1,551.99 |
-26.10 |
-1.65% |
+34.35% |
| Networking |
$NWX |
554.18 |
-7.90 |
-1.41% |
+13.41% |
| Broker/Dealer |
$XBD |
268.03 |
-5.54 |
-2.03% |
+12.93% |
| Retail |
$RLX |
2,336.87 |
-33.86 |
-1.43% |
+19.75% |
| Gold & Silver |
$XAU |
97.68 |
+1.00 |
+1.03% |
+38.24% |
| Bank |
$BKX |
99.27 |
-1.29 |
-1.28% |
+15.71% |
| Biotech |
$BTK |
4,347.60 |
-106.37 |
-2.39% |
+3.00% |
|
|
|
 |
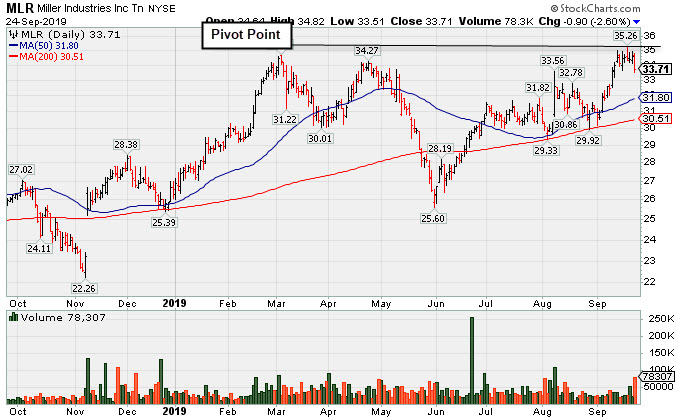
Encountered Distributional Pressure After Challenging Prior High
Kenneth J. Gruneisen - Passed the CAN SLIM® Master's Exam
Miller Industries Inc (MLR -$0.90 or -2.60% to $33.71) finished with a loss on higher volume today, indicative of distributional pressure, after highlighted in yellow with new pivot point cited based on its 3/05/19 high plus 10 cents (read here). It was noted - ":Subsequent gains above the pivot point backed by at least +40% above average volume may trigger a technical buy signal. Very little resistance remains due to overhead supply."
June '19 quarterly earnings rose +40% on +26% sales revenues versus the year ago period, and 3 of the past 4 comparisons were above the +25% minimum earnings guideline (C criteria). Annual earnings history (A criteria) has also been good. Very small supply of only 11.4 million shares outstanding (S criteria) can contribute to greater price volatility in the event of institutional buying or selling.
MLR was dropped from the Featured Stocks list on 5/22/19 and went through a choppy consolidation below its 200-day moving average then rebounded since last shown in this FSU section on 4/08/19 with an annotated graph under the headline, "Below 50-Day Average After Damaging Losses".
The number of top-rated funds owning its shares rose from 196 in Mar '18 to 247 in Jun '19, a reassuring sign concerning the I criteria. The current Up/Down Volume Ratio of 1.4 is an unbiased indication its shares have been under accumulation over the past 50 days. It has earned an B Timeliness rating and a D Sponsorship Rating.
Charts courtesy of www.stockcharts.com
|
|
|
Color Codes Explained :
Y - Better candidates highlighted by our
staff of experts.
G - Previously featured
in past reports as yellow but may no longer be buyable under the
guidelines.
***Last / Change / Volume data in this table is the closing quote data***
Symbol/Exchange
Company Name
Industry Group |
PRICE |
CHANGE
(%Change) |
Day High |
Volume
(% DAV)
(% 50 day avg vol) |
52 Wk Hi
% From Hi |
Featured
Date |
Price
Featured |
Pivot Featured |
|
Max Buy |
 MLR
-
NYSE
MLR
-
NYSE
Miller Industries Inc
AUTOMOTIVE - Auto Parts
|
$33.71
|
-0.90
-2.60% |
$34.82
|
78,307
230.31% of 50 DAV
50 DAV is 34,000
|
$35.26
-4.40%
|
9/24/2019
|
$34.00
|
PP = $35.36
|
|
MB = $37.13
|
 Most Recent Note - 9/24/2019 7:50:52 PM
Y - Suffered a loss with above average volume and finished near the session low. Highlighted in yellow with new pivot point cited based on its 3/05/19 high plus 10 cents in the earlier mid-day report while noted - "Subsequent gains above the pivot point backed by at least +40% above average volume may trigger a technical buy signal. Very little resistance remains due to overhead supply. Reported June '19 quarterly earnings +40% on +26% sales revenues versus the year ago period, and 3 of the past 4 comparisons were above the +25% minimum earnings guideline (C criteria)." See the latest FSU analysis for more details and a new annotated graph.
>>> FEATURED STOCK ARTICLE : Encountered Distributional Pressure After Challenging Prior High - 9/24/2019 |
View all notes |
Set NEW NOTE alert |
Company Profile |
SEC
News |
Chart |
Request a new note
C
A
S
I |
CCBG
-
NASDAQ
Capital City Bk Gp
BANKING - Regional - Mid-Atlantic Banks
|
$26.86
|
-0.03
-0.11% |
$27.00
|
93,837
390.99% of 50 DAV
50 DAV is 24,000
|
$28.00
-4.07%
|
9/13/2019
|
$27.03
|
PP = $27.05
|
|
MB = $28.40
|
Most Recent Note - 9/24/2019 1:09:44 PM
Y - Consolidating after hitting a new 52-week high on 9/20/19 with a solid gain above the pivot point backed by +339% above average volume triggering a technical buy signal. Prior highs define initial support to watch above its 50 DMA line ($25.17).
>>> FEATURED STOCK ARTICLE : Thinly Traded Bank Rallied To Multi-Year Highs - 9/13/2019 |
View all notes |
Set NEW NOTE alert |
Company Profile |
SEC
News |
Chart |
Request a new note
C
A
S
I |
EPAM
-
NYSE
Epam Systems Inc
COMPUTER SOFTWARE and SERVICES - Information Technology Service
|
$181.78
|
-2.98
-1.61% |
$187.90
|
185,816
51.47% of 50 DAV
50 DAV is 361,000
|
$201.00
-9.56%
|
5/9/2019
|
$169.25
|
PP = $180.55
|
|
MB = $189.58
|
Most Recent Note - 9/23/2019 5:42:06 PM
G - A rebound above its 50 DMA line ($189.64) is still needed for its outlook to improve. Prior lows in the $174-175 area define the next important support level. Reported earnings +27% on +24% sales revenues for the Jun '19 quarter.
>>> FEATURED STOCK ARTICLE : Recent Slump Below 50-Day Average Hurt Outlook - 9/16/2019 |
View all notes |
Set NEW NOTE alert |
Company Profile |
SEC
News |
Chart |
Request a new note
C
A
S
I |
AUDC
-
NASDAQ
Audiocodes Ltd
ELECTRONICS - Scientific and Technical Instrum
|
$21.00
|
-0.69
-3.18% |
$22.50
|
476,451
220.58% of 50 DAV
50 DAV is 216,000
|
$22.06
-4.81%
|
9/13/2019
|
$19.68
|
PP = $19.84
|
|
MB = $20.83
|
Most Recent Note - 9/24/2019 1:06:40 PM
G - Reversed into the red after early gains today for another new all-time high. Stubbornly held its ground after 6 consecutive gains marked by volume. Its 50 DMA line ($18.19) defines important support.
>>> FEATURED STOCK ARTICLE : Recent Spurt of Gains for New Highs Marked By Volume - 9/17/2019 |
View all notes |
Set NEW NOTE alert |
Company Profile |
SEC
News |
Chart |
Request a new note
C
A
S
I |
LHCG
-
NASDAQ
L H C Group Inc
HEALTH SERVICES - Home Health Care
|
$116.14
|
-2.98
-2.50% |
$119.52
|
199,689
92.88% of 50 DAV
50 DAV is 215,000
|
$129.37
-10.23%
|
7/1/2019
|
$110.94
|
PP = $122.20
|
|
MB = $128.31
|
Most Recent Note - 9/23/2019 5:35:37 PM
G - A rebound above its 50 DMA line ($120.74) is needed to help its outlook, however it has recently acted as resistance. The recent low ($115.06 9/10/19) defines near-term support above its 200 DMA line ($111.94).
>>> FEATURED STOCK ARTICLE : 50-Day Moving Average Recently Acted as Resistance - 9/12/2019 |
View all notes |
Set NEW NOTE alert |
Company Profile |
SEC
News |
Chart |
Request a new note
C
A
S
I |
Symbol/Exchange
Company Name
Industry Group |
PRICE |
CHANGE
(%Change) |
Day High |
Volume
(% DAV)
(% 50 day avg vol) |
52 Wk Hi
% From Hi |
Featured
Date |
Price
Featured |
Pivot Featured |
|
Max Buy |
CHDN
-
NASDAQ
Churchill Downs Inc
LEISURE - Gaming Activities
|
$121.86
|
-1.42
-1.15% |
$124.80
|
178,382
78.93% of 50 DAV
50 DAV is 226,000
|
$132.73
-8.19%
|
7/22/2019
|
$118.45
|
PP = $118.89
|
|
MB = $124.83
|
Most Recent Note - 9/23/2019 5:38:57 PM
Y - Consolidating above its 50 DMA line ($121). Prior lows define the next important support to watch. Jun '19 earnings +10% on +26% sales revenues versus the year ago period were below the +25% minimum earnings guideline (C criteria), noted recently raising fundamental concerns. See the latest FSU analysis for more details and an annotated graph.
>>> FEATURED STOCK ARTICLE : Consolidating Above 50-Day Moving Average Line - 9/20/2019 |
View all notes |
Set NEW NOTE alert |
Company Profile |
SEC
News |
Chart |
Request a new note
C
A
S
I |
LULU
-
NASDAQ
Lululemon Athletica
MANUFACTURING - Textile Manufacturing
|
$193.85
|
-1.33
-0.68% |
$196.79
|
2,009,289
114.75% of 50 DAV
50 DAV is 1,751,000
|
$204.44
-5.18%
|
9/6/2019
|
$201.25
|
PP = $194.35
|
|
MB = $204.07
|
Most Recent Note - 9/23/2019 12:27:27 PM
Y - Rebounding today after a loss with above average volume on the prior session undercut the prior high ($194.25). Its 50 DMA line ($186.83) defines important near-term support to watch.
>>> FEATURED STOCK ARTICLE : Consolidating Near Prior High Following Latest Breakout - 9/18/2019 |
View all notes |
Set NEW NOTE alert |
Company Profile |
SEC
News |
Chart |
Request a new note
C
A
S
I |
CPRT
-
NASDAQ
Copart Inc
SPECIALTY RETAIL - Auto Dealerships
|
$81.69
|
-0.11
-0.13% |
$82.37
|
2,026,879
153.20% of 50 DAV
50 DAV is 1,323,000
|
$83.70
-2.40%
|
9/5/2019
|
$79.13
|
PP = $79.84
|
|
MB = $83.83
|
Most Recent Note - 9/23/2019 5:40:08 PM
Y - Remains perched near its all-time high. Held its ground stubbornly after the big volume-driven gain above the pivot point on 9/05/19 clinched a technical buy signal. Fundamentals are strong. See the latest FSU analysis for more details and an annotated graph.
>>> FEATURED STOCK ARTICLE : Hovering Near All-Time High Following Recent Breakout - 9/19/2019 |
View all notes |
Set NEW NOTE alert |
Company Profile |
SEC
News |
Chart |
Request a new note
C
A
S
I |
BLD
-
NYSE
Topbuild Corp
Bldg-Constr Prds/Misc
|
$95.96
|
+0.72
0.76% |
$97.55
|
264,764
91.93% of 50 DAV
50 DAV is 288,000
|
$96.63
-0.69%
|
5/17/2019
|
$82.19
|
PP = $87.31
|
|
MB = $91.68
|
Most Recent Note - 9/23/2019 5:34:17 PM
G - Perched near its all-time high, extended from the prior base. Earnings rose +39% on +9% sales revenues for the Jun '19 quarter versus the year ago period. Its 50 DMA line ($88.71) defines important support to watch along with its prior low ($86.53 on 8/28/19). See the latest FSU analysis for more details and a new annotated graph.
>>> FEATURED STOCK ARTICLE : Perched Near Record High, Extended From Prior Base - 9/23/2019 |
View all notes |
Set NEW NOTE alert |
Company Profile |
SEC
News |
Chart |
Request a new note
C
A
S
I |
PAGS
-
NYSE
Pagseguro Digital Cl A
Finance-CrdtCard/PmtPr
|
$45.38
|
-0.78
-1.69% |
$47.36
|
984,061
47.96% of 50 DAV
50 DAV is 2,052,000
|
$53.43
-15.07%
|
6/25/2019
|
$37.69
|
PP = $40.07
|
|
MB = $42.07
|
Most Recent Note - 9/23/2019 5:37:48 PM
G - Quietly slumped back below its 50 DMA line ($47.40) again raising concerns. Prior lows in the $42-43 area define the next important chart support level to watch. Fundamentals are strong.
>>> FEATURED STOCK ARTICLE : 50-Day Moving Average Violation Triggered Technical Sell Signal - 9/11/2019 |
View all notes |
Set NEW NOTE alert |
Company Profile |
SEC
News |
Chart |
Request a new note
C
A
S
I |
Symbol/Exchange
Company Name
Industry Group |
PRICE |
CHANGE
(%Change) |
Day High |
Volume
(% DAV)
(% 50 day avg vol) |
52 Wk Hi
% From Hi |
Featured
Date |
Price
Featured |
Pivot Featured |
|
Max Buy |
|
|
|
THESE ARE NOT BUY RECOMMENDATIONS!
Comments contained in the body of this report are technical
opinions only. The material herein has been obtained
from sources believed to be reliable and accurate, however,
its accuracy and completeness cannot be guaranteed.
This site is not an investment advisor, hence it does
not endorse or recommend any securities or other investments.
Any recommendation contained in this report may not
be suitable for all investors and it is not to be deemed
an offer or solicitation on our part with respect to
the purchase or sale of any securities. All trademarks,
service marks and trade names appearing in this report
are the property of their respective owners, and are
likewise used for identification purposes only.
This report is a service available
only to active Paid Premium Members.
You may opt-out of receiving report notifications
at any time. Questions or comments may be submitted
by writing to Premium Membership Services 665 S.E. 10 Street, Suite 201 Deerfield Beach, FL 33441-5634 or by calling 1-800-965-8307
or 954-785-1121.
|
|
|