You are not logged in.
This means you
CAN ONLY VIEW reports that were published prior to Monday, April 14, 2025.
You
MUST UPGRADE YOUR MEMBERSHIP if you want to see any current reports.
AFTER MARKET UPDATE - WEDNESDAY, SEPTEMBER 16TH, 2009
Previous After Market Report Next After Market Report >>>
|
|
|
|
DOW |
+108.30 |
9,791.71 |
+1.12% |
|
Volume |
1,581,513,400 |
+6% |
|
Volume |
2,791,880,760 |
+16% |
|
NASDAQ |
+30.51 |
2,133.15 |
+1.45% |
|
Advancers |
2,542 |
81% |
|
Advancers |
1,927 |
67% |
|
S&P 500 |
+16.13 |
1,068.76 |
+1.53% |
|
Decliners |
515 |
16% |
|
Decliners |
802 |
28% |
|
Russell 2000 |
+12.54 |
617.38 |
+2.07% |
|
52 Wk Highs |
348 |
|
|
52 Wk Highs |
130 |
|
|
S&P 600 |
+6.40 |
323.65 |
+2.02% |
|
52 Wk Lows |
2 |
|
|
52 Wk Lows |
3 |
|
|
 |
Positive Breadth and Volume Behind Gains Indicates Accumulation By Institutional Crowd
Adam Sarhan, Contributing Writer,
The major averages extended a global advance as the US dollar continued falling and commodities gained amid speculation the economy has returned to growth. Gold climbed to near a record as the dollar slid to its lowest versus the euro in almost a year. Volume totals on the exchanges were reported higher than Tuesday's session, which showed that institutional investors were aggressively accumulating stocks. Advancers trumped decliners by over a 4-to-1 ratio on the NYSE and by over a 2-to-1 ratio on the Nasdaq exchange. There were 41 high-ranked companies from the CANSLIM.net Leaders List that made a new 52-week high and appeared on the CANSLIM.net BreakOuts Page, nicely higher than the 28 issues that appeared on the prior session. New 52-week highs were in the triple digits on both exchanges, while new 52-week lows were in the single digits yet again.
Both stocks and commodities extended their week-long gains as the US dollar continued to fall. The US dollar hit a fresh 1-year low against the euro which sent dollar denominated assets higher. The CRB Commodity Index, a basket of widely followed commodities, rallied nearly +2% today and is up +4.7% so far this week. Gold continues to soar after taking out resistance last week. The yellow metal advanced +1.4% today and closed at $1020.20 per ounce, which marks a new all time high record close. Meanwhile, silver prices hit a new one year high by hitting $17.43 per ounce.
The Federal Reserve said industrial production rose at a stronger than expected rate which was the latest batch of stronger than expected economic data. The Bloomberg Professional Global Confidence Index, a survey that measures global confidence, rose to +58.54 in September which is higher than the boom/bust reading of 50 and higher than last month's reading of 58.12. Confidence in the world economy held steady in September after reports suggested the recession may be finally over.
In the past we have written about the bottom that is being traced out in the housing market. Housing stocks soared today after the National Association of Home Builders/Wells Fargo confidence index rose to 19 which was the highest reading since May 2008. However, a reading below 50 means most respondents view conditions as negative but the fact that it is increasing is a healthy sign. The recent surge in homebuilders helped the Bldg-residential/commercial industry group to rise to 16 in the paper. Housing stocks still lack the fundamentals needed to meet the criteria of this powerful investment system but are beginning to strengthen.
PICTURED: The benchmark S&P 500 Index broke above resistance and has not looked back. Volume patterns are healthy, picking up to above average levels behind the gains following Labor Day.
|
|
|
 |
Financial Group Further Spearheads Major Averages' Rise
Kenneth J. Gruneisen - Passed the CAN SLIM® Master's Exam
Big gains from financial shares helped to spearhead solid gains for the major averages on Wednesday as the Bank Index ($BKX +4.03%) and Broker/Dealer Index ($XBD +2.04%) posted solid gains. The Retail Index ($RLX +2.33%) also was among the session's positive influences, however the strength was broad-based. Energy-related shares were big gainers and the Integrated Oil Index ($XOI +2.17%) and Oil Services Index ($OSX +3.08%) posted solid gains. Tech shares were unanimously higher as the Internet Index ($IIX +2.02%), Networking Index ($NWX +2.21%), Semiconductor Index ($SOX +0.42%), and Biotechnology Index ($BTK +0.82%) rose. The Gold & Silver Index ($XAU +1.81%) and Healthcare Index ($HMO +2.23%) joined in the collective advance with solid gains, rounding out a particularly bullish session overall.
Charts courtesy www.stockcharts.com
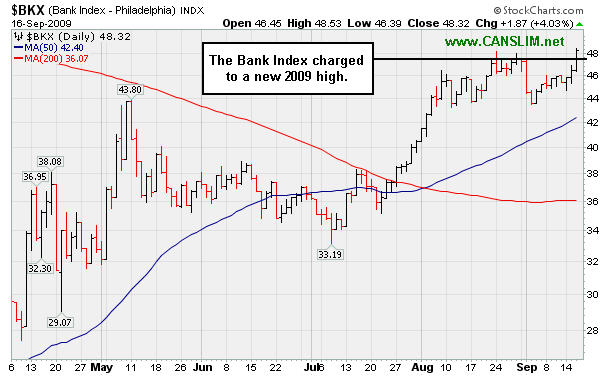
PICTURED: The Bank Index ($BKX +4.03%) charged to a new 52-week high. As long-time readers of this commentary should well know by now, the financial group led the market down-turn, and financials also led the market's upturn. It has a long-standing history of working that way! That is why it was given much attention in 2007 and 2008 as the financial indexes broke down and suffered huge losses. Each day we include the XBD and BKX because the financial group is a leading indicator. When the financial indexes get weak, it is difficult to impossible for the broader market to enjoy an ongoing rally without eventually faltering. In this case, financial stocks are getting strong, and it bodes well for the broader market outlook going forward.
| Oil Services |
$OSX |
196.16 |
+5.86 |
+3.08% |
+61.59% |
| Healthcare |
$HMO |
1,282.22 |
+27.95 |
+2.23% |
+33.54% |
| Integrated Oil |
$XOI |
1,052.78 |
+22.38 |
+2.17% |
+7.46% |
| Semiconductor |
$SOX |
326.84 |
+1.36 |
+0.42% |
+54.05% |
| Networking |
$NWX |
236.15 |
+5.11 |
+2.21% |
+64.12% |
| Internet |
$IIX |
218.64 |
+4.32 |
+2.02% |
+63.44% |
| Broker/Dealer |
$XBD |
118.84 |
+2.38 |
+2.04% |
+53.40% |
| Retail |
$RLX |
382.32 |
+8.69 |
+2.33% |
+36.90% |
| Gold & Silver |
$XAU |
174.17 |
+3.09 |
+1.81% |
+40.63% |
| Bank |
$BKX |
48.32 |
+1.87 |
+4.03% |
+9.03% |
| Biotech |
$BTK |
952.56 |
+7.75 |
+0.82% |
+47.19% |
|
|
|
 |
Negative Reversal, Yet Still Above Max Buy Level
Kenneth J. Gruneisen - Passed the CAN SLIM® Master's Exam
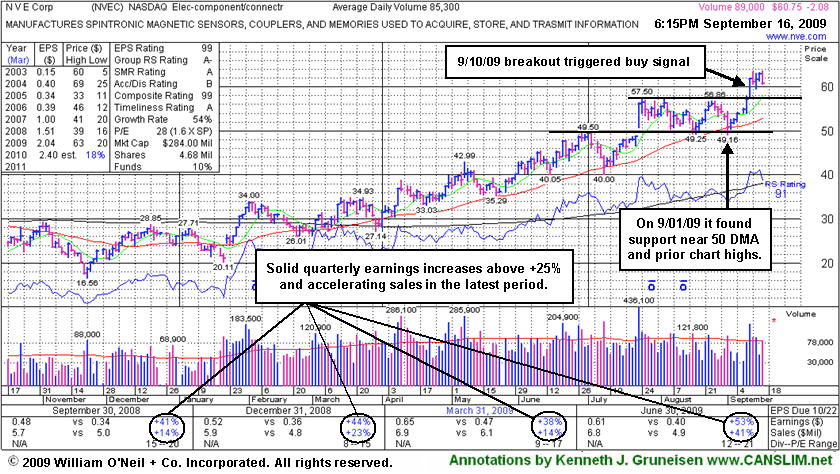
NVE Corp's (NVEC -$2.08 or -3.31% to $60.75) touched a new 52-week high today and then negatively reversed for a loss on average volume. It quickly got extended from its latest sound base, and it remains above its "max buy" level after having cleared its latest pivot point. It has a very small supply of only 4.68 million shares outstanding (the S criteria) which can contribute to greater than usual volatility. Be mindful of its still rather minuscule sales revenues. These concerns heighten the need for great discipline in trading (buying AND selling). It has shown bullish action since its last appearance in this FSU section on 9/01/09 which included an annotated graphs and analysis under the headline "Critical Chart Support Levels Tested Again While Market Weakens." The broader market's (the M criteria) improved strength was most certainly was a factor, as 3 out of 4 stocks typically move in sync with the major averages.
Prior chart highs are important support to watch now, and any deterioration leading to a close back into its prior base would negate the stock's latest bullish technical breakout raising concerns. Throughout its ongoing advance, NVEC has found support near its 50-day moving average (DMA) line (the red line). NVEC was first featured in yellow at $33.85 in the Friday, March 13, 2009 Mid-Day Breakouts Report (read here). This high-ranked Electronics - Components industry group leader has a good quarterly and annual earnings growth history (C & A criteria) and even showed acceleration in the latest report for the quarter ended June 30, 2009. In that period sales revenues were up +41% and earnings were up +53%, even bigger percentage increases than prior solid (+25% or better) earnings comparisons. That is what we call earnings growth acceleration, and it is a very encouraging characteristic commonly seen in the market's biggest winners.
|
|
|
Color Codes Explained :
Y - Better candidates highlighted by our
staff of experts.
G - Previously featured
in past reports as yellow but may no longer be buyable under the
guidelines.
***Last / Change / Volume quote data in this table corresponds with the timestamp on the note***
Symbol/Exchange
Company Name
Industry Group |
Last |
Chg. |
Vol
% DAV |
Date Featured |
Price Featured |
Latest Pivot Point
Featured |
Status |
| Latest Max Buy Price |
ARO
- NYSE
Aeropostale Inc
RETAIL - Apparel Stores
|
$43.26
|
+0.57
|
2,016,082
68% DAV
2,972,200
|
8/21/2009
(Date
Featured) |
$39.21
(Price
Featured) |
PP = $38.84 |
G |
| MB = $40.78 |
Most Recent Note - 9/16/2009 5:47:30 PM
G - This high-ranked leader in the Retail - Clothing/shoe group inched to a new all-time high today with light volume behind its 3rd consecutive gain. It is extended from a sound base and not buyable under the investment system guidelines now. Nobody is rushing to the exits thus far, yet support to watch is at prior highs in the $38 area. It was featured in yellow in the 8/21/09 Mid-Day BreakOuts Report (read here).
>>> The latest Featured Stock Update with an annotated graph appeared on 9/2/2009. click here.
|
|
C
A
S
I |
News |
Chart |
SEC
View all notes Alert
me of new notes
Company
Profile
|
ARST
-
|
$22.21
|
+0.24
|
655,663
90% DAV
732,200
|
9/1/2009
(Date
Featured) |
$19.91
(Price
Featured) |
PP = $20.90 |
G |
| MB = $21.95 |
Most Recent Note - 9/16/2009 5:50:02 PM
G - Small gain today on light volume, above its max buy level. It has stubbornly held its gains. Prior chart highs in the $20 area are important support to watch on pullbacks.
>>> The latest Featured Stock Update with an annotated graph appeared on 9/4/2009. click here.
|
|
C
A
S
I |
News |
Chart |
SEC
View all notes Alert
me of new notes
Company
Profile
|
BIDU
- NASDAQ
Baidu Inc Ads
INTERNET - Internet Information Providers
|
$402.91
|
+5.38
|
2,670,720
151% DAV
1,768,400
|
9/8/2009
(Date
Featured) |
$351.80
(Price
Featured) |
PP = $368.59 |
G |
| MB = $387.02 |
Most Recent Note - 9/16/2009 5:58:44 PM
G - Edged higher today with above average volume. Considerable gain on 9/15/09 with more than 2 times average volume helped it rise beyond its "max buy" level and its color code was changed to green. It has quickly gotten extended from a sound base. BIDU was featured in yellow in the 9/08/09 Mid-Day BreakOuts Report (read here).
>>> The latest Featured Stock Update with an annotated graph appeared on 9/8/2009. click here.
|
|
C
A
S
I |
News |
Chart |
SEC
View all notes Alert
me of new notes
Company
Profile
|
CRM
- NYSE
Salesforce.com Inc
INTERNET - Internet Software & Services
|
$57.35
|
+0.62
|
2,101,723
108% DAV
1,945,600
|
8/16/2009
(Date
Featured) |
$47.12
(Price
Featured) |
PP = $45.59 |
G |
| MB = $47.87 |
Most Recent Note - 9/16/2009 6:00:21 PM
G - Prior highs near $55 are an intial support level to watch on pullbacks. Extended from a sound base. It recently rose from a "3-weeks tight" type pattern following its "breakaway gap" on 8/21/09 with more than 5 times average volume. Detailed analysis and an annotated graph were included when recently featured in the 8/16/09 Stock Bulletin (read here).
>>> The latest Featured Stock Update with an annotated graph appeared on 9/15/2009. click here.
|
|
C
A
S
I |
News |
Chart |
SEC
View all notes Alert
me of new notes
Company
Profile
|
EBIX
- NASDAQ
Ebix Inc
COMPUTER SOFTWARE & SERVICES - Business Software & Services
|
$49.60
|
-0.31
|
216,278
203% DAV
106,600
|
8/28/2009
(Date
Featured) |
$45.86
(Price
Featured) |
PP = $45.35 |
G |
| MB = $47.62 |
Most Recent Note - 9/16/2009 6:01:15 PM
G - Today was its 4th straight loss, and it is too extended from an ideal buy point within the investment system guidelines. Last week included another whipsaw-like shakeout that briefly tested support, like in mid-August. It has a small supply of only 6.62 million shares in the float. EBIX rallied as much as +19.76% since featured in yellow in the 8/28/09 Mid-Day BreakOuts Report (read here).
>>> The latest Featured Stock Update with an annotated graph appeared on 9/11/2009. click here.
|
|
C
A
S
I |
News |
Chart |
SEC
View all notes Alert
me of new notes
Company
Profile
|
GMCR
- NASDAQ
Green Mtn Coffee Roastrs
FOOD & BEVERAGE - Processed & Packaged Goods
|
$67.78
|
+2.91
|
1,186,296
79% DAV
1,495,100
|
7/17/2009
(Date
Featured) |
$60.15
(Price
Featured) |
PP = $63.79 |
G |
| MB = $66.98 |
Most Recent Note - 9/16/2009 6:04:00 PM
G - Rallying toward prior chart highs with lighter than average volume after recently rising back above its 50 DMA line. It has not formed a new sound base since it completed an additional share offering on 8/07/09. Some overhead supply up to $72 may act as resistance. GMCR traded up more than +168% since appearing with an annotated graph under the headline "It May Soon Be Time To Go Green" when featured in the January 2009 CANSLIM.net News (read here).
>>> The latest Featured Stock Update with an annotated graph appeared on 9/10/2009. click here.
|
|
C
A
S
I |
News |
Chart |
SEC
View all notes Alert
me of new notes
Company
Profile
|
NTES
- NASDAQ
Netease Inc Adr
INTERNET - Internet Information Providers
|
$44.36
|
+2.21
|
3,676,875
172% DAV
2,138,700
|
7/17/2009
(Date
Featured) |
$39.29
(Price
Featured) |
PP = $38.74 |
G |
| MB = $40.68 |
Most Recent Note - 9/16/2009 6:05:55 PM
G - Gapped up today for a solid gain on higher volume, rallying from support at its 50 DMA line. The next support is as prior chart highs in the $38 area. Deterioration below those levels would raise more serious concerns and trigger additional sell signals.
>>> The latest Featured Stock Update with an annotated graph appeared on 9/14/2009. click here.
|
|
C
A
S
I |
News |
Chart |
SEC
View all notes Alert
me of new notes
Company
Profile
|
NVEC
- NASDAQ
N V E Corp
ELECTRONICS - Semiconductor - Specialized
|
$60.75
|
-2.08
|
90,061
108% DAV
83,100
|
8/26/2009
(Date
Featured) |
$55.32
(Price
Featured) |
PP = $57.60 |
G |
| MB = $60.48 |
Most Recent Note - 9/16/2009 6:08:40 PM
G - Today it touched a new 52-week high and then negatively reversed for a loss on average volume, falling back toward its "max buy" level. This high-ranked leader from the Electronics industry group quickly got extended from its latest sound base. Keep in mind its small supply (the S criteria) of shares outstanding which can contribute to greater than usual volatility. Be mindful of its still rather minuscule sales revenues. These concerns heighten the need for great discipline in trading (buying AND selling).
>>> The latest Featured Stock Update with an annotated graph appeared on 9/16/2009. click here.
|
|
C
A
S
I |
News |
Chart |
SEC
View all notes Alert
me of new notes
Company
Profile
|
PEGA
- NASDAQ
Pegasystems Inc
COMPUTER SOFTWARE & SERVICES - Business Software & Services
|
$33.78
|
+1.29
|
576,712
156% DAV
368,700
|
9/9/2009
(Date
Featured) |
$31.14
(Price
Featured) |
PP = $33.35 |
Y |
| MB = $35.02 |
Most Recent Note - 9/16/2009 6:13:42 PM
Y - This high-ranked Computer Software - Financial firm hit a new 52-week high and today's gain backed by more than +50% above average volume lifted it above its pivot point triggering a technical buy signal.
>>> The latest Featured Stock Update with an annotated graph appeared on 9/9/2009. click here.
|
|
C
A
S
I |
News |
Chart |
SEC
View all notes Alert
me of new notes
Company
Profile
|
|
|
|
THESE ARE NOT BUY RECOMMENDATIONS!
Comments contained in the body of this report are technical
opinions only. The material herein has been obtained
from sources believed to be reliable and accurate, however,
its accuracy and completeness cannot be guaranteed.
This site is not an investment advisor, hence it does
not endorse or recommend any securities or other investments.
Any recommendation contained in this report may not
be suitable for all investors and it is not to be deemed
an offer or solicitation on our part with respect to
the purchase or sale of any securities. All trademarks,
service marks and trade names appearing in this report
are the property of their respective owners, and are
likewise used for identification purposes only.
This report is a service available
only to active Paid Premium Members.
You may opt-out of receiving report notifications
at any time. Questions or comments may be submitted
by writing to Premium Membership Services 665 S.E. 10 Street, Suite 201 Deerfield Beach, FL 33441-5634 or by calling 1-800-965-8307
or 954-785-1121.
|
|
|


