Critical Chart Support Levels Tested Again While Market Weakens
Tuesday, September 01, 2009 CANSLIM.net

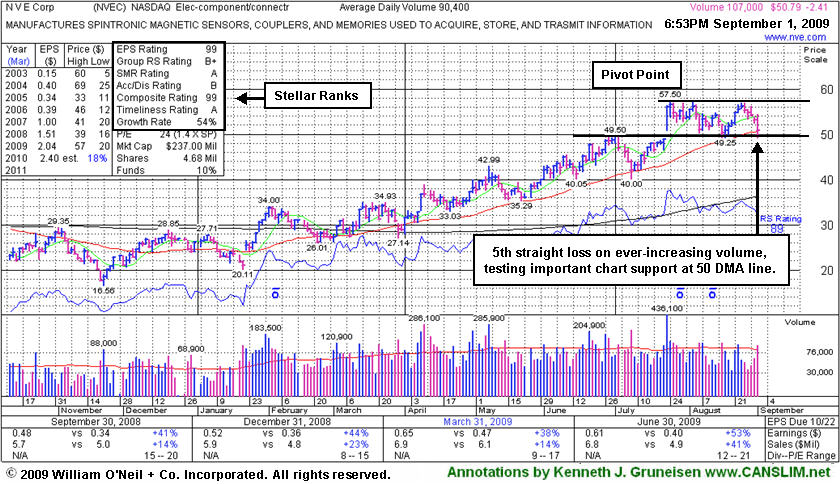
NVE Corp's (NVEC -$2.41 or -4.53% to $50.79) loss today on higher volume was its 5th consecutive decline. It is again trading near important support at its 50-day moving average (DMA) line and prior chart highs. Its color code was changed to green this week based on its weak action and failure to produce gains above its latest pivot point. In fact, today's intra-day low briefly undercut its 8/18/09 low which coincides with its last appearance in this FSU section under the headline, "Consolidation Near Important Support Levels" (read here). Throughout its ongoing advance, NVEC has found support near its 50 DMA line. Caution is warranted now, as eventually a more substantial correction is bound to come, and broader market conditions (the M criteria) appear to be weakening.
NVEC traded up as much as +69.87% since it was first featured in yellow at $33.85 in the Friday, March 13, 2009 Mid-Day Breakouts Report (read here). This high-ranked Electronics - Components leader has a good quarterly and annual earnings growth history (C & A criteria). However, it has failed to make additional progress since it was featured in the 7/23/09 Mid-Day BreakOuts Report (read here) after it gapped up for a considerable gain on heavy volume following news of stronger sales revenues (+41%) and solid earnings increases for the quarter ended June 30, 2009. The technical action was described as a "breakaway gap" from a valid ascending base. It has a very small supply of only 4.68 million shares outstanding. This is another good reason to be especially disciplined about proper entries and exits. A small supply is generally considered a good sign with respect to the S criteria, yet could contribute to great volatility in the event of institutional accumulation or distribution.
