You are not logged in.
This means you
CAN ONLY VIEW reports that were published prior to Tuesday, April 15, 2025.
You
MUST UPGRADE YOUR MEMBERSHIP if you want to see any current reports.
AFTER MARKET UPDATE - THURSDAY, SEPTEMBER 17TH, 2009
Previous After Market Report Next After Market Report >>>
|
|
|
|
DOW |
-7.79 |
9,783.92 |
-0.08% |
|
Volume |
1,519,346,700 |
-4% |
|
Volume |
2,648,622,540 |
-5% |
|
NASDAQ |
-6.40 |
2,126.75 |
-0.30% |
|
Advancers |
1,340 |
43% |
|
Advancers |
1,361 |
48% |
|
S&P 500 |
-3.27 |
1,065.49 |
-0.31% |
|
Decliners |
1,701 |
54% |
|
Decliners |
1,372 |
48% |
|
Russell 2000 |
-1.91 |
615.47 |
-0.31% |
|
52 Wk Highs |
296 |
|
|
52 Wk Highs |
135 |
|
|
S&P 600 |
-0.66 |
322.99 |
-0.20% |
|
52 Wk Lows |
3 |
|
|
52 Wk Lows |
2 |
|
|
 |
Major Averages Reversed After Early Gains
Adam Sarhan, Contributing Writer,
After a slew of economic data was released the major averages erased early gains and closed lower, termed a "negative reversal" by market technicians. Volume on the exchanges remained at above average levels, but Thursday's totals were reported lower than Wednesday's totals, which showed that institutional investors were not aggressively dumping stocks. Decliners led advancers by over a 17-to-13 ratio on the NYSE while the mix was even on the Nasdaq exchange. There were 40 high-ranked companies from the CANSLIM.net Leaders List that made a new 52-week high and appeared on the CANSLIM.net BreakOuts Page, down a notch from 41 issues that appeared on the prior session. New 52-week highs were in the triple digits on both exchanges, while new 52-week lows were in the single digits yet again.
The Commerce Department said that housing starts rose +1.5% last month to an annual rate of 598,000, led by construction of multi-family homes. This was the highest reading in nine months which bodes well for the possible "recovery" for housing prices. Elsewhere, the Federal Reserve Bank of Philadelphia said its general economic index rose to 14.1 in September from 4.2 in August. Both reports coupled with an unexpected decline in jobless claims, support Fed Chairman Ben S. Bernanke’s theory that the recession has likely ended. A separate report from the Fed showed that US household wealth rose by $2 trillion in the second quarter which effectively ended the largest slump in history. Net worth for households and non-profit groups rose to $53.1 from $51.1 trillion in the first quarter, reflecting the largest quarterly jump in stock prices since 1998 and the first increase in home prices in more than two years. This was the first gain in household wealth since the third quarter of 2007.
The market is very strong, evidenced by the very steep rally over the past 10 days. Keep in mind that as every day passes, the chances of a pullback increase. Normally, one would like to see the market advance on heavy volume then pull back on lighter volume before resuming its uptrend. The fact that the major averages negatively reversed suggests that a near-term pullback may finally occur.
PICTURED: The Dow Jones Industrial Average negatively reversed on light volume than the prior session.
|
|
|
 |
Negative Reversal Today After Bank Index Hit 2009 High
Kenneth J. Gruneisen - Passed the CAN SLIM® Master's Exam
The Biotechnology Index ($BTK +0.18%) edged higher while most groups ended lower on Thursday. Profit taking pressure weighed on the market. The Gold & Silver Index ($XAU -1.77%), Semiconductor Index ($SOX -1.69%) and Broker/Dealer Index ($XBD -1.35%) pulled back from collective 2009 highs set on the prior session. Other defensive groups also lost ground including the Healthcare Index ($HMO -1.03%) and Oil Services Index ($OSX -1.00%). The Internet Index ($IIX -0.51%) and Networking Index ($NWX -0.44%) ended modestly lower. The Retail Index ($RLX -0.06%) and Integrated Oil Index ($XOI -0.03%) finished the session virtually unchanged.
Charts courtesy www.stockcharts.com
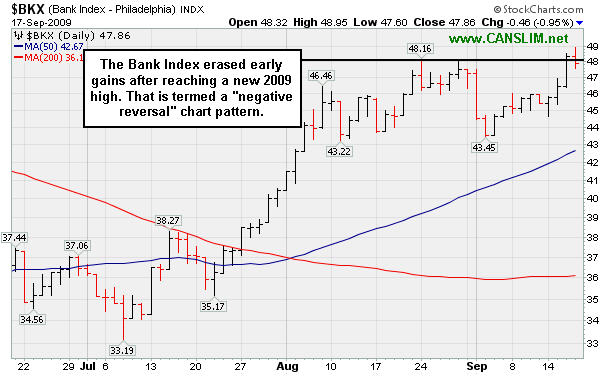
PICTURED: The Bank Index ($BKX -0.95%) erased early gains after reaching a new 2009 high. That is termed a "negative reversal" chart pattern. For the near term it could be a signal that the financial group and broader market may spend more time consolidating after rallying so impressively from this year's lows.
| Oil Services |
$OSX |
194.20 |
-1.96 |
-1.00% |
+59.98% |
| Healthcare |
$HMO |
1,269.04 |
-13.18 |
-1.03% |
+32.17% |
| Integrated Oil |
$XOI |
1,052.50 |
-0.28 |
-0.03% |
+7.43% |
| Semiconductor |
$SOX |
321.33 |
-5.51 |
-1.69% |
+51.45% |
| Networking |
$NWX |
235.12 |
-1.03 |
-0.44% |
+63.40% |
| Internet |
$IIX |
217.53 |
-1.11 |
-0.51% |
+62.61% |
| Broker/Dealer |
$XBD |
117.23 |
-1.61 |
-1.35% |
+51.32% |
| Retail |
$RLX |
382.10 |
-0.22 |
-0.06% |
+36.83% |
| Gold & Silver |
$XAU |
171.09 |
-3.08 |
-1.77% |
+38.14% |
| Bank |
$BKX |
47.86 |
-0.46 |
-0.95% |
+7.99% |
| Biotech |
$BTK |
954.31 |
+1.75 |
+0.18% |
+47.46% |
|
|
|
 |
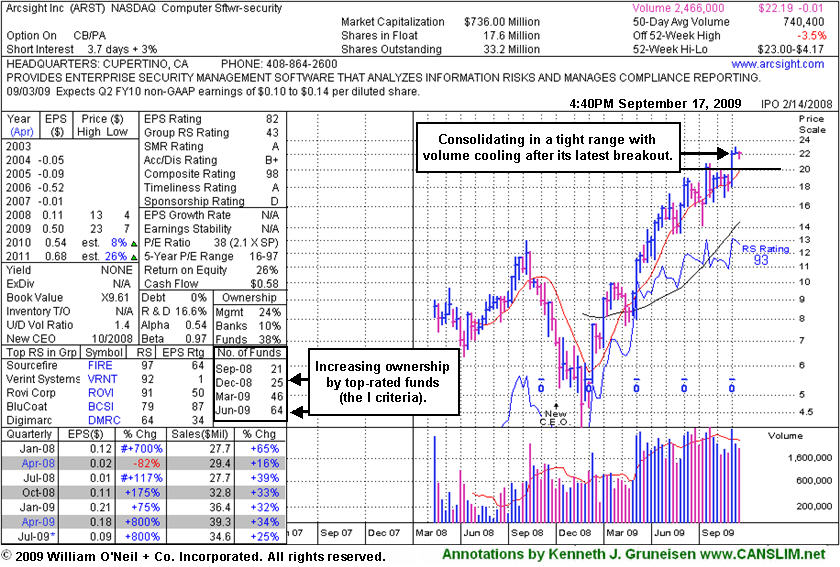
Healthy Post-Breakout Action
Kenneth J. Gruneisen - Passed the CAN SLIM® Master's Exam
A classic example of the success enjoyed by many CANSLIM.net readers usually starts when an investor reads a CANSLIM.net report and buys a featured stock before it has risen above the pivot point by greater than 5%. After a stock breaks out above its pivot point, there is only a +5% window that investors have to purchase the stock under the proper guidelines. Once a stock rises above the "maximum buy price" the risk of a shake out balloons, meaning that even a normal retracement in the stock might force you to employ the 7-8% loss cutting rule. Much can be told by the stock's daily action in the weeks and months that follow a breakout. Typically, a light volume and orderly pullback suggests that the bulls remain in control. However, high volume pullbacks that violate support paint a totally different picture.
ArcSight, Inc. (ARST -$0.02 or -0.09% to $22.19) is hovering in a tight trading range, and with volume totals drying up it has stubbornly held its ground near all-time highs after a consideable 5-fold rally from its November '08 low. The weekly chart below shows it forming what may be considered a "3-weeks tight" pattern by some if it completes this week in close proximity to the 2 prior weekly closes. However a "3-weeks tight" pattern is an advanced type of chart pattern that typically follows a substantial run up percentage-wise of +70-100% or more in the prior 9-16 weeks. ARST has advanced, but it has not run up that considerably in the recent time span. It also has not encountered any distributional pressure since its latest breakout was shown in this FSU section with an annotated daily graph under the headline "Gap Up Gain Follows Quarterly Report For Computer Software Firm" after it gapped up on 9/04/09 and hit a new all-time high with a considerable gain on heavy volume. Volume was nearly 3 times its average daily volume as it blasted above its pivot point, triggering a technical buy signal.
Prior chart highs are now an important support level to watch on pullbacks, and any deterioration back into its prior base would raise concerns. Remember, disciplined investors avoid chasing stocks more than +5% above their pivot point, and always limit losses by selling whenever any stock falls 7-8% from their buy price. ARST was first featured in yellow at $19.91 in the 9/01/09 mid-day report with an annotated daily graph (read here) and it was also featured with more detailed analysis in the September 2009 CANSLIM.net News with an annotated weekly graph (read here).
|
|
|
Color Codes Explained :
Y - Better candidates highlighted by our
staff of experts.
G - Previously featured
in past reports as yellow but may no longer be buyable under the
guidelines.
***Last / Change / Volume quote data in this table corresponds with the timestamp on the note***
Symbol/Exchange
Company Name
Industry Group |
Last |
Chg. |
Vol
% DAV |
Date Featured |
Price Featured |
Latest Pivot Point
Featured |
Status |
| Latest Max Buy Price |
ARO
- NYSE
Aeropostale Inc
RETAIL - Apparel Stores
|
$43.92
|
+0.66
|
2,542,232
86% DAV
2,972,200
|
8/21/2009
(Date
Featured) |
$39.21
(Price
Featured) |
PP = $38.84 |
G |
| MB = $40.78 |
Most Recent Note - 9/17/2009 6:45:04 PM
G - This high-ranked leader in the Retail - Clothing/shoe group inched to a new all-time high today with near average volume behind its 4th consecutive gain. It is extended from a sound base and not buyable under the investment system guidelines now. Nobody is rushing to the exits thus far, yet support to watch is at prior highs in the $38 area. It was featured in yellow in the 8/21/09 Mid-Day BreakOuts Report (read here).
>>> The latest Featured Stock Update with an annotated graph appeared on 9/2/2009. click here.
|
|
C
A
S
I |
News |
Chart |
SEC
View all notes Alert
me of new notes
Company
Profile
|
ARST
-
|
$22.19
|
-0.02
|
361,884
49% DAV
732,200
|
9/1/2009
(Date
Featured) |
$19.91
(Price
Featured) |
PP = $20.90 |
G |
| MB = $21.95 |
Most Recent Note - 9/17/2009 6:11:58 PM
G - Volume has been drying up while it has stubbornly held its recent volume-driven gains. It is hovering above its "max buy" level, and prior chart highs in the $20 area are important support to watch on pullbacks.
>>> The latest Featured Stock Update with an annotated graph appeared on 9/17/2009. click here.
|
|
C
A
S
I |
News |
Chart |
SEC
View all notes Alert
me of new notes
Company
Profile
|
BIDU
- NASDAQ
Baidu Inc Ads
INTERNET - Internet Information Providers
|
$399.19
|
-3.72
|
2,219,006
125% DAV
1,768,400
|
9/8/2009
(Date
Featured) |
$351.80
(Price
Featured) |
PP = $368.59 |
G |
| MB = $387.02 |
Most Recent Note - 9/17/2009 6:13:38 PM
G - Erased early gains and sank into the red today. Considerable gain on 9/15/09 with more than 2 times average volume helped it rise beyond its "max buy" level and its color code was changed to green. It has quickly gotten extended from a sound base. BIDU was featured in yellow in the 9/08/09 Mid-Day BreakOuts Report (read here).
>>> The latest Featured Stock Update with an annotated graph appeared on 9/8/2009. click here.
|
|
C
A
S
I |
News |
Chart |
SEC
View all notes Alert
me of new notes
Company
Profile
|
CRM
- NYSE
Salesforce.com Inc
INTERNET - Internet Software & Services
|
$58.54
|
+1.19
|
2,832,211
146% DAV
1,945,600
|
8/16/2009
(Date
Featured) |
$47.12
(Price
Featured) |
PP = $45.59 |
G |
| MB = $47.87 |
Most Recent Note - 9/17/2009 6:26:06 PM
G - Gain on above average volume today for a new 2009 high close. Prior highs near $55 are an intial support level to watch on pullbacks. Extended from a sound base. It recently rose from a "3-weeks tight" type pattern following its "breakaway gap" on 8/21/09 with more than 5 times average volume. Detailed analysis and an annotated graph were included when recently featured in the 8/16/09 Stock Bulletin (read here).
>>> The latest Featured Stock Update with an annotated graph appeared on 9/15/2009. click here.
|
|
C
A
S
I |
News |
Chart |
SEC
View all notes Alert
me of new notes
Company
Profile
|
EBIX
- NASDAQ
Ebix Inc
COMPUTER SOFTWARE & SERVICES - Business Software & Services
|
$50.50
|
+0.90
|
223,329
210% DAV
106,600
|
8/28/2009
(Date
Featured) |
$45.86
(Price
Featured) |
PP = $45.35 |
G |
| MB = $47.62 |
Most Recent Note - 9/17/2009 6:27:45 PM
G - Today's gain with above average volume halted a 4 session losing streak. It is too extended from an ideal buy point within the investment system guidelines. Last week included another whipsaw-like shakeout that briefly tested support, like in mid-August. It has a small supply of only 6.62 million shares in the float. EBIX rallied as much as +19.76% since featured in yellow in the 8/28/09 Mid-Day BreakOuts Report (read here).
>>> The latest Featured Stock Update with an annotated graph appeared on 9/11/2009. click here.
|
|
C
A
S
I |
News |
Chart |
SEC
View all notes Alert
me of new notes
Company
Profile
|
GMCR
- NASDAQ
Green Mtn Coffee Roastrs
FOOD & BEVERAGE - Processed & Packaged Goods
|
$67.54
|
-0.24
|
1,046,472
70% DAV
1,495,100
|
7/17/2009
(Date
Featured) |
$60.15
(Price
Featured) |
PP = $63.79 |
G |
| MB = $66.98 |
Most Recent Note - 9/17/2009 6:30:28 PM
G - Erased early gains today and ended near the session low with a small loss on lighter than average volume. Recently rising back above its 50 DMA line, it has not formed a new sound base. Completed an additional share offering on 8/07/09, and some overhead supply up to $72 may act as resistance. GMCR traded up more than +168% since appearing with an annotated graph under the headline "It May Soon Be Time To Go Green" when featured in the January 2009 CANSLIM.net News (read here).
>>> The latest Featured Stock Update with an annotated graph appeared on 9/10/2009. click here.
|
|
C
A
S
I |
News |
Chart |
SEC
View all notes Alert
me of new notes
Company
Profile
|
NTES
- NASDAQ
Netease Inc Adr
INTERNET - Internet Information Providers
|
$45.47
|
+1.11
|
1,941,617
91% DAV
2,138,700
|
7/17/2009
(Date
Featured) |
$39.29
(Price
Featured) |
PP = $38.74 |
G |
| MB = $40.68 |
Most Recent Note - 9/17/2009 6:33:46 PM
G - Gain today on average volume for its 4th best close ever, adding to the solid gap up gain on 9/16/09 with higher volume, rallying from support at its 50 DMA line. The next support is as prior chart highs in the $38 area. Deterioration below those levels would raise more serious concerns and trigger additional sell signals.
>>> The latest Featured Stock Update with an annotated graph appeared on 9/14/2009. click here.
|
|
C
A
S
I |
News |
Chart |
SEC
View all notes Alert
me of new notes
Company
Profile
|
NVEC
- NASDAQ
N V E Corp
ELECTRONICS - Semiconductor - Specialized
|
$55.75
|
-5.00
|
318,689
384% DAV
83,100
|
8/26/2009
(Date
Featured) |
$55.32
(Price
Featured) |
PP = $57.60 |
G |
| MB = $60.48 |
Most Recent Note - 9/17/2009 6:38:15 PM
G - Gapped down today and suffered a considerable loss with nearly 4 times average volume, negating its latest breakout and triggering a technical sell signal. Whenever any stock flashes its biggest point loss on its highest down volume it raises great concerns. On the prior session it touched a new 52-week high and then negatively reversed for a loss on average volume. This high-ranked leader from the Electronics industry group quickly got extended from its latest sound base. As previously noted, "Keep in mind its small supply (the S criteria) of shares outstanding which can contribute to greater than usual volatility. Be mindful of its still rather minuscule sales revenues. These concerns heighten the need for great discipline in trading (buying AND selling)."
>>> The latest Featured Stock Update with an annotated graph appeared on 9/16/2009. click here.
|
|
C
A
S
I |
News |
Chart |
SEC
View all notes Alert
me of new notes
Company
Profile
|
PEGA
- NASDAQ
Pegasystems Inc
COMPUTER SOFTWARE & SERVICES - Business Software & Services
|
$32.32
|
-1.46
|
377,626
102% DAV
368,700
|
9/9/2009
(Date
Featured) |
$31.14
(Price
Featured) |
PP = $33.35 |
Y |
| MB = $35.02 |
Most Recent Note - 9/17/2009 6:42:00 PM
Y - Sank back under its latest pivot point today with a loss on near average volume, raising some concerns while eating away at this week's volume-driven gains that had pegged the high-ranked Computer Software - Financial firm to a new all-time high. Its 9/16/09 gain backed by more than +50% above average volume lifted it above its pivot point triggering a new technical buy signal.
>>> The latest Featured Stock Update with an annotated graph appeared on 9/9/2009. click here.
|
|
C
A
S
I |
News |
Chart |
SEC
View all notes Alert
me of new notes
Company
Profile
|
|
|
|
THESE ARE NOT BUY RECOMMENDATIONS!
Comments contained in the body of this report are technical
opinions only. The material herein has been obtained
from sources believed to be reliable and accurate, however,
its accuracy and completeness cannot be guaranteed.
This site is not an investment advisor, hence it does
not endorse or recommend any securities or other investments.
Any recommendation contained in this report may not
be suitable for all investors and it is not to be deemed
an offer or solicitation on our part with respect to
the purchase or sale of any securities. All trademarks,
service marks and trade names appearing in this report
are the property of their respective owners, and are
likewise used for identification purposes only.
This report is a service available
only to active Paid Premium Members.
You may opt-out of receiving report notifications
at any time. Questions or comments may be submitted
by writing to Premium Membership Services 665 S.E. 10 Street, Suite 201 Deerfield Beach, FL 33441-5634 or by calling 1-800-965-8307
or 954-785-1121.
|
|
|


