You are not logged in.
This means you
CAN ONLY VIEW reports that were published prior to Tuesday, May 28, 2024.
You
MUST UPGRADE YOUR MEMBERSHIP if you want to see any current reports.
AFTER MARKET UPDATE - MONDAY, SEPTEMBER 12TH, 2022
Previous After Market Report Next After Market Report >>>
|
|
|
|
DOW |
+229.63 |
32,381.34 |
+0.71% |
|
Volume |
836,767,835 |
+2% |
|
Volume |
4,133,466,800 |
-6% |
|
NASDAQ |
+154.10 |
12,266.41 |
+1.27% |
|
Advancers |
2,330 |
76% |
|
Advancers |
2,612 |
60% |
|
S&P 500 |
+43.05 |
4,110.41 |
+1.06% |
|
Decliners |
739 |
24% |
|
Decliners |
1,715 |
40% |
|
Russell 2000 |
+23.24 |
1,906.09 |
+1.23% |
|
52 Wk Highs |
42 |
|
|
52 Wk Highs |
57 |
|
|
S&P 600 |
+15.28 |
1,208.97 |
+1.28% |
|
52 Wk Lows |
37 |
|
|
52 Wk Lows |
95 |
|
|
 |
Three Major Indices Are All Back Above 50-Day Moving Averages
Kenneth J. Gruneisen - Passed the CAN SLIM® Master's Exam
The Dow added 229 points, while the Nasdaq Composite climbed 1.3%. The S&P 500 advanced 1.1% to notch its fourth-straight day of gains and longest winning streak in two months. The volume totals reported were mixed, higher than the prior session on the NYSE and lighter on the Nasdaq exchange. Breadth was positive as advancers led decliners by more than a 3-1 margin on the NYSE and by about 5-3 on the Nasdaq exchange. Leadership improved as there were 21 high-ranked companies from the Leaders List that hit new 52-week highs and were listed on the BreakOuts Page, versus the total of 15 on the prior session. New 52-week highs also outnumbered new 52-week lows on the NYSE for a 2nd consecutive session, however, new lows still outnumbered new highs on the Nasdaq exchange. The market uptrend is now under pressure (M criteria). Any sustainable rally requires a healthy crop of leading stocks hitting new highs.
Chart courtesy of www.stockcharts.com%20on%20Tuesday.%20Yesterday,%20the%20broad%20benchmark%20eclipsed%20the%204,300%20level%20for%20the%20first%20time%20since%20late%20April.%20The%20Nasdaq%20Composite%20fell%201.3%%20amid%20weakness%20in%20mega-cap%20tech%20shares.%20The%20volume%20totals%20reported%20were%20mixed,%20lighter%20than%20the%20prior%20session%20on%20the%20NYSE%20and%20higher%20on%20the%20Nasdaq%20exchange.%20Decliners%20led%20advancers%20by%20a%204-1%20margin%20on%20the%20NYSE%20ad%20by%20a%203-1%20margin%20on%20the%20Nasdaq%20exchange.%20There%20were%2017%20high-ranked%20companies%20from%20the%20Leaders%20List%20that%20hit%20new%2052-week%20highs%20and%20were%20listed%20on%20the%20BreakOuts%20Page,%20down%20from%20the%20total%20of%2045%20on%20the%20prior%20session.%20New%2052-week%20highs%20outnumbered%20new%2052-week%20lows%20on%20the%20NYSE,%20but%20new%20lows%20outnumbered%20new%20highs%20on%20the%20Nasdaq%20exchange.%20The%20market%20is%20in%20a%20confirmed%20uptrend%20(M%20criteria).%20Any%20sustainable%20rally%20requires%20a%20healthy%20crop%20of%20leading%20stocks%20hitting%20new%20highs,%20so%20the%20recent%20improvement%20in%20leadership%20was%20a%20reassuring%20sign.) 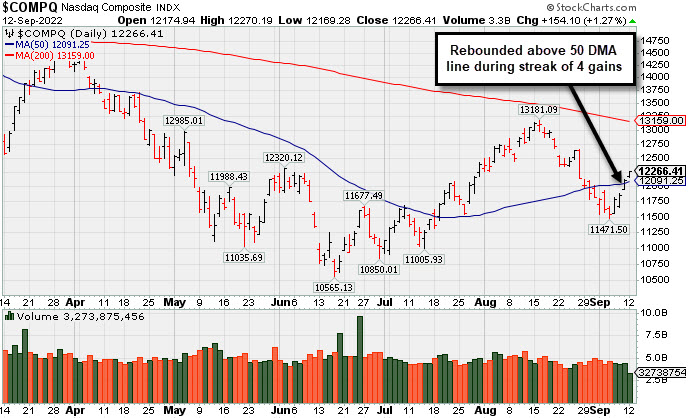 PICTURED: The Nasdaq Composite Index rebounded above its 50-day moving average (DMA) line during a streak of 4 consecutive gains. The recent low defines near-term support where a violation would raise greater concerns of a more serious market correction.
U.S. equities finished higher on Monday as investors await Tuesday’s update on U.S. inflation data. The reading has garnered attention as it is the last major data point before the Federal Reserve’s (Fed) September 21 policy meeting. The Consumer Price Index (CPI) is forecasted to have dipped 0.1% in August, potentially marking the first monthly decline since May 2020. On an annual basis, CPI is projected to have climbed 8.1%, easing from July’s 8.5% year-over-year print but still well above the Fed’s 2% target.
On the data front, a survey conducted by the New York Federal Reserve showed consumers anticipate the annual inflation rate will fall to 5.7% a year from now, notching its lowest level since October 2021. Falling gas prices are the main driver behind the more optimistic outlook.
Longer-dated Treasuries weakened, with the yield on the 10-year note climbing four basis points (0.04%) to 3.36%. The yield on the two-year note was little changed at 3.56%. In commodities, West Texas Intermediate (WTI) crude advanced 1.3% to $87.90/barrel following reports of an embargo on Russian oil and doubts over the revitalization of the 2015 Iran nuclear deal. A gauge of the U.S. dollar fell 0.6% amid speculation that inflation is nearing its peak, adding support to oil prices. |
 Kenneth J. Gruneisen started out as a licensed stockbroker in August 1987, a couple of months prior to the historic stock market crash that took the Dow Jones Industrial Average down -22.6% in a single day. He has published daily fact-based fundamental and technical analysis on high-ranked stocks online for two decades. Through FACTBASEDINVESTING.COM, Kenneth provides educational articles, news, market commentary, and other information regarding proven investment systems that work in good times and bad.
Comments contained in the body of this report are technical opinions only and are not necessarily those of Gruneisen Growth Corp. The material herein has been obtained from sources believed to be reliable and accurate, however, its accuracy and completeness cannot be guaranteed. Our firm, employees, and customers may effect transactions, including transactions contrary to any recommendation herein, or have positions in the securities mentioned herein or options with respect thereto. Any recommendation contained in this report may not be suitable for all investors and it is not to be deemed an offer or solicitation on our part with respect to the purchase or sale of any securities. |
|
 |
Retail, Financial, and Commodity-Linked Groups Led Gainers
Kenneth J. Gruneisen - Passed the CAN SLIM® Master's Exam
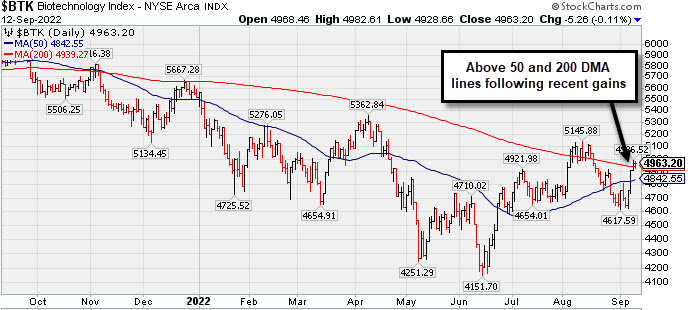
The Retail Index ($RLX +1.38%) posted a solid gain and modest gains from the Broker/Dealer Index ($XBD +0.86%) and Bank Index ($BKX +0.83%) helped boost the major market averages. Commodity-linked groups were among Monday's best gainers as the Gold & Silver Index ($XAU +1.50%), Oil Services Index ($OSX +1.27%), and Integrated Oil Index ($XOI +1.66%) each posted a solid gain. The tech sector was mostly positive as the Networking Index ($NWX +1.09%) led the way and the Semiconductor Index ($SOX +0.34%) edged higher, but the Biotech Index ($BTK -0.11%) sputtered.
PICTURED: The Biotech Index ($BTK -0.11%) sputtered but has recently rebounded back above its 50-day and 200-day moving average (DMA) lines.
| Oil Services |
$OSX |
71.67 |
+0.90 |
+1.27% |
+35.94% |
| Integrated Oil |
$XOI |
1,672.48 |
+27.29 |
+1.66% |
+41.95% |
| Semiconductor |
$SOX |
2,731.09 |
+9.31 |
+0.34% |
-30.79% |
| Networking |
$NWX |
827.69 |
+8.93 |
+1.09% |
-14.77% |
| Broker/Dealer |
$XBD |
458.84 |
+3.92 |
+0.86% |
-5.76% |
| Retail |
$RLX |
3,428.35 |
+46.60 |
+1.38% |
-18.88% |
| Gold & Silver |
$XAU |
106.58 |
+1.58 |
+1.50% |
-19.53% |
| Bank |
$BKX |
111.16 |
+0.91 |
+0.83% |
-15.93% |
| Biotech |
$BTK |
4,963.20 |
-5.26 |
-0.11% |
-10.06% |
|
|
|
 |
Positive Reversal While Consolidating Above 50-Day Moving Average
Kenneth J. Gruneisen - Passed the CAN SLIM® Master's Exam
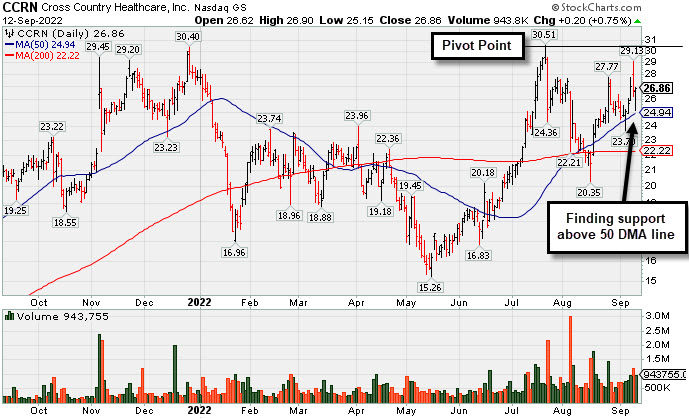
Cross Country Healthcare (CCRN +$0.20 or +0.75% to $26.86) managed a "positive reversal" today and closed near the session high. It was highlighted yellow with pivot point cited based on its 7/21/22 high plus 10 cents in the 9/09/22 mid-day report (read here). There was a "negative reversal" on that session after challenging its 52-week high with 4 consecutive gains. Subsequent gains above the pivot point backed by at least +40% above average volume may trigger a technical buy signal. It faces little resistance due to overhead supply. In recent weeks it rebounded from support near its 200 DMA line with volume-driven gains, then found support at its 50 DMA line while consolidating.
CCRN has a 99 Earnings Per Share Rating, the highest possible. It reported Jun '22 quarterly earnings +198% on +127% sales revenues versus the year ago period. Prior quarterly comparisons showed strong sales revenues and earnings increases. Annual earnings growth (A criteria) has been strong since a downturn in FY '17 and '18.
The company has only 38.2 million shares outstanding (S criteria). The number of top-rated funds owning its shares rose from 326 in Sep '21 to 400 in Jun '22, a reassuring sign concerning the I criteria. Its current Up/Down Volume Ratio of 1.6 is an unbiased indication its shares have been under accumulation over the past 50 days. It has a Timeliness Rating of A and Sponsorship Rating of B.
|
|
|
Color Codes Explained :
Y - Better candidates highlighted by our
staff of experts.
G - Previously featured
in past reports as yellow but may no longer be buyable under the
guidelines.
***Last / Change / Volume data in this table is the closing quote data***
Symbol/Exchange
Company Name
Industry Group |
PRICE |
CHANGE
(%Change) |
Day High |
Volume
(% DAV)
(% 50 day avg vol) |
52 Wk Hi
% From Hi |
Featured
Date |
Price
Featured |
Pivot Featured |
|
Max Buy |
 CI
-
NYSE
CI
-
NYSE
Cigna Corp
Medical-Managed Care
|
$294.15
|
+1.31
0.45% |
$296.29
|
2,486,316
129.50% of 50 DAV
50 DAV is 1,920,000
|
$294.53
-0.13%
|
7/7/2022
|
$276.55
|
PP = $273.68
|
|
MB = $287.36
|
 Most Recent Note - 9/12/2022 12:39:36 PM
G - Inching higher today for a 4th consecutive small gain, rising above its "max buy" level. Reported earnings for the Jun '22 quarter rose +19% on +5% sales revenues versus the year ago period, breaking a streak of 3 quarterly earnings increases above the +25% minimum guideline (C criteria), raising fundamental concerns. Near-term support to watch is at its 50 DMA line ($281).
>>> FEATURED STOCK ARTICLE : Cigna Hovering Near High Despite Earnings Under +25% Minimum - 8/26/2022 |
View all notes |
Set NEW NOTE alert |
Company Profile |
SEC
News |
Chart |
Request a new note
C
A
S
I |
ESQ
-
NASDAQ
Esquire Financial Holdings
Finance-Commercial Loans
|
$38.86
|
+1.06
2.80% |
$38.96
|
22,167
75.66% of 50 DAV
50 DAV is 29,300
|
$41.68
-6.77%
|
7/26/2022
|
$37.74
|
PP = $39.19
|
|
MB = $41.15
|
Most Recent Note - 9/12/2022 4:51:32 PM
Y - Posted a 4th consecutive gain today after recently finding support near its 50 DMA line ($36.89). Confirming gains above the pivot point backed by at least +40% above average volume would be a reassuring sign of fresh institutional buying.
>>> FEATURED STOCK ARTICLE : Testing 50-Day Moving Average With 5th Straight Loss - 9/1/2022 |
View all notes |
Set NEW NOTE alert |
Company Profile |
SEC
News |
Chart |
Request a new note
C
A
S
I |
GPK
-
NYSE
Graphic Packaging Hldg
CONSUMER NON-DURABLES - Packaging and Containers
|
$23.69
|
+0.38
1.63% |
$24.07
|
2,252,217
80.01% of 50 DAV
50 DAV is 2,815,000
|
$23.71
-0.08%
|
7/26/2022
|
$22.63
|
PP = $23.09
|
|
MB = $24.24
|
Most Recent Note - 9/9/2022 5:27:21 PM
Y - Wedged back above its pivot point with recent gains lacking great volume conviction while consolidating above support at its 50 DMA line ($22.16).
>>> FEATURED STOCK ARTICLE : Recently Slipped Below Pivot Point Testing 50-Day Average - 9/6/2022 |
View all notes |
Set NEW NOTE alert |
Company Profile |
SEC
News |
Chart |
Request a new note
C
A
S
I |
CSL
-
NYSE
Carlisle Cos Inc
Diversified Operations
|
$311.92
|
+3.19
1.03% |
$314.23
|
378,790
80.77% of 50 DAV
50 DAV is 469,000
|
$318.71
-2.13%
|
7/28/2022
|
$282.31
|
PP = $275.23
|
|
MB = $288.99
|
Most Recent Note - 9/12/2022 4:50:09 PM
G - Posted a 6th consecutive small gain, wedging up near its all-time high after a brief consolidation. Its 50 DMA line ($286.65) defines important near-term support to watch.
>>> FEATURED STOCK ARTICLE : Pulling Back From All-Time High After Volume-Driven Gains - 8/22/2022 |
View all notes |
Set NEW NOTE alert |
Company Profile |
SEC
News |
Chart |
Request a new note
C
A
S
I |
ENPH
-
NASDAQ
Enphase Energy Inc
Energy-Solar
|
$308.93
|
+3.23
1.06% |
$309.79
|
3,443,605
97.89% of 50 DAV
50 DAV is 3,518,000
|
$324.84
-4.90%
|
7/28/2022
|
$276.66
|
PP = $282.55
|
|
MB = $296.68
|
Most Recent Note - 9/9/2022 12:33:56 PM
G - Abruptly retreating today from its all-time high after 3 consecutive gains with above average volume. The prior high in the $282 area has been noted as initial support to watch above its 50 DMA line ($259.74). Fundamentals remain strong.
>>> FEATURED STOCK ARTICLE : Enphase Energy Consolidating After Rallying to New Highs - 8/19/2022 |
View all notes |
Set NEW NOTE alert |
Company Profile |
SEC
News |
Chart |
Request a new note
C
A
S
I |
Symbol/Exchange
Company Name
Industry Group |
PRICE |
CHANGE
(%Change) |
Day High |
Volume
(% DAV)
(% 50 day avg vol) |
52 Wk Hi
% From Hi |
Featured
Date |
Price
Featured |
Pivot Featured |
|
Max Buy |
PWR
-
NYSE
Quanta Services Inc
MATERIALS and CONSTRUCTION - General Contractors
|
$145.66
|
-1.10
-0.75% |
$148.15
|
774,666
74.92% of 50 DAV
50 DAV is 1,034,000
|
$149.33
-2.46%
|
7/28/2022
|
$141.83
|
PP = $140.14
|
|
MB = $147.15
|
Most Recent Note - 9/8/2022 6:28:23 PM
Y - Posted a solid gain today with near average volume, wedging back up near its "max buy" level. Confirming volume-driven gains for new highs would be a reassuring sign of fresh institutional buying demand. Its 50 DMA line ($136.53) defines important near-term support to watch. Fundamentals remain strong. See the latest FSU analysis for more details and an annotated graph.
>>> FEATURED STOCK ARTICLE : Consolidating Near Prior Highs and Above 50-Day Moving Average - 9/7/2022 |
View all notes |
Set NEW NOTE alert |
Company Profile |
SEC
News |
Chart |
Request a new note
C
A
S
I |
GFF
-
NYSE
Griffon Corporation
MATERIALS and CONSTRUCTION - General Building Materials
|
$33.93
|
-0.45
-1.31% |
$34.85
|
291,285
73.56% of 50 DAV
50 DAV is 396,000
|
$34.92
-2.84%
|
8/8/2022
|
$32.46
|
PP = $31.12
|
|
MB = $32.68
|
Most Recent Note - 9/9/2022 5:24:21 PM
G - Hit a new all-time high with today's 3rd consecutive gain after briefly undercutting prior highs in the $31 area. Important support to watch is its 50 DMA line ($30.02).
>>> FEATURED STOCK ARTICLE : Best Ever Close With Gain on Lighter Volume - 8/25/2022 |
View all notes |
Set NEW NOTE alert |
Company Profile |
SEC
News |
Chart |
Request a new note
C
A
S
I |
CLH
-
NYSE
Clean Harbors Inc
Pollution Control
|
$123.66
|
+1.25
1.02% |
$124.49
|
445,026
137.35% of 50 DAV
50 DAV is 324,000
|
$124.33
-0.54%
|
8/10/2022
|
$111.78
|
PP = $115.10
|
|
MB = $120.86
|
Most Recent Note - 9/12/2022 4:53:09 PM
G - Posted a 4th consecutive volume-driven gain today and hit a new all-time high. Prior high in the $115 area defines important near-term support to watch. No resistance remains due to overhead supply. Fundamentals remain strong.
>>> FEATURED STOCK ARTICLE : Quietly Consolidating Below "Max Buy" Level After Breakout - 8/29/2022 |
View all notes |
Set NEW NOTE alert |
Company Profile |
SEC
News |
Chart |
Request a new note
C
A
S
I |
CASY
-
NASDAQ
Caseys General Stores
RETAIL - Super/Mini Markets
|
$217.44
|
-3.69
-1.67% |
$221.95
|
365,816
141.24% of 50 DAV
50 DAV is 259,000
|
$223.90
-2.89%
|
9/8/2022
|
$217.81
|
PP = $222.40
|
|
MB = $233.52
|
Most Recent Note - 9/9/2022 5:18:17 PM
Y - Posted a gain today but closed in the lower half of its intra-day range, below the pivot point, after trading above it. Churned heavier volume behind the the prior session's loss, but ended in the upper third of its intra-day range. Highlighted in yellow in the 9/08/22 mid-day report with pivot point cited based on its 8/22/22 high. Perched within striking distance of its all-time high. Reported earnings +28% on +40% sales revenues for the Jul '22 quarter versus the year ago period, its 3rd strong quarterly comparison. Annual earnings history has been strong. See the latest FSU analysis for more details and a new annotated graph.
>>> FEATURED STOCK ARTICLE : Casey's is Perched Within Close Range of All-Time High - 9/9/2022 |
View all notes |
Set NEW NOTE alert |
Company Profile |
SEC
News |
Chart |
Request a new note
C
A
S
I |
CPRX
-
NASDAQ
Catalyst Pharma Inc
Medical-Biomed/Biotech
|
$15.15
|
+0.38
2.57% |
$15.15
|
2,040,033
83.85% of 50 DAV
50 DAV is 2,433,000
|
$15.61
-2.95%
|
9/8/2022
|
$15.14
|
PP = $15.17
|
|
MB = $15.93
|
Most Recent Note - 9/12/2022 4:54:46 PM
Y - Perched near its 52-week high following recently noted volume-driven gains. Highlighted in yellow with pivot point cited based on its 8/23/22 high plus 10 cents in the 9/08/22 mid-day report. Reported Jun '22 quarterly earnings +75% on +46% sales revenues versus the year ago period, its 3rd consecutive quarterly comparison above the +25% minimum earnings guideline (C criteria). Annual earnings (A criteria) growth has been strong since turning profitable in FY '19.
>>> FEATURED STOCK ARTICLE : Hit a New High After a 4-Week Tight Pattern of Closes - 9/8/2022 |
View all notes |
Set NEW NOTE alert |
Company Profile |
SEC
News |
Chart |
Request a new note
C
A
S
I |
Symbol/Exchange
Company Name
Industry Group |
PRICE |
CHANGE
(%Change) |
Day High |
Volume
(% DAV)
(% 50 day avg vol) |
52 Wk Hi
% From Hi |
Featured
Date |
Price
Featured |
Pivot Featured |
|
Max Buy |
CCRN
-
NASDAQ
Cross Country Healthcare
DIVERSIFIED SERVICES - Staffing and Outsourcing Service
|
$26.86
|
+0.20
0.75% |
$26.90
|
950,092
114.33% of 50 DAV
50 DAV is 831,000
|
$30.51
-11.96%
|
9/9/2022
|
$27.32
|
PP = $30.61
|
|
MB = $32.14
|
Most Recent Note - 9/12/2022 4:47:21 PM
Y - Managed a "positive reversal" today while consolidating above its 50 DMA line ($24.94) which defines important support to watch. Highlighted in yellow with pivot point cited based on its 7/21/22 high plus 10 cents in the 9/09/22 mid-day report. Subsequent gains above the pivot point backed by at least +40% above average volume may trigger a technical buy signal. See the latest FSU analysis for more details and a new annotated graph.
>>> FEATURED STOCK ARTICLE : Positive Reversal While Consolidating Above 50-Day Moving Average - 9/12/2022 |
View all notes |
Set NEW NOTE alert |
Company Profile |
SEC
News |
Chart |
Request a new note
C
A
S
I |
|
|
|
THESE ARE NOT BUY RECOMMENDATIONS!
Comments contained in the body of this report are technical
opinions only. The material herein has been obtained
from sources believed to be reliable and accurate, however,
its accuracy and completeness cannot be guaranteed.
This site is not an investment advisor, hence it does
not endorse or recommend any securities or other investments.
Any recommendation contained in this report may not
be suitable for all investors and it is not to be deemed
an offer or solicitation on our part with respect to
the purchase or sale of any securities. All trademarks,
service marks and trade names appearing in this report
are the property of their respective owners, and are
likewise used for identification purposes only.
This report is a service available
only to active Paid Premium Members.
You may opt-out of receiving report notifications
at any time. Questions or comments may be submitted
by writing to Premium Membership Services 665 S.E. 10 Street, Suite 201 Deerfield Beach, FL 33441-5634 or by calling 1-800-965-8307
or 954-785-1121.
|
|
|