You are not logged in.
This means you
CAN ONLY VIEW reports that were published prior to Monday, April 14, 2025.
You
MUST UPGRADE YOUR MEMBERSHIP if you want to see any current reports.
AFTER MARKET UPDATE - TUESDAY, SEPTEMBER 9TH, 2014
Previous After Market Report Next After Market Report >>>
|
|
|
|
DOW |
-97.55 |
17,013.87 |
-0.57% |
|
Volume |
587,079,870 |
-0% |
|
Volume |
1,818,018,910 |
+18% |
|
NASDAQ |
-40.00 |
4,552.29 |
-0.87% |
|
Advancers |
707 |
22% |
|
Advancers |
660 |
22% |
|
S&P 500 |
-13.10 |
1,988.44 |
-0.65% |
|
Decliners |
2,353 |
74% |
|
Decliners |
2,179 |
74% |
|
Russell 2000 |
-13.81 |
1,158.50 |
-1.18% |
|
52 Wk Highs |
66 |
|
|
52 Wk Highs |
54 |
|
|
S&P 600 |
-7.70 |
664.97 |
-1.14% |
|
52 Wk Lows |
38 |
|
|
52 Wk Lows |
57 |
|
|
 |
Breadth Negative as Major Averages Fell
Kenneth J. Gruneisen - Passed the CAN SLIM® Master's Exam
The major averages fell on Tuesday. Volume totals were reported near the prior session total on the NYSE and higher on the Nasdaq exchange. Breadth was negative as decliners led advancers by more than a 3-1 margin on the NYSE and on the NASDAQ exchange. There were 24 high-ranked companies from the CANSLIM.net Leaders List that made new 52-week highs and appeared on the CANSLIM.net BreakOuts Page, down from the prior session total of 41 stocks. New 52-week highs outnumbered new 52-week lows on the NYSE but new lows slightly outnumbered new highs on the Nasdaq exchange. There were unanimous losses for all of the 13 high-ranked companies currently included on the Featured Stocks Page. The broader market (M criteria) has encountered distributional pressure while leadership (stocks hitting new 52-week highs) has waned. Remember that disciplined investors buy stocks with superior fundamentals only after they have triggered a proper technical buy signal.
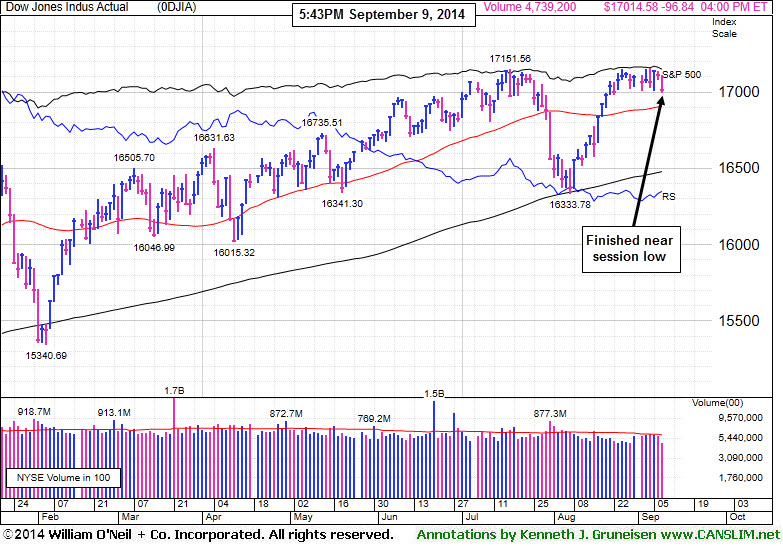 PICTURED: The Dow Jones Industrial Average declined 98 points to 17,013 and finished near the session low.
The S&P 500 Index was 13 points lower to 1,988. The NASDAQ lost 40 points to close at 4,552. The major averages finished firmly in negative territory amid speculation the Fed may raise rates sooner than expected. The market extended its decline in afternoon trading as Apple (AAPL -0.4%) gave back a +4.8% gain after unveiling a new iPhone and smart watch, and the tech bellwether ended the session down.
Telecom and utilities were down the most on the session as Verizon (VZ -1.3%) and Duke Energy (DUK -1.5%) fell. In the financials, Morgan Stanley (MS -2.7%) fell after Fed Governor Daniel Tarullo told the Senate Banking Committee the central bank is planning stricter capital requirements for banks.
Home Depot (HD -2.1%) as it confirmed a data breach of its payment systems. McDonald's (MCD -1.5%) fell after posting disappointing sales in August. On the M&A front, Annie's (BNNY +37.6%) surged after General Mills (GIS ) agreed to acquire the organic food producer for $820 million.
Treasuries fell on concerns of Fed tightening. The 10-year note was down 7/32 to yield 2.50%. In commodity trading, gold rose 0.3% to $1256.60/oz. on the COMEX. WTI crude oil finished 0.1% higher at $92.71/bbl. on the NYMEX.
The CANSLIM.net Featured Stocks Page shows the most action-worthy candidates and their latest notes and a Headline Link directs members to the latest detailed analysis with data-packed graphs annotated by a Certified expert along with links to additional resources. The Premium Member Homepage includes "dynamic archives" to all prior pay reports published.
|
 Kenneth J. Gruneisen started out as a licensed stockbroker in August 1987, a couple of months prior to the historic stock market crash that took the Dow Jones Industrial Average down -22.6% in a single day. He has published daily fact-based fundamental and technical analysis on high-ranked stocks online for two decades. Through FACTBASEDINVESTING.COM, Kenneth provides educational articles, news, market commentary, and other information regarding proven investment systems that work in good times and bad.
Comments contained in the body of this report are technical opinions only and are not necessarily those of Gruneisen Growth Corp. The material herein has been obtained from sources believed to be reliable and accurate, however, its accuracy and completeness cannot be guaranteed. Our firm, employees, and customers may effect transactions, including transactions contrary to any recommendation herein, or have positions in the securities mentioned herein or options with respect thereto. Any recommendation contained in this report may not be suitable for all investors and it is not to be deemed an offer or solicitation on our part with respect to the purchase or sale of any securities. |
|
 |
Tech and Retail Weakness Weighed on Major Indices
Kenneth J. Gruneisen - Passed the CAN SLIM® Master's Exam
The Retail Index ($RLX -1.53%) was a negative influence on the major averages while financial shares were mixed on Tuesday with the Bank Index ($BKX -1.02%) falling and the Broker/Dealer Index ($XBD +0.39%) edging higher. The tech sector saw unanimous losses from the Biotechnology Index ($BTK -1.23%), Networking Index ($NWX -1.04%), and the Semiconductor Index ($SOX -0.92%). Commodity-linked groups were mixed as the Gold & Silver Index ($XAU +0.93%) rose while the Integrated Oil Index ($XOI -0.57%) and the Oil Services Index ($OSX -0.33%) both posted smaller losses.
Charts courtesy www.stockcharts.com
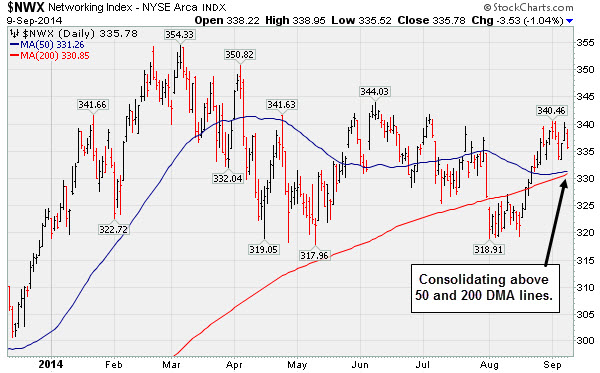
PICTURED: The Networking Index ($NWX -1.04%) is consolidating above its 50-day and 200-day moving average (DMA) lines.
| Oil Services |
$OSX |
282.61 |
-0.93 |
-0.33% |
+0.56% |
| Integrated Oil |
$XOI |
1,633.16 |
-9.38 |
-0.57% |
+8.65% |
| Semiconductor |
$SOX |
646.49 |
-6.01 |
-0.92% |
+20.83% |
| Networking |
$NWX |
335.78 |
-3.53 |
-1.04% |
+3.65% |
| Broker/Dealer |
$XBD |
169.71 |
+0.66 |
+0.39% |
+5.70% |
| Retail |
$RLX |
938.46 |
-14.58 |
-1.53% |
-0.14% |
| Gold & Silver |
$XAU |
93.61 |
+0.86 |
+0.93% |
+11.24% |
| Bank |
$BKX |
71.09 |
-0.73 |
-1.02% |
+2.64% |
| Biotech |
$BTK |
3,079.67 |
-38.19 |
-1.23% |
+32.15% |
|
|
|
 |
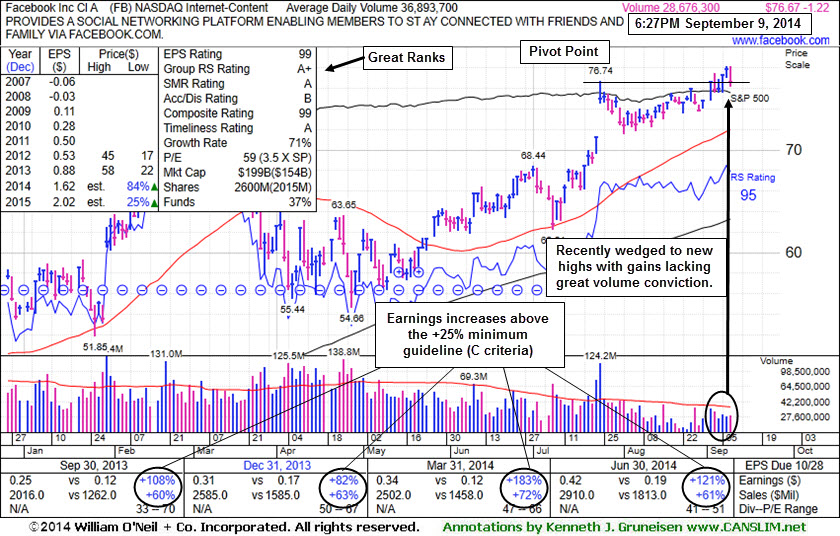
Wedging Gains Not Indicative of Institutional Conviction
Kenneth J. Gruneisen - Passed the CAN SLIM® Master's Exam
Facebook Inc (FB -$1.22 or -1.57% to $76.67) volume totals have been below average while wedging to new 52-week highs. A new pivot point is cited based on its 7/24/14 high plus 10 cents. Keep in mind that gains above a stock's pivot point should be backed by at least +40% above average volume to trigger a proper technical buy signal. Without significant volume behind gains for new highs there is little reason to believe that the kind of meaningful buying demand from the institutional crowd is lurking which can lead to a significant advance in price.
It has stubbornly held its ground since gapping up on 7/24/14. Recent lows near $72 area define initial support coinciding with its 50-day moving average DMA line ($71.99). Facebook was last shown in this FSU section on 8/20/14 with annotated graphs under the headline, " Making Limited Headway But Holding Ground Since Gap Up".
It reported earnings +121% on +61% sales revenues for the Jun '14 quarter, its 5th consecutive quarterly comparison with earnings increasing well above the +25% minimum (C criteria). It stayed well above its 200 DMA line during its consolidation after dropped from the Featured Stocks list on 4/04/14 due to weakness. Members were reminded - "Remember that any stock that is sold can always be bought back again later if strength returns."
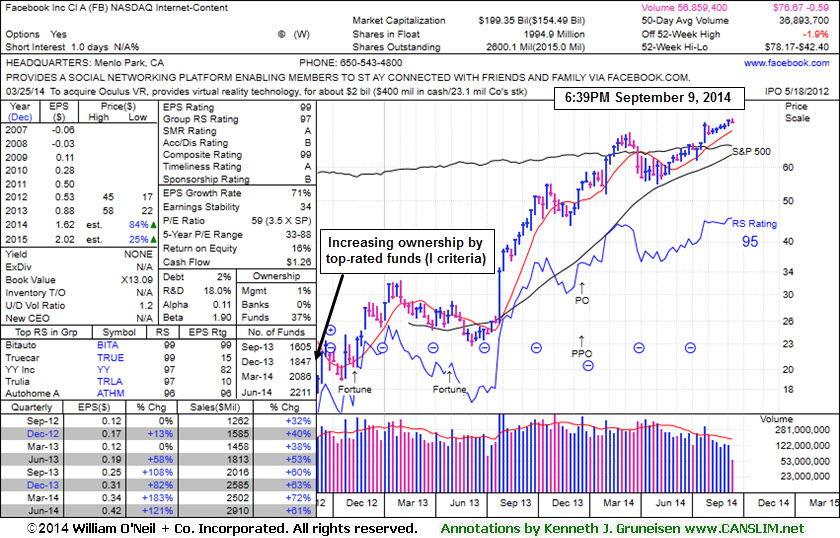
Its current Up/Down Volume Ratio of 1.2 is an unbiased bullish indication its shares have been under accumulation over the past 50 days. The high-ranked Internet - Content group leader has seen the number of top-rated funds owning its shares rise from 1,116 in Dec '12 to 2,211 in Jun '14, a reassuring sign concerning the I criteria. However, members were previously warned - "Keep in mind that its large supply of 2.54 billion shares in the public float makes it an unlikely sprinter, especially as it is already well known by the institutional crowd and the general public."
|
|
|
Color Codes Explained :
Y - Better candidates highlighted by our
staff of experts.
G - Previously featured
in past reports as yellow but may no longer be buyable under the
guidelines.
***Last / Change / Volume data in this table is the closing quote data***
Symbol/Exchange
Company Name
Industry Group |
PRICE |
CHANGE
(%Change) |
Day High |
Volume
(% DAV)
(% 50 day avg vol) |
52 Wk Hi
% From Hi |
Featured
Date |
Price
Featured |
Pivot Featured |
|
Max Buy |
ACT
-
NYSE
Actavis plc
Medical-Generic Drugs
|
$232.61
|
-0.36
-0.15% |
$234.00
|
1,617,430
69.00% of 50 DAV
50 DAV is 2,344,000
|
$233.34
-0.31%
|
6/20/2014
|
$216.53
|
PP = $230.87
|
|
MB = $242.41
|
Most Recent Note - 9/3/2014 5:54:38 PM
Y - Touched a new 52-week high today while trading very light volume but it finished with a small loss. Subsequent volume-driven gains to new highs may trigger a technical buy signal.
>>> FEATURED STOCK ARTICLE : Quietly Perched Within Striking Distance of 52-Week High - 8/28/2014
View all notes |
Set NEW NOTE alert |
CANSLIM.net Company Profile |
SEC
News |
Chart |
Request a new note
C
A N
S L
I M


|
AFSI
-
NASDAQ
Amtrust Financial Svcs
INSURANCE - Property and; Casualty Insurance
|
$42.21
|
-0.92
-2.13% |
$43.17
|
503,166
98.87% of 50 DAV
50 DAV is 508,900
|
$47.10
-10.38%
|
5/21/2014
|
$44.85
|
PP = $44.85
|
|
MB = $47.09
|
Most Recent Note - 9/8/2014 6:24:37 PM
G - Churned above average volume without making price progress recently, a sign of distributional pressure. Relative Strength Rating is currently 72, below the 80+ minimum guideline for buy candidates. See the latest FSU analysis for more details and new annotated graphs.
>>> FEATURED STOCK ARTICLE : Distributional Action; Sub Par Relative Strength Remains Concern - 9/8/2014
View all notes |
Set NEW NOTE alert |
CANSLIM.net Company Profile |
SEC
News |
Chart |
Request a new note
C
A N
S L
I M
|
BITA
-
NYSE
Bitauto Hldgs Ltd Ads
Internet-Content
|
$82.44
|
-10.63
-11.42% |
$93.44
|
4,358,894
302.07% of 50 DAV
50 DAV is 1,443,000
|
$98.28
-16.12%
|
6/26/2014
|
$46.20
|
PP = $47.03
|
|
MB = $49.38
|
 Most Recent Note - 9/9/2014 6:18:24 PM
G - Considerable loss today with heavy volume, enduring distributional pressure and finishing near the session low. Fundamentals remain strong. Noted repeatedly with caution - "Has the look of a 'climax run' with volume-driven gains getting very extended from its prior base."
>>> FEATURED STOCK ARTICLE : Finished Near Session Low - Noted With Look of "Climax Run" - 8/27/2014
View all notes |
Set NEW NOTE alert |
CANSLIM.net Company Profile |
SEC
News |
Chart |
Request a new note
C
A N
S L
I M
|
EQM
-
NYSE
E Q T Midstream Partners
ENERGY - Oil and Gas Pipelines
|
$93.42
|
-1.11
-1.17% |
$95.19
|
83,521
48.56% of 50 DAV
50 DAV is 172,000
|
$102.51
-8.87%
|
12/12/2013
|
$53.17
|
PP = $56.51
|
|
MB = $59.34
|
Most Recent Note - 9/3/2014 5:52:53 PM
G - Little resistance remains due to overhead supply while perched within close striking distance of its 52-week high with volume totals cooling in recent weeks. Reported earnings +37% on +21% sales revenues for the Jun '14 quarter, an improvement after 2 sub par quarterly earnings comparisons. See the latest FSU analysis for more details and new annotated graphs.
>>> FEATURED STOCK ARTICLE : Forming New Base But Fundamental Flaws Remain a Concern - 9/3/2014
View all notes |
Set NEW NOTE alert |
CANSLIM.net Company Profile |
SEC
News |
Chart |
Request a new note
C
A N
S L
I M
|
FB
-
NASDAQ
Facebook Inc Cl A
INTERNET
|
$76.67
|
-1.22
-1.57% |
$78.17
|
28,829,253
78.14% of 50 DAV
50 DAV is 36,893,000
|
$78.17
-1.92%
|
9/9/2014
|
$76.67
|
PP = $76.84
|
|
MB = $80.68
|
Most Recent Note - 9/9/2014 6:59:43 PM
Y - Color code is changed to yellow with new pivot point cited based on its 7/24/14 high plus 10 cents. Recent gains lacked great volume conviction while gains above a stock's pivot point must have at least +40% above averages volume to trigger a proper new (or add-on) technical buy signal. See the latest FSU analysis for more details and new annotated graphs. Prior highs in the $72 area define initial support along with its 50 DMA line.
>>> FEATURED STOCK ARTICLE : Wedging Gains Not Indicative of Institutional Conviction - 9/9/2014
View all notes |
Set NEW NOTE alert |
CANSLIM.net Company Profile |
SEC
News |
Chart |
Request a new note
C
A N
S L
I M
|
Symbol/Exchange
Company Name
Industry Group |
PRICE |
CHANGE
(%Change) |
Day High |
Volume
(% DAV)
(% 50 day avg vol) |
52 Wk Hi
% From Hi |
Featured
Date |
Price
Featured |
Pivot Featured |
|
Max Buy |
NXPI
-
NASDAQ
Nxp Semiconductors N V
ELECTRONICS - Semiconductor - Broad Line
|
$70.02
|
-1.17
-1.64% |
$73.09
|
9,013,945
295.15% of 50 DAV
50 DAV is 3,054,000
|
$72.18
-2.99%
|
8/29/2014
|
$68.50
|
PP = $67.89
|
|
MB = $71.28
|
Most Recent Note - 9/9/2014 12:17:26 PM
Y - Pulling back today following a streak of 8 consecutive gains for new 52-week highs. It remains below its "max buy" level. No overhead supply remains to act as resistance. Prior highs in the $67 area define initial support to watch on pullbacks.
>>> FEATURED STOCK ARTICLE : Gap Up For New High With Volume Triggered Technical Buy Signal - 8/29/2014
View all notes |
Set NEW NOTE alert |
CANSLIM.net Company Profile |
SEC
News |
Chart |
Request a new note
C
A N
S L
I M
|
PANW
-
NYSE
Palo Alto Networks
Computer Sftwr-Security
|
$89.28
|
-0.70
-0.78% |
$91.28
|
2,444,660
170.96% of 50 DAV
50 DAV is 1,430,000
|
$92.70
-3.69%
|
7/30/2014
|
$84.21
|
PP = $85.88
|
|
MB = $90.17
|
Most Recent Note - 9/9/2014 7:13:50 PM
Y - Erased a gain to finish with a loss today with above average volume. No resistance remains due to overhead supply. Subsequent violations of the 50 DMA line or the 8/28/14 low ($79.71) would trigger technical sell signals. Reported earnings +43% on +59% sales revenues for the Jul '14 quarter, continuing its strong earnings history satisfying the C criteria.
>>> FEATURED STOCK ARTICLE : Pulling Back Following New Technical Breakout - 9/4/2014
View all notes |
Set NEW NOTE alert |
CANSLIM.net Company Profile |
SEC
News |
Chart |
Request a new note
C
A N
S L
I M
|
STRT
-
NASDAQ
Strattec Security Corp
AUTOMOTIVE - Auto Parts
|
$85.80
|
-0.38
-0.44% |
$86.82
|
20,143
67.14% of 50 DAV
50 DAV is 30,000
|
$89.87
-4.53%
|
8/22/2014
|
$71.47
|
PP = $73.97
|
|
MB = $77.67
|
Most Recent Note - 9/9/2014 7:02:24 PM
G - Perched at its 52-week high, pausing today after 3 consecutive gains. Extended from its prior base. Prior highs near $74 define initial support to watch on pullbacks.
>>> FEATURED STOCK ARTICLE : Small Supply of Shares and Perched Near All-Time Highs - 8/22/2014
View all notes |
Set NEW NOTE alert |
CANSLIM.net Company Profile |
SEC
News |
Chart |
Request a new note
C
A N
S L
I M
|
TARO
-
NYSE
Taro Pharmaceutical Inds
DRUGS - Drug Manufacturers - Other
|
$152.33
|
-2.65
-1.71% |
$155.29
|
72,783
80.87% of 50 DAV
50 DAV is 90,000
|
$165.30
-7.85%
|
7/30/2014
|
$144.24
|
PP = $149.99
|
|
MB = $157.49
|
Most Recent Note - 9/4/2014 12:47:30 PM
G - Churning above average volume perched at its 52-week high, enduring distributional pressure. Previously noted with caution - "Extended from any sound base. Recently reported earnings for the Jun '14 quarter below the +25% minimum earnings guideline (C criteria) raising fundamental concerns."
>>> FEATURED STOCK ARTICLE : Churning Action Indicative of Distributional Pressure - 9/2/2014
View all notes |
Set NEW NOTE alert |
CANSLIM.net Company Profile |
SEC
News |
Chart |
Request a new note
C
A N
S L
I M
|
TRN
-
NYSE
Trinity Industries Inc
TRANSPORTATION - Railroads
|
$47.90
|
-0.71
-1.46% |
$48.89
|
2,493,410
99.14% of 50 DAV
50 DAV is 2,515,000
|
$50.43
-5.02%
|
4/30/2014
|
$37.79
|
PP = $38.03
|
|
MB = $39.93
|
Most Recent Note - 9/9/2014 7:04:41 PM
G - Pulled back today with higher volume. There was a "negative reversal" at its 52-week high on 9/03/14. It has not formed a sound base. Prior highs near $46-47 define near-term support above its 50 DMA line.
>>> FEATURED STOCK ARTICLE : Rallying Into New High Territory Without Forming New Base - 8/25/2014
View all notes |
Set NEW NOTE alert |
CANSLIM.net Company Profile |
SEC
News |
Chart |
Request a new note
C
A N
S L
I M
|
Symbol/Exchange
Company Name
Industry Group |
PRICE |
CHANGE
(%Change) |
Day High |
Volume
(% DAV)
(% 50 day avg vol) |
52 Wk Hi
% From Hi |
Featured
Date |
Price
Featured |
Pivot Featured |
|
Max Buy |
UA
-
NYSE
Under Armour Inc Cl A
CONSUMER NON-DURABLES - Textile - Apparel Clothing
|
$70.60
|
-2.09
-2.88% |
$72.86
|
2,225,263
94.65% of 50 DAV
50 DAV is 2,351,000
|
$73.42
-3.84%
|
7/10/2014
|
$58.50
|
PP = $60.79
|
|
MB = $63.83
|
Most Recent Note - 9/9/2014 7:08:21 PM
G - Finished near the session low today with a loss on higher volume indicative of distributional pressure. No resistance remains due to overhead supply. Fundamental concerns were raised by earnings reported +0% on +34% sales revenues for the Jun '14 quarter, below the +25% minimum earnings guideline (C criteria), yet the company raised its guidance.
>>> FEATURED STOCK ARTICLE : Holding Ground Near All-Time Highs Despite Fundamental Concerns - 8/26/2014
View all notes |
Set NEW NOTE alert |
CANSLIM.net Company Profile |
SEC
News |
Chart |
Request a new note
C
A N
S L
I M
|
WLK
-
NYSE
Westlake Chemical Corp
CHEMICALS - Specialty Chemicals
|
$94.67
|
-1.52
-1.58% |
$96.47
|
430,736
85.46% of 50 DAV
50 DAV is 504,000
|
$98.44
-3.83%
|
4/29/2014
|
$72.79
|
PP = $69.31
|
|
MB = $72.78
|
Most Recent Note - 9/9/2014 7:10:04 PM
G - Consolidating above prior highs in the $92 area defining support above its 50 DMA line. Subsequent violations would raise greater concerns and trigger technical sell signals. Technical strength has continued despite having reported earnings +11% on +6% sales revenues for the Jun '14 quarter, below the +25% minimum earnings guideline (C criteria), raising fundamental concerns.
>>> FEATURED STOCK ARTICLE : Technically Strong Despite Fundamental Concerns Raised By Most Current Quarterly Earnings - 8/21/2014
View all notes |
Set NEW NOTE alert |
CANSLIM.net Company Profile |
SEC
News |
Chart |
Request a new note
C
A N
S L
I M
|
YY
-
NASDAQ
YY Inc Ads
INTERNET - Internet Service Providers
|
$93.00
|
-2.89
-3.01% |
$96.39
|
1,899,879
133.23% of 50 DAV
50 DAV is 1,426,000
|
$96.33
-3.46%
|
8/19/2014
|
$85.81
|
PP = $91.03
|
|
MB = $95.58
|
Most Recent Note - 9/8/2014 6:27:29 PM
G - Hit another new 52-week high with today's volume-driven gain and rallied beyond its "max buy" level. Getting extended from its prior base, its color code is changed to green. Prior highs near $90 define near-term support to watch on pullbacks.
>>> FEATURED STOCK ARTICLE : Perched at High After Triggering Technical Buy Signal - 9/5/2014
View all notes |
Set NEW NOTE alert |
CANSLIM.net Company Profile |
SEC
News |
Chart |
Request a new note
C
A N
S L
I M
|
|
|
|
THESE ARE NOT BUY RECOMMENDATIONS!
Comments contained in the body of this report are technical
opinions only. The material herein has been obtained
from sources believed to be reliable and accurate, however,
its accuracy and completeness cannot be guaranteed.
This site is not an investment advisor, hence it does
not endorse or recommend any securities or other investments.
Any recommendation contained in this report may not
be suitable for all investors and it is not to be deemed
an offer or solicitation on our part with respect to
the purchase or sale of any securities. All trademarks,
service marks and trade names appearing in this report
are the property of their respective owners, and are
likewise used for identification purposes only.
This report is a service available
only to active Paid Premium Members.
You may opt-out of receiving report notifications
at any time. Questions or comments may be submitted
by writing to Premium Membership Services 665 S.E. 10 Street, Suite 201 Deerfield Beach, FL 33441-5634 or by calling 1-800-965-8307
or 954-785-1121.
|
|
|

