You are not logged in.
This means you
CAN ONLY VIEW reports that were published prior to Tuesday, April 8, 2025.
You
MUST UPGRADE YOUR MEMBERSHIP if you want to see any current reports.
AFTER MARKET UPDATE - MONDAY, SEPTEMBER 8TH, 2014
Previous After Market Report Next After Market Report >>>
|
|
|
|
DOW |
-25.94 |
17,111.42 |
-0.15% |
|
Volume |
587,838,190 |
-2% |
|
Volume |
1,542,618,660 |
+2% |
|
NASDAQ |
+9.39 |
4,592.29 |
+0.20% |
|
Advancers |
1,159 |
37% |
|
Advancers |
1,552 |
54% |
|
S&P 500 |
-6.17 |
2,001.54 |
-0.31% |
|
Decliners |
1,888 |
60% |
|
Decliners |
1,230 |
43% |
|
Russell 2000 |
+2.18 |
1,172.31 |
+0.19% |
|
52 Wk Highs |
130 |
|
|
52 Wk Highs |
86 |
|
|
S&P 600 |
+0.63 |
672.67 |
+0.09% |
|
52 Wk Lows |
24 |
|
|
52 Wk Lows |
38 |
|
|
 |
Major Averages Ended Mixed on Quiet Session
Kenneth J. Gruneisen - Passed the CAN SLIM® Master's Exam
Stocks started the week with mixed results on Monday. Volume totals were reported mixed, lighter on the NYSE and higher on the Nasdaq exchange. Decliners led advancers by a 3-2 margin on the NYSE while advancers led decliners by a 5-4 margin on the NASDAQ exchange. There were 41 high-ranked companies from the CANSLIM.net Leaders List that made new 52-week highs and appeared on the CANSLIM.net BreakOuts Page, up from the prior session total of 29 stocks. New 52-week highs expanded and outnumbered new 52-week lows on the NYSE and on the Nasdaq exchange. There were gains for 9 of the 13 high-ranked companies currently included on the Featured Stocks Page. The broader market (M criteria) has been in a "confirmed uptrend" while leadership (stocks hitting new 52-week highs) has remained healthy. Remember that disciplined investors buy stocks with superior fundamentals only after they have triggered a proper technical buy signal.
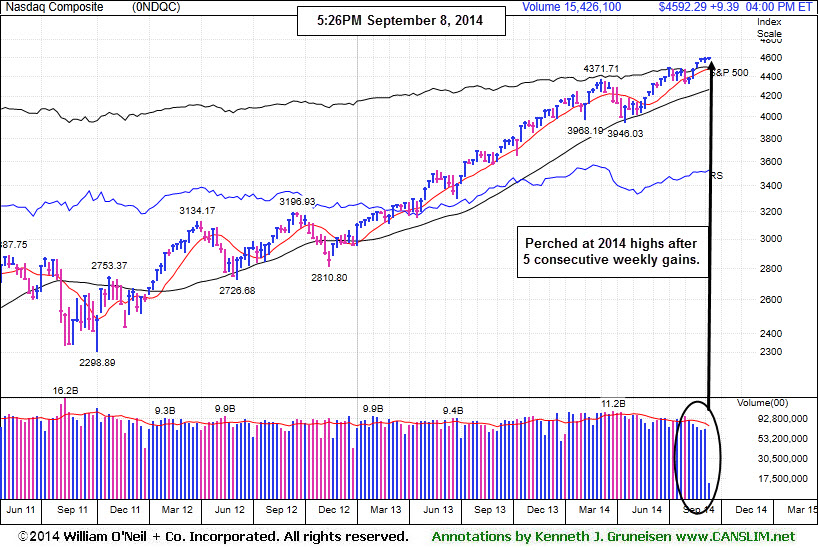
PICTURED: The Nasdaq Composite Index is perched at its 2014 high following 5 consecutive weekly gains.
The Dow fell 26 points to 17,111. The S&P 500 slipped 6 points from its record high to 2,001. The NASDAQ rose 9 points to 4,592.
The major averages were mostly lower in a relatively quiet session attributed to weakness in the energy sector and lingering geopolitical concerns. Newfield Exploration (NEW -4.67%) slumped and Exxon (XOM -1.5%) slumped as the price of crude oil retreated. The market remained down in afternoon trading after the EU announced additional sanctions against Russia.
A round of M&A news helped cap the market's decline. Shares of Multimedia Games (MGAM +30.13%) surged after Global Cash Access (GCA -0.40%) agreed to buy the casino equipment maker for $1.2 billion. Rackspace (RAX +6.85%) climbed on reports CenturyLink (CTL ) may be interested in acquiring the cloud computing software company. On the earnings front, Campbell Soup (CPB -2.15%) following its reduced full-year guidance.
Technology was best performing sector on the session with Microsoft (MSFT +1.22%) among gainers. However, Apple (AAPL -0.62%) rose ahead of Tuesday's media event which is expected to unveil a new version of the iPhone.
Treasuries were down with the 10-year note off 3/32 to yield 2.47%. In commodities, COMEX gold declined 0.9% to $1255.00/ounce. West Texas Intermediate crude oil pared losses to close down 0.3% at $92.98/barrel on the NYMEX.
The CANSLIM.net Featured Stocks Page shows the most action-worthy candidates and their latest notes and a Headline Link directs members to the latest detailed analysis with data-packed graphs annotated by a Certified expert along with links to additional resources. The Premium Member Homepage includes "dynamic archives" to all prior pay reports published.
|
 Kenneth J. Gruneisen started out as a licensed stockbroker in August 1987, a couple of months prior to the historic stock market crash that took the Dow Jones Industrial Average down -22.6% in a single day. He has published daily fact-based fundamental and technical analysis on high-ranked stocks online for two decades. Through FACTBASEDINVESTING.COM, Kenneth provides educational articles, news, market commentary, and other information regarding proven investment systems that work in good times and bad.
Comments contained in the body of this report are technical opinions only and are not necessarily those of Gruneisen Growth Corp. The material herein has been obtained from sources believed to be reliable and accurate, however, its accuracy and completeness cannot be guaranteed. Our firm, employees, and customers may effect transactions, including transactions contrary to any recommendation herein, or have positions in the securities mentioned herein or options with respect thereto. Any recommendation contained in this report may not be suitable for all investors and it is not to be deemed an offer or solicitation on our part with respect to the purchase or sale of any securities. |
|
 |
Broker/Dealer and Tech Gains Offset by Retail and Commodity-Linked Group Weakness
Kenneth J. Gruneisen - Passed the CAN SLIM® Master's Exam
The Retail Index ($RLX -0.73%) created negative pressure on the major averages while the Bank Index ($BKX +0.01%) finished flat and the Broker/Dealer Index ($XBD +1.30%) ratcheted higher. Commodity-linked groups had a negative bias as the Gold & Silver Index ($XAU -2.68%), Integrated Oil Index ($XOI -1.63%) and Oil Services Index ($OSX -1.62%) unanimously lost ground. The Networking Index ($NWX +0.88%) and Biotechnology Index ($BTK +0.97%) both posted solid gains while the Semiconductor Index ($SOX +0.19%) posted a smaller gain.
Charts courtesy www.stockcharts.com

PICTURED: The Bank Index ($BKX +0.01%) is consolidating above its 50-day moving average (DMA) line.
| Oil Services |
$OSX |
283.54 |
-4.67 |
-1.62% |
+0.89% |
| Integrated Oil |
$XOI |
1,642.54 |
-27.18 |
-1.63% |
+9.27% |
| Semiconductor |
$SOX |
652.50 |
+1.26 |
+0.19% |
+21.96% |
| Networking |
$NWX |
339.31 |
+2.96 |
+0.88% |
+4.75% |
| Broker/Dealer |
$XBD |
169.05 |
+2.18 |
+1.30% |
+5.29% |
| Retail |
$RLX |
953.04 |
-7.02 |
-0.73% |
+1.41% |
| Gold & Silver |
$XAU |
92.75 |
-2.55 |
-2.68% |
+10.22% |
| Bank |
$BKX |
71.82 |
+0.01 |
+0.01% |
+3.70% |
| Biotech |
$BTK |
3,117.62 |
+29.85 |
+0.97% |
+33.78% |
|
|
|
 |
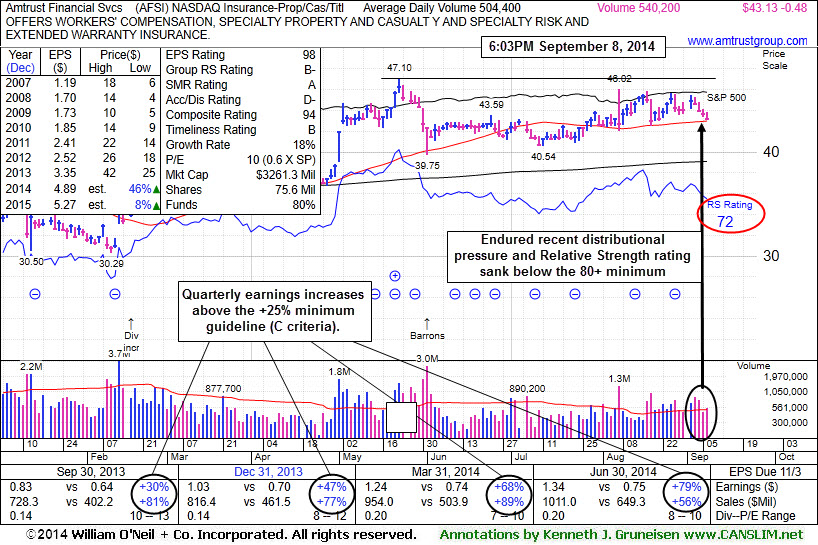
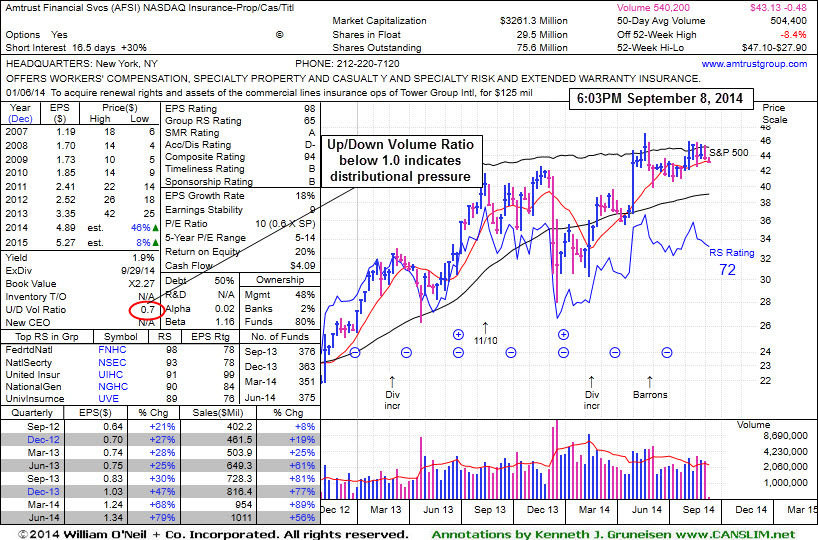
Distributional Action; Sub Par Relative Strength Remains Concern
Kenneth J. Gruneisen - Passed the CAN SLIM® Master's Exam
Amtrust Financial Svcs (AFSI -$0.48 or -1.10% to $43.13) recently traded above average volume without making price progress, a sign of distributional pressure. It is consolidating above support at its 50-day moving average (DMA) line, -8.4% off its 52-week high. Its Relative Strength Rating is currently 72 (see red circle), below the 80+ minimum guideline for buy candidates. It faces some resistance due to overhead supply up through the $47 level.
AFSI was last shown in this FSU section on 8/18/14 with detailed analysis and annotated graphs under the headline, "Relative Strength Rating Slumped While Building Longer Base", as it reversed into the red for a small loss on above average volume, a sign of distributional pressure near its prior highs.
The number of top-rated funds owning an interest rose from 363 on Dec '14 to 375 in Jun '14, a somewhat reassuring sign concerning the I criteria. The high-ranked Insurance - Property/Casualty/Title firm reported earnings +79% on +56% sales revenues for the quarter ended Jun '14 quarter versus the year ago period, its 8th consecutive comparison above the +25% minimum earnings guideline (C criteria). It has a great annual earnings (A criteria) history and it has earned an impressive 98 Earnings Per Share rating, well above the 80+ minimum rating for buy candidates.
|
|
|
Color Codes Explained :
Y - Better candidates highlighted by our
staff of experts.
G - Previously featured
in past reports as yellow but may no longer be buyable under the
guidelines.
***Last / Change / Volume data in this table is the closing quote data***
Symbol/Exchange
Company Name
Industry Group |
PRICE |
CHANGE
(%Change) |
Day High |
Volume
(% DAV)
(% 50 day avg vol) |
52 Wk Hi
% From Hi |
Featured
Date |
Price
Featured |
Pivot Featured |
|
Max Buy |
ACT
-
NYSE
Actavis plc
Medical-Generic Drugs
|
$231.29
|
+1.43
0.62% |
$231.29
|
1,304,782
55.05% of 50 DAV
50 DAV is 2,370,000
|
$232.39
-0.47%
|
6/20/2014
|
$216.53
|
PP = $230.87
|
|
MB = $242.41
|
Most Recent Note - 9/3/2014 5:54:38 PM
Y - Touched a new 52-week high today while trading very light volume but it finished with a small loss. Subsequent volume-driven gains to new highs may trigger a technical buy signal.
>>> FEATURED STOCK ARTICLE : Quietly Perched Within Striking Distance of 52-Week High - 8/28/2014
View all notes |
Set NEW NOTE alert |
CANSLIM.net Company Profile |
SEC
News |
Chart |
Request a new note
C
A N
S L
I M


|
AFSI
-
NASDAQ
Amtrust Financial Svcs
INSURANCE - Property and; Casualty Insurance
|
$43.61
|
-0.30
-0.68% |
$44.12
|
453,157
90.00% of 50 DAV
50 DAV is 503,500
|
$47.10
-7.41%
|
5/21/2014
|
$44.85
|
PP = $44.85
|
|
MB = $47.09
|
Most Recent Note - 9/3/2014 5:49:45 PM
G - Churned above average volume without making price progress today, a sign of distributional pressure. Consolidating above support at its 50 DMA line, still only -5.3% off its 52-week high. Relative Strength Rating is currently 78, below the 80+ minimum guideline for buy candidates. Faces some resistance due to overhead supply up through the $47 level.
>>> FEATURED STOCK ARTICLE : Relative Strength Rating Slumped While Building Longer Base - 8/18/2014
View all notes |
Set NEW NOTE alert |
CANSLIM.net Company Profile |
SEC
News |
Chart |
Request a new note
C
A N
S L
I M
|
BITA
-
NYSE
Bitauto Hldgs Ltd Ads
Internet-Content
|
$92.60
|
+1.07
1.17% |
$93.57
|
1,086,235
76.01% of 50 DAV
50 DAV is 1,429,000
|
$98.28
-5.78%
|
6/26/2014
|
$46.20
|
PP = $47.03
|
|
MB = $49.38
|
Most Recent Note - 9/3/2014 5:51:54 PM
G - Rallied today for its second-best close with a small gain backed by slightly above average volume. Fundamentals remain strong, however recently enduring distributional pressure and noted repeatedly with caution - "Has the look of a 'climax run' with volume-driven gains getting very extended from its prior base."
>>> FEATURED STOCK ARTICLE : Finished Near Session Low - Noted With Look of "Climax Run" - 8/27/2014
View all notes |
Set NEW NOTE alert |
CANSLIM.net Company Profile |
SEC
News |
Chart |
Request a new note
C
A N
S L
I M
|
EQM
-
NYSE
E Q T Midstream Partners
ENERGY - Oil and Gas Pipelines
|
$95.66
|
+0.26
0.27% |
$96.27
|
102,390
58.51% of 50 DAV
50 DAV is 175,000
|
$102.51
-6.68%
|
12/12/2013
|
$53.17
|
PP = $56.51
|
|
MB = $59.34
|
Most Recent Note - 9/3/2014 5:52:53 PM
G - Little resistance remains due to overhead supply while perched within close striking distance of its 52-week high with volume totals cooling in recent weeks. Reported earnings +37% on +21% sales revenues for the Jun '14 quarter, an improvement after 2 sub par quarterly earnings comparisons. See the latest FSU analysis for more details and new annotated graphs.
>>> FEATURED STOCK ARTICLE : Forming New Base But Fundamental Flaws Remain a Concern - 9/3/2014
View all notes |
Set NEW NOTE alert |
CANSLIM.net Company Profile |
SEC
News |
Chart |
Request a new note
C
A N
S L
I M
|
FB
-
NASDAQ
Facebook Inc Cl A
INTERNET
|
$77.26
|
+1.31
1.72% |
$77.38
|
29,360,010
78.12% of 50 DAV
50 DAV is 37,581,000
|
$77.48
-0.28%
|
7/24/2014
|
$76.00
|
PP = $72.69
|
|
MB = $76.32
|
Most Recent Note - 9/2/2014 6:36:55 PM
G - Color code is changed to green after it rallied for a best-ever close and finished near the session high with today's gain on higher volume but below average volume. Prior highs in the $72 area define initial support above its 50 DMA line ($70.98).
>>> FEATURED STOCK ARTICLE : Making Limited Headway But Holding Ground Since Gap Up - 8/20/2014
View all notes |
Set NEW NOTE alert |
CANSLIM.net Company Profile |
SEC
News |
Chart |
Request a new note
C
A N
S L
I M
|
Symbol/Exchange
Company Name
Industry Group |
PRICE |
CHANGE
(%Change) |
Day High |
Volume
(% DAV)
(% 50 day avg vol) |
52 Wk Hi
% From Hi |
Featured
Date |
Price
Featured |
Pivot Featured |
|
Max Buy |
NXPI
-
NASDAQ
Nxp Semiconductors N V
ELECTRONICS - Semiconductor - Broad Line
|
$70.99
|
+1.56
2.25% |
$71.10
|
3,674,279
124.01% of 50 DAV
50 DAV is 2,963,000
|
$70.38
0.87%
|
8/29/2014
|
$68.50
|
PP = $67.89
|
|
MB = $71.28
|
Most Recent Note - 9/3/2014 5:58:32 PM
Y - Today's 5th consecutive gain was backed by above average volume and it hit another new 52-week high yet it remains below its "max buy" level. No overhead supply remains to act as resistance. Prior highs in the $67 area define initial support to watch on pullbacks.
>>> FEATURED STOCK ARTICLE : Gap Up For New High With Volume Triggered Technical Buy Signal - 8/29/2014
View all notes |
Set NEW NOTE alert |
CANSLIM.net Company Profile |
SEC
News |
Chart |
Request a new note
C
A N
S L
I M
|
PANW
-
NYSE
Palo Alto Networks
Computer Sftwr-Security
|
$89.04
|
+1.78
2.04% |
$89.16
|
1,078,940
74.31% of 50 DAV
50 DAV is 1,452,000
|
$92.70
-3.95%
|
7/30/2014
|
$84.21
|
PP = $85.88
|
|
MB = $90.17
|
Most Recent Note - 9/4/2014 5:52:43 PM
Y - Erased early gains and finished near the session low for a 2nd consecutive session. Triggered a new (or add-on) technical buy signal on 9/02/14 with a considerable gain backed by more than 3 times average volume. No resistance remains due to overhead supply. Subsequent violations of the 50 DMA line or the 8/28/14 low ($79.71) would trigger technical sell signals. Reports earnings on 9/09/14 and volume and volatility often increase near earnings news. See the latest FSU analysis for more details and new annotated graphs.
>>> FEATURED STOCK ARTICLE : Pulling Back Following New Technical Breakout - 9/4/2014
View all notes |
Set NEW NOTE alert |
CANSLIM.net Company Profile |
SEC
News |
Chart |
Request a new note
C
A N
S L
I M
|
STRT
-
NASDAQ
Strattec Security Corp
AUTOMOTIVE - Auto Parts
|
$85.21
|
+1.02
1.21% |
$86.82
|
36,447
121.49% of 50 DAV
50 DAV is 30,000
|
$89.87
-5.19%
|
8/22/2014
|
$71.47
|
PP = $73.97
|
|
MB = $77.67
|
Most Recent Note - 9/2/2014 6:20:21 PM
G - Spiked to another new 52-week high today but erased much of its gain and finished in the lower third of its intra-day range, a sign of distributional pressure. Volume was +72% above average behind the gain on the prior session, however it was getting extended from its prior base by the time volume-driven gain helped clinch a technical buy signal.
>>> FEATURED STOCK ARTICLE : Small Supply of Shares and Perched Near All-Time Highs - 8/22/2014
View all notes |
Set NEW NOTE alert |
CANSLIM.net Company Profile |
SEC
News |
Chart |
Request a new note
C
A N
S L
I M
|
TARO
-
NYSE
Taro Pharmaceutical Inds
DRUGS - Drug Manufacturers - Other
|
$155.49
|
-1.05
-0.67% |
$156.89
|
47,689
51.84% of 50 DAV
50 DAV is 92,000
|
$165.30
-5.93%
|
7/30/2014
|
$144.24
|
PP = $149.99
|
|
MB = $157.49
|
Most Recent Note - 9/4/2014 12:47:30 PM
G - Churning above average volume perched at its 52-week high, enduring distributional pressure. Previously noted with caution - "Extended from any sound base. Recently reported earnings for the Jun '14 quarter below the +25% minimum earnings guideline (C criteria) raising fundamental concerns."
>>> FEATURED STOCK ARTICLE : Churning Action Indicative of Distributional Pressure - 9/2/2014
View all notes |
Set NEW NOTE alert |
CANSLIM.net Company Profile |
SEC
News |
Chart |
Request a new note
C
A N
S L
I M
|
TRN
-
NYSE
Trinity Industries Inc
TRANSPORTATION - Railroads
|
$48.49
|
-0.23
-0.47% |
$48.71
|
1,957,394
76.76% of 50 DAV
50 DAV is 2,550,000
|
$50.43
-3.85%
|
4/30/2014
|
$37.79
|
PP = $38.03
|
|
MB = $39.93
|
Most Recent Note - 9/2/2014 6:26:36 PM
G - Hit another new 52-week high with today's volume-driven gain. It has not formed a sound base. Prior highs near $46-47 define near-term support above its 50 DMA line.
>>> FEATURED STOCK ARTICLE : Rallying Into New High Territory Without Forming New Base - 8/25/2014
View all notes |
Set NEW NOTE alert |
CANSLIM.net Company Profile |
SEC
News |
Chart |
Request a new note
C
A N
S L
I M
|
Symbol/Exchange
Company Name
Industry Group |
PRICE |
CHANGE
(%Change) |
Day High |
Volume
(% DAV)
(% 50 day avg vol) |
52 Wk Hi
% From Hi |
Featured
Date |
Price
Featured |
Pivot Featured |
|
Max Buy |
UA
-
NYSE
Under Armour Inc Cl A
CONSUMER NON-DURABLES - Textile - Apparel Clothing
|
$72.53
|
+0.56
0.78% |
$72.64
|
1,738,392
73.85% of 50 DAV
50 DAV is 2,354,000
|
$72.65
-0.17%
|
7/10/2014
|
$58.50
|
PP = $60.79
|
|
MB = $63.83
|
Most Recent Note - 9/2/2014 6:28:51 PM
G - Finished near the session high and at a best-ever close with today's considerable volume-driven gain. No resistance remains due to overhead supply. Fundamental concerns were raised by earnings reported +0% on +34% sales revenues for the Jun '14 quarter, below the +25% minimum earnings guideline (C criteria), yet the company raised its guidance.
>>> FEATURED STOCK ARTICLE : Holding Ground Near All-Time Highs Despite Fundamental Concerns - 8/26/2014
View all notes |
Set NEW NOTE alert |
CANSLIM.net Company Profile |
SEC
News |
Chart |
Request a new note
C
A N
S L
I M
|
WLK
-
NYSE
Westlake Chemical Corp
CHEMICALS - Specialty Chemicals
|
$97.24
|
+0.61
0.63% |
$97.29
|
261,760
51.43% of 50 DAV
50 DAV is 509,000
|
$98.44
-1.22%
|
4/29/2014
|
$72.79
|
PP = $69.31
|
|
MB = $72.78
|
Most Recent Note - 9/2/2014 6:30:11 PM
G - Hit another new 52-week high with higher volume (near average) behind today's 4th consecutive gain. Its 50 DMA line defines support where a subsequent violation would raise greater concerns and trigger a technical sell signal. Technical strength has continued despite having reported earnings +11% on +6% sales revenues for the Jun '14 quarter, below the +25% minimum earnings guideline (C criteria), raising fundamental concerns.
>>> FEATURED STOCK ARTICLE : Technically Strong Despite Fundamental Concerns Raised By Most Current Quarterly Earnings - 8/21/2014
View all notes |
Set NEW NOTE alert |
CANSLIM.net Company Profile |
SEC
News |
Chart |
Request a new note
C
A N
S L
I M
|
YY
-
NASDAQ
YY Inc Ads
INTERNET - Internet Service Providers
|
$91.42
|
-0.70
-0.76% |
$94.05
|
1,535,249
109.74% of 50 DAV
50 DAV is 1,399,000
|
$93.88
-2.62%
|
8/19/2014
|
$85.81
|
PP = $91.03
|
|
MB = $95.58
|
Most Recent Note - 9/5/2014 6:26:48 PM
Y - Perched at its 52-week high after a rally above its pivot point with +143% above average volume on the prior session triggered a technical buy signal. Its 50 DMA line ($80.69) defines near-term support to watch. See the latest FSU analysis for more details and new annotated graphs.
>>> FEATURED STOCK ARTICLE : Perched at High After Triggering Technical Buy Signal - 9/5/2014
View all notes |
Set NEW NOTE alert |
CANSLIM.net Company Profile |
SEC
News |
Chart |
Request a new note
C
A N
S L
I M
|
|
|
|
THESE ARE NOT BUY RECOMMENDATIONS!
Comments contained in the body of this report are technical
opinions only. The material herein has been obtained
from sources believed to be reliable and accurate, however,
its accuracy and completeness cannot be guaranteed.
This site is not an investment advisor, hence it does
not endorse or recommend any securities or other investments.
Any recommendation contained in this report may not
be suitable for all investors and it is not to be deemed
an offer or solicitation on our part with respect to
the purchase or sale of any securities. All trademarks,
service marks and trade names appearing in this report
are the property of their respective owners, and are
likewise used for identification purposes only.
This report is a service available
only to active Paid Premium Members.
You may opt-out of receiving report notifications
at any time. Questions or comments may be submitted
by writing to Premium Membership Services 665 S.E. 10 Street, Suite 201 Deerfield Beach, FL 33441-5634 or by calling 1-800-965-8307
or 954-785-1121.
|
|
|