You are not logged in.
This means you
CAN ONLY VIEW reports that were published prior to Friday, March 7, 2025.
You
MUST UPGRADE YOUR MEMBERSHIP if you want to see any current reports.
AFTER MARKET UPDATE - WEDNESDAY, SEPTEMBER 10TH, 2014
Previous After Market Report Next After Market Report >>>
|
|
|
|
DOW |
+54.84 |
17,068.71 |
+0.32% |
|
Volume |
594,367,580 |
+1% |
|
Volume |
1,676,697,430 |
-8% |
|
NASDAQ |
+34.23 |
4,586.52 |
+0.75% |
|
Advancers |
1,627 |
51% |
|
Advancers |
1,706 |
59% |
|
S&P 500 |
+7.25 |
1,995.69 |
+0.36% |
|
Decliners |
1,417 |
45% |
|
Decliners |
1,072 |
37% |
|
Russell 2000 |
+6.49 |
1,164.99 |
+0.56% |
|
52 Wk Highs |
54 |
|
|
52 Wk Highs |
49 |
|
|
S&P 600 |
+2.06 |
667.03 |
+0.31% |
|
52 Wk Lows |
50 |
|
|
52 Wk Lows |
62 |
|
|
 |
Major Averages Rose With Help From Tech Sector
Kenneth J. Gruneisen - Passed the CAN SLIM® Master's Exam
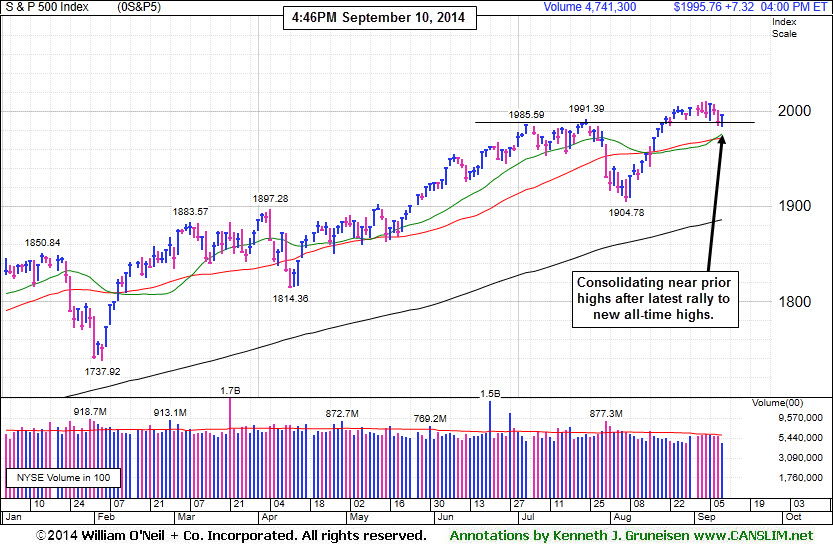
On Wednesday the major averages overcame a choppy start and posted unanimous gains. Volume totals were reported mixed, higher than the prior session total on the NYSE and lower on the Nasdaq exchange. Breadth was positive as advancers led decliners by an 8-7 margin on the NYSE and by more than 3-2 on the NASDAQ exchange. There were 25 high-ranked companies from the CANSLIM.net Leaders List that made new 52-week highs and appeared on the CANSLIM.net BreakOuts Page, up a notch from the prior session total of 24 stocks. New 52-week highs outnumbered new 52-week lows on the NYSE but new lows again outnumbered new highs on the Nasdaq exchange. There were gains for 8 of the 13 high-ranked companies currently included on the Featured Stocks Page. The broader market (M criteria) has encountered distributional pressure while leadership (stocks hitting new 52-week highs) has waned. Remember that disciplined investors buy stocks with superior fundamentals only after they have triggered a proper technical buy signal.
PICTURED: The S&P 500 added 7 points to 1,995.
The NASDAQ climbed 34 points to 4,586. Dow Jones Industrial Average was up 55 points to 17,068. Shares of Visa (V +1.2%) rallied to pace the index's advance. As the major averages finished higher a gain in technology stocks offset a retreat by the energy sector. Apple (AAPL +3.1%) rose a day after introducing the iPhone 6 and a new smartwatch. Palo Alto Networks (PANW +10.6%) spiked higher after the computer security company's sales guidance topped projections. Twitter (TWTR +4.5%) rose following positive analyst comments. Shares of Valero (VLO +3.3%) rallied after a report showed crude inventories increased for the fifth time in six weeks. Chevron (CVX -0.7%) fell.
Market action was also attributed investors attempting to gauge the timing of Fed tightening. Next week's policy meeting prompted speculation the central bank may indicate when it will begin raising interest rates. On the data front, a report this morning showed wholesale inventories grew 0.1% in July, below an expected 0.5% increase.
Treasuries extended losses to a fifth day amid the debate over Fed policy. Benchmark 10-year notes declined 9/32 to yield 2.54%. In commodity trading, WTI crude oil fell -1.1% to $91.78/bbl. on the NYMEX. COMEX gold gained +0.1% to $1,249.10/bbl.
The CANSLIM.net Featured Stocks Page shows the most action-worthy candidates and their latest notes and a Headline Link directs members to the latest detailed analysis with data-packed graphs annotated by a Certified expert along with links to additional resources. The Premium Member Homepage includes "dynamic archives" to all prior pay reports published.
|
 Kenneth J. Gruneisen started out as a licensed stockbroker in August 1987, a couple of months prior to the historic stock market crash that took the Dow Jones Industrial Average down -22.6% in a single day. He has published daily fact-based fundamental and technical analysis on high-ranked stocks online for two decades. Through FACTBASEDINVESTING.COM, Kenneth provides educational articles, news, market commentary, and other information regarding proven investment systems that work in good times and bad.
Comments contained in the body of this report are technical opinions only and are not necessarily those of Gruneisen Growth Corp. The material herein has been obtained from sources believed to be reliable and accurate, however, its accuracy and completeness cannot be guaranteed. Our firm, employees, and customers may effect transactions, including transactions contrary to any recommendation herein, or have positions in the securities mentioned herein or options with respect thereto. Any recommendation contained in this report may not be suitable for all investors and it is not to be deemed an offer or solicitation on our part with respect to the purchase or sale of any securities. |
|
 |
Retail, Financial, and Tech Groups Posted Gains
Kenneth J. Gruneisen - Passed the CAN SLIM® Master's Exam
Strength from the Retail Index ($RLX +0.42%) and gains in financial shares underpinned the major averages' rally as the Broker/Dealer Index ($XBD +0.83%) and the Bank Index ($BKX +1.04%) rose on Wednesday. The Networking Index ($NWX +1.48%) rose and the Semiconductor Index ($SOX +0.01%) finished flat. The Gold & Silver Index ($XAU -1.44%) was a laggard as it slumped, and the Integrated Oil Index ($XOI -0.27%) also edged lower while the Oil Services Index ($OSX +0.45%) posted a modest gain.
Charts courtesy www.stockcharts.com
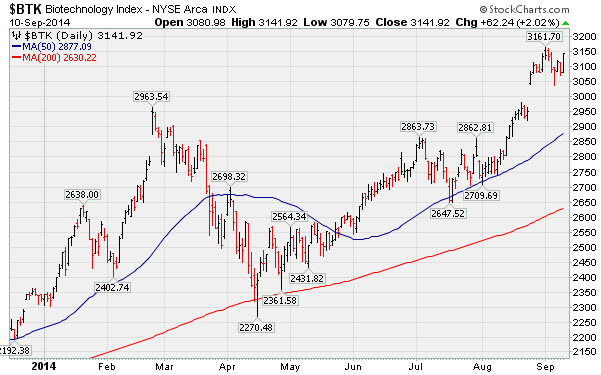
PICTURED: The Biotechnology Index ($BTK +2.02%) posted a solid gain
| Oil Services |
$OSX |
283.89 |
+1.28 |
+0.45% |
+1.02% |
| Integrated Oil |
$XOI |
1,628.81 |
-4.35 |
-0.27% |
+8.36% |
| Semiconductor |
$SOX |
646.54 |
+0.05 |
+0.01% |
+20.84% |
| Networking |
$NWX |
340.75 |
+4.97 |
+1.48% |
+5.19% |
| Broker/Dealer |
$XBD |
171.12 |
+1.40 |
+0.83% |
+6.57% |
| Retail |
$RLX |
942.42 |
+3.96 |
+0.42% |
+0.28% |
| Gold & Silver |
$XAU |
92.26 |
-1.35 |
-1.44% |
+9.64% |
| Bank |
$BKX |
71.83 |
+0.74 |
+1.04% |
+3.71% |
| Biotech |
$BTK |
3,141.92 |
+62.24 |
+2.02% |
+34.82% |
|
|
|
 |
Extended From Prior Highs and Previously Noted Base
Kenneth J. Gruneisen - Passed the CAN SLIM® Master's Exam
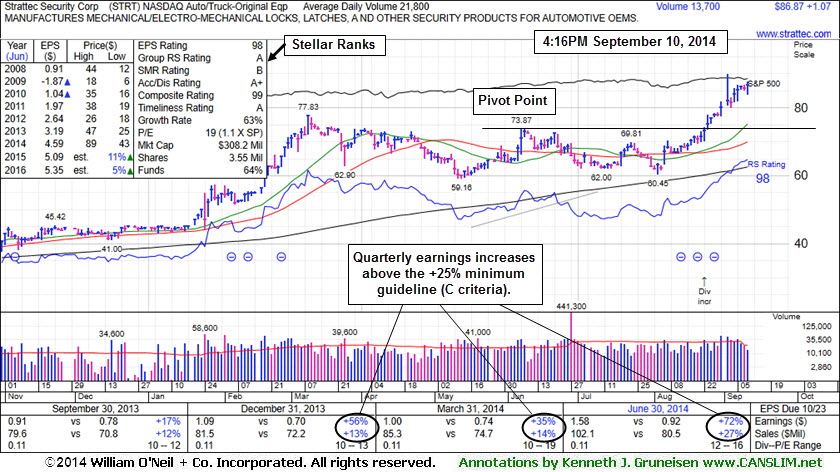
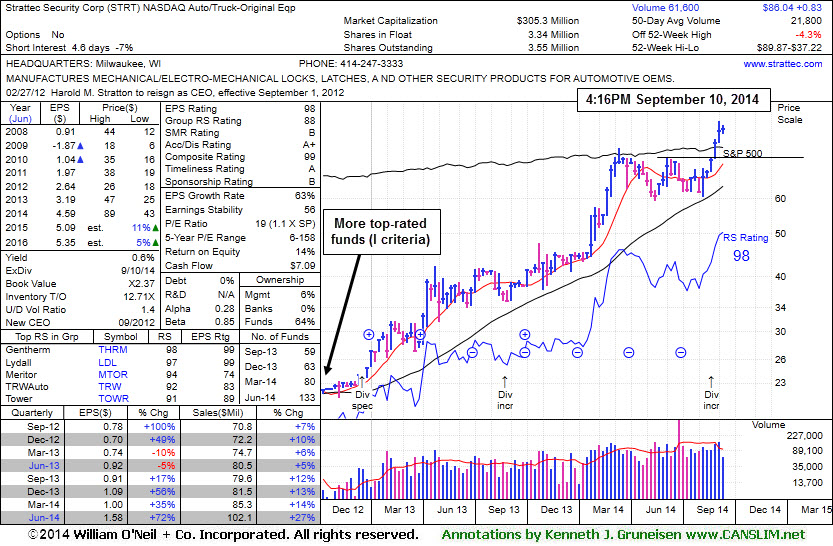
Strattec Security Corp (STRT +$0.36 or +0.42% to $86.04) is hovering at its 52-week high, pausing after recent gains. It is extended from its prior base. Prior highs in the $74-77 area define initial support to watch on pullbacks. It held its ground stubbornly and made gradual progress since last shown in this FSU section on 8/22/14 with annotated graphs under the headline, "Small Supply of Shares and Perched Near All-Time Highs".
It was first highlighted in yellow at $71.47 with pivot point based on its 6/06/14 high plus 10 cents in the earlier mid-day report (read here). While currently perched at new highs (N criteria) no overhead supply remains to act as resistance. Disciplined investors avoid chasing extended stocks, so patient investors may watch for a secondary buy point or new base to possibly form and be noted in the weeks ahead.
Quarterly earnings increases through Jun '14 above the +25% minimum guideline satisfy the C criteria and its annual earnings (A criteria) history has been strong. Increasing ownership by top-rated funds (I criteria) is a reassuring sign. The number of top-rated funds owning its shares rose from 59 in Sep '14 to 133 in Jun '14, a very reassuring sign concerning the I criteria. Its current Up/Down Volume Ratio of 1.4 is an unbiased indication its shares have been under accumulation over the past 50 days. The Auto/Truck - Original Equipment group's strong Group Relative Strength rank is a reassuring sign concerning the L criteria. The thinly-traded stock has a small supply (S criteria) of only 3.34 million shares in the public float which can contribute to greater price volatility in the event of institutional buying or selling.
|
|
|
Color Codes Explained :
Y - Better candidates highlighted by our
staff of experts.
G - Previously featured
in past reports as yellow but may no longer be buyable under the
guidelines.
***Last / Change / Volume data in this table is the closing quote data***
Symbol/Exchange
Company Name
Industry Group |
PRICE |
CHANGE
(%Change) |
Day High |
Volume
(% DAV)
(% 50 day avg vol) |
52 Wk Hi
% From Hi |
Featured
Date |
Price
Featured |
Pivot Featured |
|
Max Buy |
ACT
-
NYSE
Actavis plc
Medical-Generic Drugs
|
$231.25
|
-1.36
-0.58% |
$231.82
|
2,203,676
95.69% of 50 DAV
50 DAV is 2,303,000
|
$234.00
-1.18%
|
6/20/2014
|
$216.53
|
PP = $230.87
|
|
MB = $242.41
|
 Most Recent Note - 9/10/2014 4:44:57 PM
Y - Pulled back with higher volume today, encountering mild distributional pressure while perched at its 52-week high. Subsequent volume-driven gains to new highs may trigger a technical buy signal.
>>> FEATURED STOCK ARTICLE : Quietly Perched Within Striking Distance of 52-Week High - 8/28/2014
View all notes |
Set NEW NOTE alert |
CANSLIM.net Company Profile |
SEC
News |
Chart |
Request a new note
C
A N
S L
I M


|
AFSI
-
NASDAQ
Amtrust Financial Svcs
INSURANCE - Property and; Casualty Insurance
|
$42.20
|
-0.01
-0.02% |
$42.60
|
457,216
89.81% of 50 DAV
50 DAV is 509,100
|
$47.10
-10.40%
|
5/21/2014
|
$44.85
|
PP = $44.85
|
|
MB = $47.09
|
Most Recent Note - 9/8/2014 6:24:37 PM
G - Churned above average volume without making price progress recently, a sign of distributional pressure. Relative Strength Rating is currently 72, below the 80+ minimum guideline for buy candidates. See the latest FSU analysis for more details and new annotated graphs.
>>> FEATURED STOCK ARTICLE : Distributional Action; Sub Par Relative Strength Remains Concern - 9/8/2014
View all notes |
Set NEW NOTE alert |
CANSLIM.net Company Profile |
SEC
News |
Chart |
Request a new note
C
A N
S L
I M
|
BITA
-
NYSE
Bitauto Hldgs Ltd Ads
Internet-Content
|
$83.88
|
+1.44
1.75% |
$84.74
|
3,763,353
247.26% of 50 DAV
50 DAV is 1,522,000
|
$98.28
-14.65%
|
6/26/2014
|
$46.20
|
PP = $47.03
|
|
MB = $49.38
|
Most Recent Note - 9/10/2014 4:50:56 PM
G - Halted its slide with a small volume-driven gain today following a considerable loss with heavy volume on the prior session, enduring distributional pressure. Fundamentals remain strong. Noted repeatedly with caution - "Has the look of a 'climax run' with volume-driven gains getting very extended from its prior base."
>>> FEATURED STOCK ARTICLE : Finished Near Session Low - Noted With Look of "Climax Run" - 8/27/2014
View all notes |
Set NEW NOTE alert |
CANSLIM.net Company Profile |
SEC
News |
Chart |
Request a new note
C
A N
S L
I M
|
EQM
-
NYSE
E Q T Midstream Partners
ENERGY - Oil and Gas Pipelines
|
$95.26
|
+1.84
1.97% |
$95.50
|
111,121
64.98% of 50 DAV
50 DAV is 171,000
|
$102.51
-7.07%
|
12/12/2013
|
$53.17
|
PP = $56.51
|
|
MB = $59.34
|
Most Recent Note - 9/10/2014 4:48:00 PM
G - Posted a gain today, consolidating above its closely coinciding 50 and 200 DMA lines. Little resistance remains due to overhead supply while perched within close striking distance of its 52-week high with volume totals cooling in recent weeks. Reported earnings +37% on +21% sales revenues for the Jun '14 quarter, an improvement after 2 sub par quarterly earnings comparisons.
>>> FEATURED STOCK ARTICLE : Forming New Base But Fundamental Flaws Remain a Concern - 9/3/2014
View all notes |
Set NEW NOTE alert |
CANSLIM.net Company Profile |
SEC
News |
Chart |
Request a new note
C
A N
S L
I M
|
FB
-
NASDAQ
Facebook Inc Cl A
INTERNET
|
$77.43
|
+0.76
0.99% |
$77.95
|
29,804,082
81.56% of 50 DAV
50 DAV is 36,542,000
|
$78.17
-0.95%
|
9/9/2014
|
$76.67
|
PP = $76.84
|
|
MB = $80.68
|
Most Recent Note - 9/10/2014 4:49:18 PM
Y - Posted a small gain today on light volume. Color code was changed to yellow with new pivot point cited based on its 7/24/14 high plus 10 cents. Recent gains lacked great volume conviction while gains above a stock's pivot point must have at least +40% above averages volume to trigger a proper new (or add-on) technical buy signal. See the latest FSU analysis for more details and annotated graphs. Prior highs in the $72 area define initial support along with its 50 DMA line.
>>> FEATURED STOCK ARTICLE : Wedging Gains Not Indicative of Institutional Conviction - 9/9/2014
View all notes |
Set NEW NOTE alert |
CANSLIM.net Company Profile |
SEC
News |
Chart |
Request a new note
C
A N
S L
I M
|
Symbol/Exchange
Company Name
Industry Group |
PRICE |
CHANGE
(%Change) |
Day High |
Volume
(% DAV)
(% 50 day avg vol) |
52 Wk Hi
% From Hi |
Featured
Date |
Price
Featured |
Pivot Featured |
|
Max Buy |
NXPI
-
NASDAQ
Nxp Semiconductors N V
ELECTRONICS - Semiconductor - Broad Line
|
$70.63
|
+0.61
0.87% |
$71.00
|
3,173,944
99.12% of 50 DAV
50 DAV is 3,202,000
|
$73.09
-3.37%
|
8/29/2014
|
$68.50
|
PP = $67.89
|
|
MB = $71.28
|
Most Recent Note - 9/9/2014 12:17:26 PM
Y - Pulling back today following a streak of 8 consecutive gains for new 52-week highs. It remains below its "max buy" level. No overhead supply remains to act as resistance. Prior highs in the $67 area define initial support to watch on pullbacks.
>>> FEATURED STOCK ARTICLE : Gap Up For New High With Volume Triggered Technical Buy Signal - 8/29/2014
View all notes |
Set NEW NOTE alert |
CANSLIM.net Company Profile |
SEC
News |
Chart |
Request a new note
C
A N
S L
I M
|
PANW
-
NYSE
Palo Alto Networks
Computer Sftwr-Security
|
$98.75
|
+9.47
10.61% |
$99.90
|
8,540,187
592.25% of 50 DAV
50 DAV is 1,442,000
|
$92.70
6.53%
|
7/30/2014
|
$84.21
|
PP = $85.88
|
|
MB = $90.17
|
Most Recent Note - 9/10/2014 12:49:37 PM
G - Gapped up today and rallied beyond its "max buy" level with heavy volume and its color code is changed to green. No resistance remains due to overhead supply. Subsequent violations of the 50 DMA line or the 8/28/14 low ($79.71) would trigger technical sell signals. Reported earnings +43% on +59% sales revenues for the Jul '14 quarter, continuing its strong earnings history satisfying the C criteria.
>>> FEATURED STOCK ARTICLE : Pulling Back Following New Technical Breakout - 9/4/2014
View all notes |
Set NEW NOTE alert |
CANSLIM.net Company Profile |
SEC
News |
Chart |
Request a new note
C
A N
S L
I M
|
STRT
-
NASDAQ
Strattec Security Corp
AUTOMOTIVE - Auto Parts
|
$86.04
|
+0.36
0.42% |
$87.71
|
16,826
80.12% of 50 DAV
50 DAV is 21,000
|
$89.87
-4.27%
|
8/22/2014
|
$71.47
|
PP = $73.97
|
|
MB = $77.67
|
Most Recent Note - 9/10/2014 4:40:39 PM
G - Perched at its 52-week high, extended from its prior base. Prior highs in the $74-77 area define initial support to watch on pullbacks. See the latest FSU analysis for more details and new annotated graphs.
>>> FEATURED STOCK ARTICLE : Extended From Prior Highs and Previously Noted Base - 9/10/2014
View all notes |
Set NEW NOTE alert |
CANSLIM.net Company Profile |
SEC
News |
Chart |
Request a new note
C
A N
S L
I M
|
TARO
-
NYSE
Taro Pharmaceutical Inds
DRUGS - Drug Manufacturers - Other
|
$157.40
|
+5.07
3.33% |
$158.50
|
135,444
155.68% of 50 DAV
50 DAV is 87,000
|
$165.30
-4.78%
|
7/30/2014
|
$144.24
|
PP = $149.99
|
|
MB = $157.49
|
Most Recent Note - 9/10/2014 12:56:21 PM
G - Consolidating above its 50 DMA line and only -5.1% off its 52-week high. Recently enduring distributional pressure and noted with caution - "Extended from any sound base. Recently reported earnings for the Jun '14 quarter below the +25% minimum earnings guideline (C criteria) raising fundamental concerns."
>>> FEATURED STOCK ARTICLE : Churning Action Indicative of Distributional Pressure - 9/2/2014
View all notes |
Set NEW NOTE alert |
CANSLIM.net Company Profile |
SEC
News |
Chart |
Request a new note
C
A N
S L
I M
|
TRN
-
NYSE
Trinity Industries Inc
TRANSPORTATION - Railroads
|
$47.23
|
-0.67
-1.40% |
$48.20
|
2,915,113
118.98% of 50 DAV
50 DAV is 2,450,000
|
$50.43
-6.35%
|
4/30/2014
|
$37.79
|
PP = $38.03
|
|
MB = $39.93
|
Most Recent Note - 9/9/2014 7:04:41 PM
G - Pulled back today with higher volume. There was a "negative reversal" at its 52-week high on 9/03/14. It has not formed a sound base. Prior highs near $46-47 define near-term support above its 50 DMA line.
>>> FEATURED STOCK ARTICLE : Rallying Into New High Territory Without Forming New Base - 8/25/2014
View all notes |
Set NEW NOTE alert |
CANSLIM.net Company Profile |
SEC
News |
Chart |
Request a new note
C
A N
S L
I M
|
Symbol/Exchange
Company Name
Industry Group |
PRICE |
CHANGE
(%Change) |
Day High |
Volume
(% DAV)
(% 50 day avg vol) |
52 Wk Hi
% From Hi |
Featured
Date |
Price
Featured |
Pivot Featured |
|
Max Buy |
UA
-
NYSE
Under Armour Inc Cl A
CONSUMER NON-DURABLES - Textile - Apparel Clothing
|
$70.12
|
-0.48
-0.68% |
$71.09
|
2,052,408
87.26% of 50 DAV
50 DAV is 2,352,000
|
$73.42
-4.49%
|
7/10/2014
|
$58.50
|
PP = $60.79
|
|
MB = $63.83
|
Most Recent Note - 9/9/2014 7:08:21 PM
G - Finished near the session low today with a loss on higher volume indicative of distributional pressure. No resistance remains due to overhead supply. Fundamental concerns were raised by earnings reported +0% on +34% sales revenues for the Jun '14 quarter, below the +25% minimum earnings guideline (C criteria), yet the company raised its guidance.
>>> FEATURED STOCK ARTICLE : Holding Ground Near All-Time Highs Despite Fundamental Concerns - 8/26/2014
View all notes |
Set NEW NOTE alert |
CANSLIM.net Company Profile |
SEC
News |
Chart |
Request a new note
C
A N
S L
I M
|
WLK
-
NYSE
Westlake Chemical Corp
CHEMICALS - Specialty Chemicals
|
$95.23
|
+0.56
0.59% |
$95.51
|
519,796
103.55% of 50 DAV
50 DAV is 502,000
|
$98.44
-3.26%
|
4/29/2014
|
$72.79
|
PP = $69.31
|
|
MB = $72.78
|
Most Recent Note - 9/9/2014 7:10:04 PM
G - Consolidating above prior highs in the $92 area defining support above its 50 DMA line. Subsequent violations would raise greater concerns and trigger technical sell signals. Technical strength has continued despite having reported earnings +11% on +6% sales revenues for the Jun '14 quarter, below the +25% minimum earnings guideline (C criteria), raising fundamental concerns.
>>> FEATURED STOCK ARTICLE : Technically Strong Despite Fundamental Concerns Raised By Most Current Quarterly Earnings - 8/21/2014
View all notes |
Set NEW NOTE alert |
CANSLIM.net Company Profile |
SEC
News |
Chart |
Request a new note
C
A N
S L
I M
|
YY
-
NASDAQ
YY Inc Ads
INTERNET - Internet Service Providers
|
$91.03
|
-1.97
-2.12% |
$93.84
|
2,028,209
139.68% of 50 DAV
50 DAV is 1,452,000
|
$96.39
-5.56%
|
8/19/2014
|
$85.81
|
PP = $91.03
|
|
MB = $95.58
|
Most Recent Note - 9/8/2014 6:27:29 PM
G - Hit another new 52-week high with today's volume-driven gain and rallied beyond its "max buy" level. Getting extended from its prior base, its color code is changed to green. Prior highs near $90 define near-term support to watch on pullbacks.
>>> FEATURED STOCK ARTICLE : Perched at High After Triggering Technical Buy Signal - 9/5/2014
View all notes |
Set NEW NOTE alert |
CANSLIM.net Company Profile |
SEC
News |
Chart |
Request a new note
C
A N
S L
I M
|
|
|
|
THESE ARE NOT BUY RECOMMENDATIONS!
Comments contained in the body of this report are technical
opinions only. The material herein has been obtained
from sources believed to be reliable and accurate, however,
its accuracy and completeness cannot be guaranteed.
This site is not an investment advisor, hence it does
not endorse or recommend any securities or other investments.
Any recommendation contained in this report may not
be suitable for all investors and it is not to be deemed
an offer or solicitation on our part with respect to
the purchase or sale of any securities. All trademarks,
service marks and trade names appearing in this report
are the property of their respective owners, and are
likewise used for identification purposes only.
This report is a service available
only to active Paid Premium Members.
You may opt-out of receiving report notifications
at any time. Questions or comments may be submitted
by writing to Premium Membership Services 665 S.E. 10 Street, Suite 201 Deerfield Beach, FL 33441-5634 or by calling 1-800-965-8307
or 954-785-1121.
|
|
|