You are not logged in.
This means you
CAN ONLY VIEW reports that were published prior to Wednesday, March 12, 2025.
You
MUST UPGRADE YOUR MEMBERSHIP if you want to see any current reports.
AFTER MARKET UPDATE - THURSDAY, SEPTEMBER 8TH, 2022
Previous After Market Report Next After Market Report >>>
|
|
|
|
DOW |
+193.24 |
31,774.52 |
+0.61% |
|
Volume |
861,308,036 |
+1% |
|
Volume |
4,325,827,500 |
-3% |
|
NASDAQ |
+70.23 |
11,862.13 |
+0.60% |
|
Advancers |
1,672 |
55% |
|
Advancers |
2,477 |
57% |
|
S&P 500 |
+26.31 |
4,006.18 |
+0.66% |
|
Decliners |
1,362 |
45% |
|
Decliners |
1,846 |
43% |
|
Russell 2000 |
+14.90 |
1,846.91 |
+0.81% |
|
52 Wk Highs |
23 |
|
|
52 Wk Highs |
34 |
|
|
S&P 600 |
+4.55 |
1,171.34 |
+0.39% |
|
52 Wk Lows |
101 |
|
|
52 Wk Lows |
200 |
|
|
 |
Major Averages Continue Latest Bounce Back
Kenneth J. Gruneisen - Passed the CAN SLIM® Master's Exam
The S&P 500 gained 0.7%, while the Dow increased 193 points. The Nasdaq Composite advanced 0.6% after yesterday snapping a seven-day losing streak that had been worst run since November 2016. The volume totals reported were mixed, higher than the prior session on the NYSE and lighter on the Nasdaq exchange. Breadth was slightly positive as advancers led decliners by an 8-7 margin on the NYSE and by 4-3 on the Nasdaq exchange. There were 8 high-ranked companies from the Leaders List that hit new 52-week highs and were listed on the BreakOuts Page, up from 4 on the prior session. New 52-week lows totals still solidly outnumbered new 52-week highs on the NYSE and on the Nasdaq exchange. The market uptrend is now under pressure (M criteria). Any sustainable rally requires a healthy crop of leading stocks hitting new highs.
Chart courtesy of www.stockcharts.com%20on%20Tuesday.%20Yesterday,%20the%20broad%20benchmark%20eclipsed%20the%204,300%20level%20for%20the%20first%20time%20since%20late%20April.%20The%20Nasdaq%20Composite%20fell%201.3%%20amid%20weakness%20in%20mega-cap%20tech%20shares.%20The%20volume%20totals%20reported%20were%20mixed,%20lighter%20than%20the%20prior%20session%20on%20the%20NYSE%20and%20higher%20on%20the%20Nasdaq%20exchange.%20Decliners%20led%20advancers%20by%20a%204-1%20margin%20on%20the%20NYSE%20ad%20by%20a%203-1%20margin%20on%20the%20Nasdaq%20exchange.%20There%20were%2017%20high-ranked%20companies%20from%20the%20Leaders%20List%20that%20hit%20new%2052-week%20highs%20and%20were%20listed%20on%20the%20BreakOuts%20Page,%20down%20from%20the%20total%20of%2045%20on%20the%20prior%20session.%20New%2052-week%20highs%20outnumbered%20new%2052-week%20lows%20on%20the%20NYSE,%20but%20new%20lows%20outnumbered%20new%20highs%20on%20the%20Nasdaq%20exchange.%20The%20market%20is%20in%20a%20confirmed%20uptrend%20(M%20criteria).%20Any%20sustainable%20rally%20requires%20a%20healthy%20crop%20of%20leading%20stocks%20hitting%20new%20highs,%20so%20the%20recent%20improvement%20in%20leadership%20was%20a%20reassuring%20sign.) 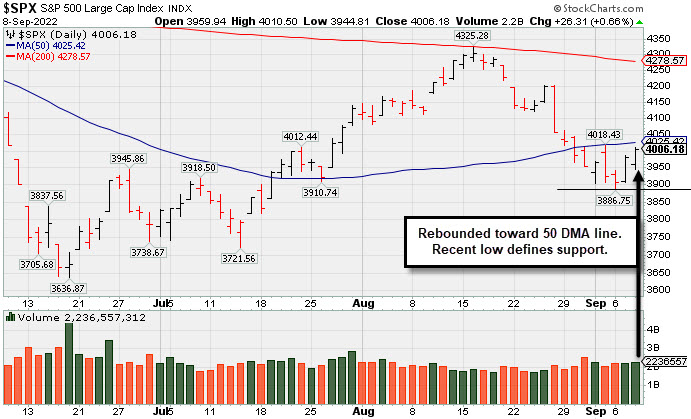 PICTURED: The S&P 500 Index rebounded toward its 50-day moving average (DMA) line. The recent low defines near-term support where a violation would raise greater concerns of a more serious market correction.
All three indexes are set to rise for the week, aiming to end a three-week rout. U.S. equities finished higher after a volatile session Thursday as investors assessed the latest remarks from Federal Reserve (Fed) Chair Jerome Powell. The Fed chief reiterated his previous hawkish stance from the Jackson Hole economic symposium, saying the central bank will fight inflation “until the job is done,” heightening expectations of another 75-basis point (0.75%) rate hike on September 21.
In other central bank news, the European Central Bank (ECB) raised rates by a widely anticipated 75 basis points (0.75%) in their latest move to curb inflation. U.S. Treasury yields climbed following the ECB’s jumbo rate hike, with the yield on the benchmark 10-year note adding four basis points (0.04%) to 3.31%. The yield on the two-year note jumped six basis points (0.06%) to 3.50%. In commodities, West Texas Intermediate (WTI) crude continued to pare weekly losses, closing up 1% to $82.79/barrel after yesterday falling to its lowest level since mid-January. Demand concerns were exacerbated following news that China’s megacity Chengdu was extending its COVID-19 lockdown. On the data front, weekly initial jobless claims declined for a fourth consecutive period, coming in at a three-month low of 222,000. Separately, the Fed reported consumer credit increased by a smaller-than-anticipated $23.8 billion in July. |
 Kenneth J. Gruneisen started out as a licensed stockbroker in August 1987, a couple of months prior to the historic stock market crash that took the Dow Jones Industrial Average down -22.6% in a single day. He has published daily fact-based fundamental and technical analysis on high-ranked stocks online for two decades. Through FACTBASEDINVESTING.COM, Kenneth provides educational articles, news, market commentary, and other information regarding proven investment systems that work in good times and bad.
Comments contained in the body of this report are technical opinions only and are not necessarily those of Gruneisen Growth Corp. The material herein has been obtained from sources believed to be reliable and accurate, however, its accuracy and completeness cannot be guaranteed. Our firm, employees, and customers may effect transactions, including transactions contrary to any recommendation herein, or have positions in the securities mentioned herein or options with respect thereto. Any recommendation contained in this report may not be suitable for all investors and it is not to be deemed an offer or solicitation on our part with respect to the purchase or sale of any securities. |
|
 |
Financial, Retail, Tech, and Commodity-Linked Groups Rose
Kenneth J. Gruneisen - Passed the CAN SLIM® Master's Exam
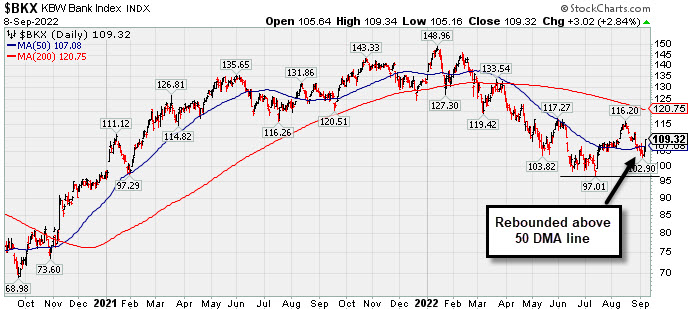
The Bank Index ($BKX +2.84%) and Broker/Dealer Index ($XBD +1.36%) both posted influential gains while the Retail Index ($RLX +0.49%) also edged higher. The Biotech Index ($BTK +3.38%) led the tech sector higher while the Semiconductor Index ($SOX +1.79%) and Networking Index ($NWX +0.98%) also notched solid gains. Commodity-linked groups also had a positive bias as the Gold & Silver Index ($XAU +1.39%) posted a solid gain while the Oil Services Index ($OSX +0.64%) and Integrated Oil Index ($XOI +0.29%) both edged higher.
PICTURED: The Bank Index ($BKX +2.84%) rebounded back above its 50-day moving average (DMA) line after the latest slump. The July low defines a very important near-term support level to watch if weakness continues.
| Oil Services |
$OSX |
67.79 |
+0.43 |
+0.64% |
+28.58% |
| Integrated Oil |
$XOI |
1,607.31 |
+4.68 |
+0.29% |
+36.42% |
| Semiconductor |
$SOX |
2,658.18 |
+46.68 |
+1.79% |
-32.64% |
| Networking |
$NWX |
806.90 |
+7.87 |
+0.98% |
-16.91% |
| Broker/Dealer |
$XBD |
445.36 |
+5.96 |
+1.36% |
-8.52% |
| Retail |
$RLX |
3,328.05 |
+16.10 |
+0.49% |
-21.26% |
| Gold & Silver |
$XAU |
102.07 |
+1.40 |
+1.39% |
-22.93% |
| Bank |
$BKX |
109.32 |
+3.02 |
+2.84% |
-17.32% |
| Biotech |
$BTK |
4,914.88 |
+160.87 |
+3.38% |
-10.94% |
|
|
|
 |
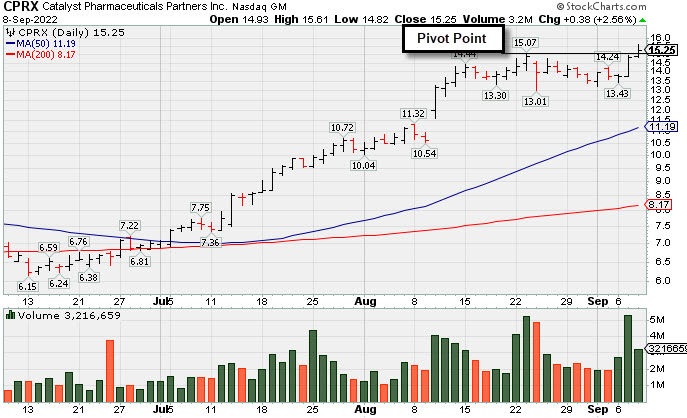
Hit a New High After a 4-Week Tight Pattern of Closes
Kenneth J. Gruneisen - Passed the CAN SLIM® Master's Exam
Catalyst Pharma Inc (CPRX +$0.38 or +2.56% to $15.25) was highlighted in yellow with pivot point cited based on its 8/23/22 high plus 10 cents in the earlier mid-day report (read here). It hit a new all-time high with +36% above average volume behind today's gain after a very tight 4-week consolidation. It went a little longer after it already formed a "3-weeks tight" with a few weekly changes of less than 2%. For a valid technical buy signal, the minimum volume threshold behind a technical breakout is +40% above average. It already rallied considerably in the weeks before forming its new advanced base pattern. Confirming volume-driven gains might provide greater reassurance that heavy institutional buying demand is still lurking. In fact, the biggest market winners usually had much heavier than normal volume behind their breakouts.
It has an Earnings Per Share rating of 98. CPRX reported Jun '22 quarterly earnings +75% on +46% sales revenues versus the year ago period, its 3rd consecutive quarterly comparison above the +25% minimum earnings guideline (C criteria). Annual earnings (A criteria) growth has been strong since turning profitable in FY '19.
The Medical-Biomed/Biotech industry group is currently ranked 4th on the 197 Industry Groups list, a reassuring sign concerning the L criteria. It has only 84.7 million shares in the public float. The number of top-rated funds owning its shares rose from 311 in Sep '21 to 358 in Jun '22, a reassuring sign concerning the I criteria. Its current Up/Down Volume Ratio of 2.6 is an unbiased indication its shares have been under accumulation over the past 50 days.
|
|
|
Color Codes Explained :
Y - Better candidates highlighted by our
staff of experts.
G - Previously featured
in past reports as yellow but may no longer be buyable under the
guidelines.
***Last / Change / Volume data in this table is the closing quote data***
Symbol/Exchange
Company Name
Industry Group |
PRICE |
CHANGE
(%Change) |
Day High |
Volume
(% DAV)
(% 50 day avg vol) |
52 Wk Hi
% From Hi |
Featured
Date |
Price
Featured |
Pivot Featured |
|
Max Buy |
 CI
-
NYSE
CI
-
NYSE
Cigna Corp
Medical-Managed Care
|
$290.71
|
+0.71
0.24% |
$291.45
|
1,985,313
103.83% of 50 DAV
50 DAV is 1,912,000
|
$293.96
-1.11%
|
7/7/2022
|
$276.55
|
PP = $273.68
|
|
MB = $287.36
|
Most Recent Note - 9/6/2022 6:13:46 PM
Y - There was a "negative reversal" today while again closing below its "max buy" level with below average volume on the session. Volume totals have been cooling while still hovering near its all-time high. Reported earnings for the Jun '22 quarter rose +19% on +5% sales revenues versus the year ago period, breaking a streak of 3 quarterly earnings increases above the +25% minimum guideline (C criteria), raising fundamental concerns. Near-term support to watch is at its 50 DMA line ($278.76).
>>> FEATURED STOCK ARTICLE : Cigna Hovering Near High Despite Earnings Under +25% Minimum - 8/26/2022 |
View all notes |
Set NEW NOTE alert |
Company Profile |
SEC
News |
Chart |
Request a new note
C
A
S
I |
AN
-
NYSE
Autonation Inc
SPECIALTY RETAIL - Auto Dealerships
|
$117.58
|
-1.87
-1.57% |
$118.97
|
917,214
134.49% of 50 DAV
50 DAV is 682,000
|
$135.57
-13.27%
|
7/20/2022
|
$122.03
|
PP = $126.49
|
|
MB = $132.81
|
Most Recent Note - 9/6/2022 12:42:16 PM
G - Slumping further below prior highs in the $126 area and its color code is changed to green after violating its 50 DMA line ($119.85) with today's 5th consecutive loss triggering a technical sell signal. Reported Jun '22 quarterly earnings +34% on -2% sales revenues versus the year ago period.
>>> FEATURED STOCK ARTICLE : Autonation Stalled After Recent Breakout - 8/30/2022 |
View all notes |
Set NEW NOTE alert |
Company Profile |
SEC
News |
Chart |
Request a new note
C
A
S
I |
ESQ
-
NASDAQ
Esquire Financial Hldgs
Finance-Commercial Loans
|
$37.35
|
+0.14
0.38% |
$38.07
|
18,782
60.59% of 50 DAV
50 DAV is 31,000
|
$41.68
-10.39%
|
7/26/2022
|
$37.74
|
PP = $39.19
|
|
MB = $41.15
|
Most Recent Note - 9/7/2022 2:29:39 PM
Y - Finding support today near its 50 DMA line ($36.63) but it has been sputtering back below the pivot point and into the prior base. Confirming gains above the pivot point backed by at least +40% above average volume would be a reassuring sign of fresh institutional buying.
>>> FEATURED STOCK ARTICLE : Testing 50-Day Moving Average With 5th Straight Loss - 9/1/2022 |
View all notes |
Set NEW NOTE alert |
Company Profile |
SEC
News |
Chart |
Request a new note
C
A
S
I |
GPK
-
NYSE
Graphic Packaging Hldg
CONSUMER NON-DURABLES - Packaging and Containers
|
$23.09
|
-0.11
-0.47% |
$23.30
|
3,571,852
126.93% of 50 DAV
50 DAV is 2,814,000
|
$23.71
-2.61%
|
7/26/2022
|
$22.63
|
PP = $23.09
|
|
MB = $24.24
|
Most Recent Note - 9/6/2022 6:07:10 PM
Y - Stalled since its 8/10/22 breakout and it slumped back below its pivot point. Consolidating just above its 50 DMA line ($22.00) which defines important near-term support. More damaging losses would raise greater concerns. See the latest FSU analysis for more details and a new annotated graph.
>>> FEATURED STOCK ARTICLE : Recently Slipped Below Pivot Point Testing 50-Day Average - 9/6/2022 |
View all notes |
Set NEW NOTE alert |
Company Profile |
SEC
News |
Chart |
Request a new note
C
A
S
I |
CSL
-
NYSE
Carlisle Cos Inc
Diversified Operations
|
$307.55
|
+4.75
1.57% |
$307.95
|
464,852
100.18% of 50 DAV
50 DAV is 464,000
|
$318.71
-3.50%
|
7/28/2022
|
$282.31
|
PP = $275.23
|
|
MB = $288.99
|
Most Recent Note - 9/7/2022 2:33:18 PM
G - Still extended from the previously noted base. Consolidating well above its 50 DMA line ($282.42) and prior highs in the $275 area define important near-term support to watch.
>>> FEATURED STOCK ARTICLE : Pulling Back From All-Time High After Volume-Driven Gains - 8/22/2022 |
View all notes |
Set NEW NOTE alert |
Company Profile |
SEC
News |
Chart |
Request a new note
C
A
S
I |
Symbol/Exchange
Company Name
Industry Group |
PRICE |
CHANGE
(%Change) |
Day High |
Volume
(% DAV)
(% 50 day avg vol) |
52 Wk Hi
% From Hi |
Featured
Date |
Price
Featured |
Pivot Featured |
|
Max Buy |
ENPH
-
NASDAQ
Enphase Energy Inc
Energy-Solar
|
$317.41
|
+1.10
0.35% |
$324.84
|
4,490,928
131.16% of 50 DAV
50 DAV is 3,424,000
|
$318.22
-0.25%
|
7/28/2022
|
$276.66
|
PP = $282.55
|
|
MB = $296.68
|
 Most Recent Note - 9/8/2022 12:42:21 PM
G - Perched at its all-time high today following 2 solid gains with above average volume. The prior high in the $282 area has been noted as initial support to watch above its 50 DMA line ($257.42). Fundamentals remain strong.
>>> FEATURED STOCK ARTICLE : Enphase Energy Consolidating After Rallying to New Highs - 8/19/2022 |
View all notes |
Set NEW NOTE alert |
Company Profile |
SEC
News |
Chart |
Request a new note
C
A
S
I |
PWR
-
NYSE
Quanta Services Inc
MATERIALS and CONSTRUCTION - General Contractors
|
$146.61
|
+4.18
2.93% |
$146.66
|
981,129
93.26% of 50 DAV
50 DAV is 1,052,000
|
$149.33
-1.82%
|
7/28/2022
|
$141.83
|
PP = $140.14
|
|
MB = $147.15
|
Most Recent Note - 9/8/2022 6:28:23 PM
Y - Posted a solid gain today with near average volume, wedging back up near its "max buy" level. Confirming volume-driven gains for new highs would be a reassuring sign of fresh institutional buying demand. Its 50 DMA line ($136.53) defines important near-term support to watch. Fundamentals remain strong. See the latest FSU analysis for more details and an annotated graph.
>>> FEATURED STOCK ARTICLE : Consolidating Near Prior Highs and Above 50-Day Moving Average - 9/7/2022 |
View all notes |
Set NEW NOTE alert |
Company Profile |
SEC
News |
Chart |
Request a new note
C
A
S
I |
GFF
-
NYSE
Griffon Corporation
MATERIALS and CONSTRUCTION - General Building Materials
|
$33.71
|
+1.75
5.48% |
$34.46
|
702,051
175.95% of 50 DAV
50 DAV is 399,000
|
$34.35
-1.86%
|
8/8/2022
|
$32.46
|
PP = $31.12
|
|
MB = $32.68
|
Most Recent Note - 9/8/2022 12:48:33 PM
G - Color code is changed to green while rallying back above its "max buy" level and hitting a new all-time high with today's 2nd big gain after briefly undercutting prior highs in the $31 area. Important support to watch is its 50 DMA line ($29.86).
>>> FEATURED STOCK ARTICLE : Best Ever Close With Gain on Lighter Volume - 8/25/2022 |
View all notes |
Set NEW NOTE alert |
Company Profile |
SEC
News |
Chart |
Request a new note
C
A
S
I |
CLH
-
NYSE
Clean Harbors Inc
Pollution Control
|
$121.82
|
+2.20
1.84% |
$122.31
|
484,993
153.48% of 50 DAV
50 DAV is 316,000
|
$124.33
-2.02%
|
8/10/2022
|
$111.78
|
PP = $115.10
|
|
MB = $120.86
|
Most Recent Note - 9/8/2022 6:37:06 PM
G - Color code is changed to green after today's 2nd consecutive gain lifted it back above its "max buy" level. Prior high in the $115 area defines important near-term support to watch. No resistance remains due to overhead supply. Fundamentals remain strong.
>>> FEATURED STOCK ARTICLE : Quietly Consolidating Below "Max Buy" Level After Breakout - 8/29/2022 |
View all notes |
Set NEW NOTE alert |
Company Profile |
SEC
News |
Chart |
Request a new note
C
A
S
I |
CASY
-
NASDAQ
Caseys General Stores
RETAIL - Grocery Stores
|
$219.90
|
-1.50
-0.68% |
$222.02
|
543,082
212.97% of 50 DAV
50 DAV is 255,000
|
$222.40
-1.12%
|
9/8/2022
|
$217.81
|
PP = $222.40
|
|
MB = $233.52
|
Most Recent Note - 9/8/2022 6:26:05 PM
Y - Churned heavier volume today and closed with a loss, but ended in the upper third of its intra-day range after highlighted in yellow in the earlier mid-day report with pivot point cited based on its 8/22/22 high. Perched within striking distance of its all-time high. Reported earnings +28% on +40% sales revenues for the Jul '22 quarter versus the year ago period, its 3rd strong quarterly comparison. Annual earnings history has been strong.
There are no Featured Stock Updates™ available for this stock at this time. You may request one by clicking the Request a New Note link below |
View all notes |
Set NEW NOTE alert |
Company Profile |
SEC
News |
Chart |
Request a new note
C
A
S
I |
Symbol/Exchange
Company Name
Industry Group |
PRICE |
CHANGE
(%Change) |
Day High |
Volume
(% DAV)
(% 50 day avg vol) |
52 Wk Hi
% From Hi |
Featured
Date |
Price
Featured |
Pivot Featured |
|
Max Buy |
CPRX
-
NASDAQ
Catalyst Pharma Inc
Medical-Biomed/Biotech
|
$15.25
|
+0.38
2.56% |
$15.61
|
3,216,244
137.09% of 50 DAV
50 DAV is 2,346,000
|
$15.07
1.19%
|
9/8/2022
|
$15.14
|
PP = $15.17
|
|
MB = $15.93
|
Most Recent Note - 9/8/2022 6:23:49 PM
Y - Finished in the middle of its intra-day range today with +36% above average volume behind its gain for a new high. Highlighted in yellow with pivot point cited based on its 8/23/22 high plus 10 cents in the earlier mid-day report. Hit a new all-time high after a very tight 4-week consolidation. Reported Jun '22 quarterly earnings +75% on +46% sales revenues versus the year ago period, its 3rd consecutive quarterly comparison above the +25% minimum earnings guideline (C criteria). Annual earnings (A criteria) growth has been strong since turning profitable in FY '19. See the latest FSU analysis for more details and a new annotated graph.
>>> FEATURED STOCK ARTICLE : Hit a New High After a 4-Week Tight Pattern of Closes - 9/8/2022 |
View all notes |
Set NEW NOTE alert |
Company Profile |
SEC
News |
Chart |
Request a new note
C
A
S
I |
|
|
|
THESE ARE NOT BUY RECOMMENDATIONS!
Comments contained in the body of this report are technical
opinions only. The material herein has been obtained
from sources believed to be reliable and accurate, however,
its accuracy and completeness cannot be guaranteed.
This site is not an investment advisor, hence it does
not endorse or recommend any securities or other investments.
Any recommendation contained in this report may not
be suitable for all investors and it is not to be deemed
an offer or solicitation on our part with respect to
the purchase or sale of any securities. All trademarks,
service marks and trade names appearing in this report
are the property of their respective owners, and are
likewise used for identification purposes only.
This report is a service available
only to active Paid Premium Members.
You may opt-out of receiving report notifications
at any time. Questions or comments may be submitted
by writing to Premium Membership Services 665 S.E. 10 Street, Suite 201 Deerfield Beach, FL 33441-5634 or by calling 1-800-965-8307
or 954-785-1121.
|
|
|