You are not logged in.
This means you
CAN ONLY VIEW reports that were published prior to Monday, April 14, 2025.
You
MUST UPGRADE YOUR MEMBERSHIP if you want to see any current reports.
AFTER MARKET UPDATE - TUESDAY, SEPTEMBER 6TH, 2011
Previous After Market Report Next After Market Report >>>
|
|
|
|
DOW |
-100.96 |
11,139.30 |
-0.90% |
|
Volume |
1,124,285,260 |
+15% |
|
Volume |
1,697,156,570 |
+10% |
|
NASDAQ |
-6.50 |
2,473.83 |
-0.26% |
|
Advancers |
812 |
26% |
|
Advancers |
885 |
33% |
|
S&P 500 |
-8.73 |
1,165.24 |
-0.74% |
|
Decliners |
2,215 |
71% |
|
Decliners |
1,683 |
63% |
|
Russell 2000 |
-2.49 |
680.87 |
-0.36% |
|
52 Wk Highs |
16 |
|
|
52 Wk Highs |
16 |
|
|
S&P 600 |
-0.81 |
373.24 |
-0.22% |
|
52 Wk Lows |
210 |
|
|
52 Wk Lows |
241 |
|
|
 |
Indices Finished Up From Early Lows But Facing Pressure
Kenneth J. Gruneisen - Passed the CAN SLIM® Master's Exam
Stocks were sharply lower following the Labor Day weekend as the major averages sold off deeply at Tuesday's open and remained in the red after rebounding throughout the session. The volume totals were reported higher on the NYSE and on the Nasdaq exchange. Declining issues outnumbered advancers by about 11-4 on the NYSE and by nearly 2-1 on the Nasdaq exchange. New 52-week lows expanded again and the total substantially outnumbered new 52-week highs on both major exchanges. There were 13 high-ranked companies from the CANSLIM.net Leaders List that made new 52-week highs and appeared on the CANSLIM.net BreakOuts Page, up from the prior session total of 6 stocks. A further expansion in leadership would be a welcome reassurance for the current rally, and leadership will be critical factor in determining if stocks can extend the rally for a meaningful advance. Any sustainable rally requires a healthy crop of strong leaders hitting new 52-week highs, as this commentary has repeated! There were 4 gainers out of the 7 high-ranked leaders currently included on the Featured Stocks Page.
Concerns about global growth and the debt crisis in Europe carried the day. Bank stocks continued Friday's descent after federal regulators filed lawsuits over mortgage-backed securities. Losers included Bank of America Corp (BAC -3.59%), Citigroup Inc (C -2.46%), and JP Morgan Chase & Co (JPM -3.44%). Meanwhile, the 10-year Treasury note was up 4/32 to yield 1.97%, and the yield earlier dropped to a record near 1.91%.
European markets were under more pressure as a general strike in Italy increased fears the Italian government may backslide on its austerity plan. The U.S. market received some consolation from a merger and a new economic report. A measure of the U.S. service economy showed a greater expansion in August than predicted. International Paper (IP +8.94%) announced it will buy Temple-Inland Inc (TIN +25.25%) form $3.7 billion. Sunoco Inc (SUN -5.3%) said it will exit its refining business.
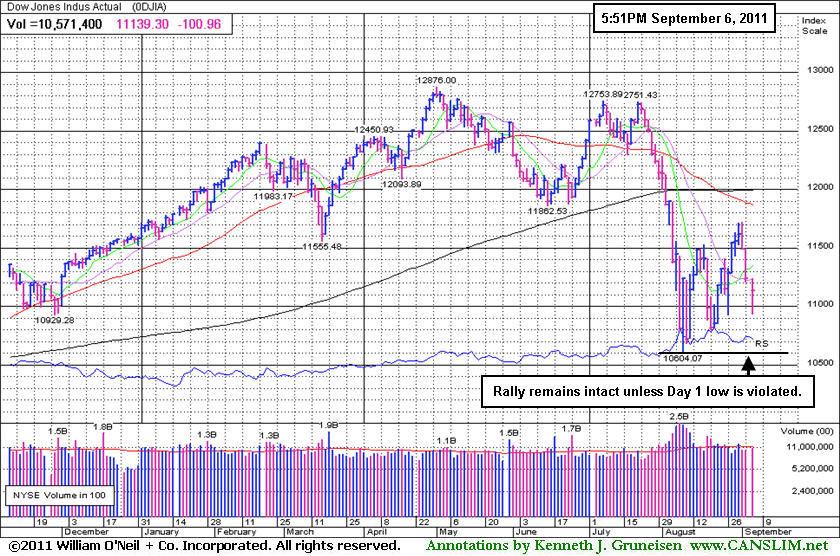
The Dow fell as many as 307 points before closing down 101 at 11,139 as Caterpillar Inc (CAT +0.37%), Pfizer Inc (PFE +1.03%), and Johnson & Johnson (JNJ +0.89%) were the only Dow components to finish positive.
Disciplined investors may carefully consider new buying efforts when all key criteria are satisfied, as the market environment (M criteria) may currently be described as an uptrend under pressure. However, the indices remain well below their respective 200-day moving average (DMA) lines, while to be considered truly "healthy" they would need to rebound above their long-term averages.
The September 2011 issue of CANSLIM.net News will be available soon. The Q3 2011 Webcast has also been scheduled for Wednesday, September 28th at 8PM EST. Links to all prior reports and webcasts are available on the Premium Member Homepage.
PICTURED: The Dow Jones Industrial Average suffered its 3rd consecutive loss. The current rally remains intact unless its Day 1 low (8/09/11) is violated.
|
 Kenneth J. Gruneisen started out as a licensed stockbroker in August 1987, a couple of months prior to the historic stock market crash that took the Dow Jones Industrial Average down -22.6% in a single day. He has published daily fact-based fundamental and technical analysis on high-ranked stocks online for two decades. Through FACTBASEDINVESTING.COM, Kenneth provides educational articles, news, market commentary, and other information regarding proven investment systems that work in good times and bad.
Comments contained in the body of this report are technical opinions only and are not necessarily those of Gruneisen Growth Corp. The material herein has been obtained from sources believed to be reliable and accurate, however, its accuracy and completeness cannot be guaranteed. Our firm, employees, and customers may effect transactions, including transactions contrary to any recommendation herein, or have positions in the securities mentioned herein or options with respect thereto. Any recommendation contained in this report may not be suitable for all investors and it is not to be deemed an offer or solicitation on our part with respect to the purchase or sale of any securities. |
|
 |
Financials' Weakness Still Worrisome
Kenneth J. Gruneisen - Passed the CAN SLIM® Master's Exam
The Broker/Dealer Index ($XBD -1.93%) and Bank Index ($BKX -1.68%) started the week with more worrisome losses. Energy-related shares backpedaled as the Integrated Oil Index ($XOI -1.03%) and Oil Services Index ($OSX -0.59%) ended with modest losses. The Healthcare Index ($HMO -0.34%) edged lower and the Gold & Silver Index ($XAU +0.13%) inched higher. The Retail Index ($RLX +0.55%) ended with a small gain, and the Biotechnology Index ($BTK +0.92%) posted a gain while the Internet Index ($IIX -0.05%) finished flat and the Semiconductor Index ($SOX -0.69%) and Networking Index ($NWX -2.06%) lost ground.
Charts courtesy www.stockcharts.com
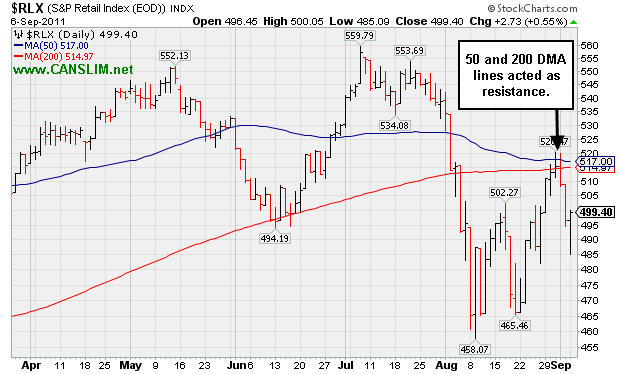
PICTURED: The Retail Index ($RLX +0.55%) recently encountered resistance at its 50-day and 200-day moving average (DMA) lines.
| Oil Services |
$OSX |
225.18 |
-1.34 |
-0.59% |
-8.13% |
| Healthcare |
$HMO |
1,991.12 |
-6.79 |
-0.34% |
+17.68% |
| Integrated Oil |
$XOI |
1,111.76 |
-11.61 |
-1.03% |
-8.36% |
| Semiconductor |
$SOX |
339.09 |
-2.37 |
-0.69% |
-17.66% |
| Networking |
$NWX |
224.30 |
-4.72 |
-2.06% |
-20.05% |
| Internet |
$IIX |
276.49 |
-0.15 |
-0.05% |
-10.15% |
| Broker/Dealer |
$XBD |
84.68 |
-1.67 |
-1.93% |
-30.31% |
| Retail |
$RLX |
499.40 |
+2.73 |
+0.55% |
-1.77% |
| Gold & Silver |
$XAU |
223.07 |
+0.28 |
+0.13% |
-1.55% |
| Bank |
$BKX |
36.38 |
-0.62 |
-1.68% |
-30.32% |
| Biotech |
$BTK |
1,158.39 |
+10.58 |
+0.92% |
-10.73% |
|
|
|
 |
Finance Firm Has Been a Strong Outlier in Tough Market
Kenneth J. Gruneisen - Passed the CAN SLIM® Master's Exam
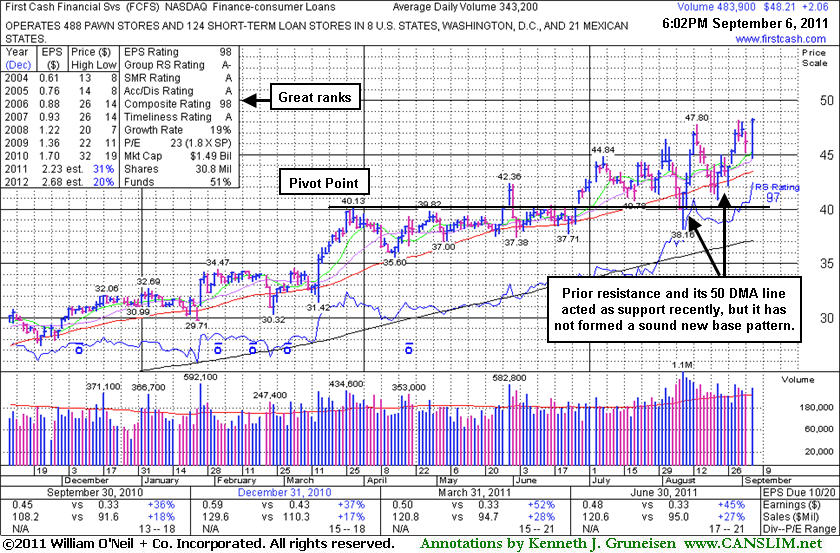
First Cash Financial Services Inc. (FCFS +$2.06 or +4.46% to $48.21) posted a considerable gain today with above average volume, closing near the session high after reaching a new all-time high. It has not formed a sound new base pattern. Its 50-day moving average (DMA) line and old resistance level recently defined support during its choppy ascent. Its last appearance in this FSU section was on 8/22/11 with an annotated graph under the headline, "Consolidating Near 50-Day Average Following Reversal at New High". Since then, it managed to find support and then impressively sprint to another new high with volume-driven gains.
It reported earnings +45% on +27% sales revenues for the quarter ended June 30, 2011 versus the year ago period and its annual earnings (A criteria) history has been steady and strong. The number of top-rated funds owning its shares rose from 340 in Sep '10 to 349 in Jun '11, and the ownership from institutional investors (I criteria) has been fairly reassuring. The M criteria (market direction) largely determines whether stocks produce great gains, and while FCFS has fared well since featured in yellow in the 5/31/11 mid-day report (read here), investors should keep in mind that 3 out of 4 stocks tend to follow along with the broader market averages' direction.
|
|
|
Color Codes Explained :
Y - Better candidates highlighted by our
staff of experts.
G - Previously featured
in past reports as yellow but may no longer be buyable under the
guidelines.
***Last / Change / Volume data in this table is the closing quote data***
Symbol/Exchange
Company Name
Industry Group |
PRICE |
CHANGE
(%Change) |
Day High |
Volume
(% DAV)
(% 50 day avg vol) |
52 Wk Hi
% From Hi |
Featured
Date |
Price
Featured |
Pivot Featured |
|
Max Buy |
EXLS
-
NASDAQ
Exlservice Holdings Inc
DIVERSIFIED SERVICES - Business/Management Services
|
$25.53
|
-0.02
-0.08% |
$25.62
|
100,103
105.37% of 50 DAV
50 DAV is 95,000
|
$26.46
-3.51%
|
8/2/2011
|
$24.85
|
PP = $24.85
|
|
MB = $26.09
|
 Most Recent Note - 9/6/2011 4:23:28 PM
Y - Finished near the session high with a small loss. Still perched near its 2011 high, holding its ground just under its "max buy" level after a spurt of volume-driven gains. Its 50 DMA line defines important chart support to watch on pullbacks.
>>> The latest Featured Stock Update with an annotated graph appeared on 8/25/2011. Click here.
View all notes |
Alert me of new notes |
CANSLIM.net Company Profile |
SEC |
Zacks Reports |
StockTalk |
News |
Chart |
Request a new note
C
A N
S L
I M


|
FCFS
-
NASDAQ
First Cash Financial Svs
SPECIALTY RETAIL - Specialty Retail, Other
|
$48.21
|
+2.06
4.46% |
$48.30
|
485,582
141.49% of 50 DAV
50 DAV is 343,200
|
$48.19
0.04%
|
5/31/2011
|
$42.00
|
PP = $40.23
|
|
MB = $42.24
|
Most Recent Note - 9/6/2011 4:11:15 PM
G - Considerable gain today with above average volume, closing near the session high after reaching a new all-time high. It has not formed a sound new base pattern. Its 50 DMA line defines supports to watch.
>>> The latest Featured Stock Update with an annotated graph appeared on 9/6/2011. Click here.
View all notes |
Alert me of new notes |
CANSLIM.net Company Profile |
SEC |
Zacks Reports |
StockTalk |
News |
Chart |
Request a new note
C
A N
S L
I M
|
JCOM
-
NASDAQ
J 2 Global Communication
INTERNET - Internet Software and Services
|
$30.69
|
-0.33
-1.06% |
$30.86
|
507,268
133.28% of 50 DAV
50 DAV is 380,600
|
$32.64
-5.97%
|
8/8/2011
|
$30.38
|
PP = $29.31
|
|
MB = $30.78
|
Most Recent Note - 9/6/2011 4:14:31 PM
G - After slumping under its "max buy" level it closed near the session high today but suffered its 4th consecutive loss with above average volume since reaching a new 52-week high on 8/30/11. Previous highs in the $30-31 area now define initial chart support on pullbacks.
>>> The latest Featured Stock Update with an annotated graph appeared on 8/29/2011. Click here.
View all notes |
Alert me of new notes |
CANSLIM.net Company Profile |
SEC |
Zacks Reports |
StockTalk |
News |
Chart |
Request a new note
C
A N
S L
I M
|
MA
-
NYSE
Mastercard Inc Cl A
DIVERSIFIED SERVICES - Business/Management Services
|
$323.00
|
+2.32
0.72% |
$323.32
|
1,226,816
80.10% of 50 DAV
50 DAV is 1,531,600
|
$340.42
-5.12%
|
8/3/2011
|
$324.82
|
PP = $322.38
|
|
MB = $338.50
|
Most Recent Note - 9/6/2011 4:17:02 PM
Y - Closed near the session high with a small gain after a positive reversal following today's gap down and early trading near its 50 DMA line. It has been quietly consolidating with volume totals cooling.
>>> The latest Featured Stock Update with an annotated graph appeared on 8/26/2011. Click here.
View all notes |
Alert me of new notes |
CANSLIM.net Company Profile |
SEC |
Zacks Reports |
StockTalk |
News |
Chart |
Request a new note
C
A N
S L
I M
|
MG
-
NYSE
Mistras Group Inc
DIVERSIFIED SERVICES - Bulding and Faci;ity Management Services
|
$19.38
|
+0.02
0.10% |
$19.45
|
185,149
112.35% of 50 DAV
50 DAV is 164,800
|
$20.82
-6.92%
|
8/10/2011
|
$17.89
|
PP = $17.58
|
|
MB = $18.46
|
Most Recent Note - 9/6/2011 4:18:36 PM
G - Finished near the high end of its intra-day range today with a small gain after a positive reversal. Previous resistance in the $17-18 area defines important chart support to watch on pullbacks.
>>> The latest Featured Stock Update with an annotated graph appeared on 8/24/2011. Click here.
View all notes |
Alert me of new notes |
CANSLIM.net Company Profile |
SEC |
Zacks Reports |
StockTalk |
News |
Chart |
Request a new note
C
A N
S L
I M
|
Symbol/Exchange
Company Name
Industry Group |
PRICE |
CHANGE
(%Change) |
Day High |
Volume
(% DAV)
(% 50 day avg vol) |
52 Wk Hi
% From Hi |
Featured
Date |
Price
Featured |
Pivot Featured |
|
Max Buy |
MKTX
-
NASDAQ
Marketaxess Holdings Inc
FINANCIAL SERVICES - Investment Brokerage - Nationa
|
$28.59
|
-0.33
-1.14% |
$28.78
|
266,196
108.17% of 50 DAV
50 DAV is 246,100
|
$30.95
-7.62%
|
7/29/2011
|
$25.87
|
PP = $26.35
|
|
MB = $27.67
|
Most Recent Note - 9/6/2011 4:20:38 PM
G - Finished near the session high today but with its 5th consecutive small loss since reaching its all-time high. It is still extended from its prior base, and its former resistance in the $25-26 area now defines chart support to watch.
>>> The latest Featured Stock Update with an annotated graph appeared on 9/2/2011. Click here.
View all notes |
Alert me of new notes |
CANSLIM.net Company Profile |
SEC |
Zacks Reports |
StockTalk |
News |
Chart |
Request a new note
C
A N
S L
I M
|
PSMT
-
NASDAQ
Pricesmart Inc
RETAIL - Drug Stores
|
$63.81
|
+1.00
1.59% |
$64.24
|
363,865
131.03% of 50 DAV
50 DAV is 277,700
|
$68.05
-6.23%
|
8/30/2011
|
$63.01
|
PP = $62.37
|
|
MB = $65.49
|
Most Recent Note - 9/6/2011 4:22:17 PM
Y - After a small gap down today it managed a positive reversal for a small gain with above average volume. Prior highs near $62 define chart support to watch. A subsequent close under its old high close ($61.54 on 8/03/11) would completely negate the recent technical breakout.
>>> The latest Featured Stock Update with an annotated graph appeared on 8/30/2011. Click here.
View all notes |
Alert me of new notes |
CANSLIM.net Company Profile |
SEC |
Zacks Reports |
StockTalk |
News |
Chart |
Request a new note
C
A N
S L
I M
|
|
|
|
THESE ARE NOT BUY RECOMMENDATIONS!
Comments contained in the body of this report are technical
opinions only. The material herein has been obtained
from sources believed to be reliable and accurate, however,
its accuracy and completeness cannot be guaranteed.
This site is not an investment advisor, hence it does
not endorse or recommend any securities or other investments.
Any recommendation contained in this report may not
be suitable for all investors and it is not to be deemed
an offer or solicitation on our part with respect to
the purchase or sale of any securities. All trademarks,
service marks and trade names appearing in this report
are the property of their respective owners, and are
likewise used for identification purposes only.
This report is a service available
only to active Paid Premium Members.
You may opt-out of receiving report notifications
at any time. Questions or comments may be submitted
by writing to Premium Membership Services 665 S.E. 10 Street, Suite 201 Deerfield Beach, FL 33441-5634 or by calling 1-800-965-8307
or 954-785-1121.
|
|
|

