You are not logged in.
This means you
CAN ONLY VIEW reports that were published prior to Monday, April 14, 2025.
You
MUST UPGRADE YOUR MEMBERSHIP if you want to see any current reports.
AFTER MARKET UPDATE - THURSDAY, SEPTEMBER 5TH, 2013
Previous After Market Report Next After Market Report >>>
|
|
|
|
DOW |
+6.61 |
14,937.48 |
+0.04% |
|
Volume |
630,016,840 |
-13% |
|
Volume |
1,506,073,880 |
-14% |
|
NASDAQ |
+9.74 |
3,658.78 |
+0.27% |
|
Advancers |
1,429 |
46% |
|
Advancers |
1,508 |
58% |
|
S&P 500 |
+2.00 |
1,655.08 |
+0.12% |
|
Decliners |
1,585 |
51% |
|
Decliners |
988 |
38% |
|
Russell 2000 |
+3.11 |
1,028.69 |
+0.30% |
|
52 Wk Highs |
93 |
|
|
52 Wk Highs |
119 |
|
|
S&P 600 |
+1.59 |
581.18 |
+0.27% |
|
52 Wk Lows |
49 |
|
|
52 Wk Lows |
21 |
|
|
 |
Major Averages Post Small Gains With Lighter Volume
Kenneth J. Gruneisen - Passed the CAN SLIM® Master's Exam
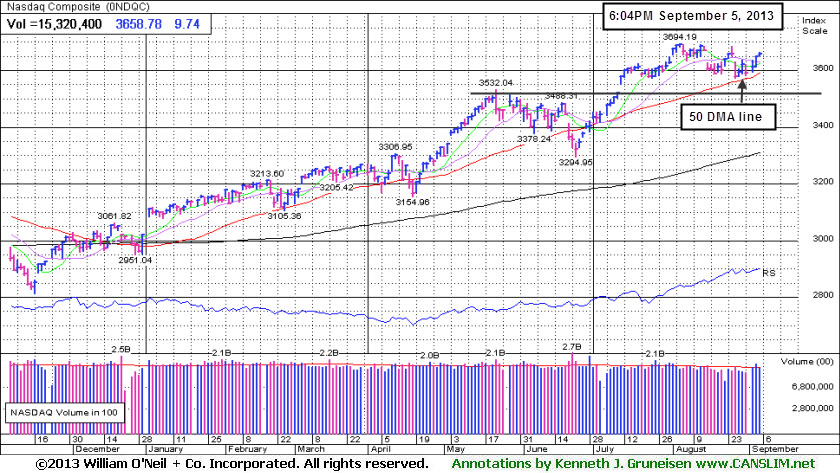
The major averages finished in positive territory for a third day. Thursday's volume totals were reported lighter than the prior session totals on the NYSE and on the Nasdaq exchange. Breadth was positive as advancers led decliners by a 3-2 margin on the Nasdaq exchange, however decliners slightly outnumbered advancers on the NYSE. There were 39 high-ranked companies from the CANSLIM.net Leaders List that made new 52-week highs and appeared on the CANSLIM.net BreakOuts Page, up from a total of 35 stocks on the prior session. The list of stocks hitting new 52-week highs outnumbered new lows on the NYSE and on the Nasdaq exchange. There were gains for 12 of the 17 high-ranked companies currently included on the Featured Stocks Page. The market (M criteria) is technically still in a "correction", and historic studies suggest that no new buying efforts should be made during market corrections. An ideal turning point to watch for would be a solid follow-through day of gains greater than +1.5% from at least one of the 3 major averages with higher volume totals and an expansion in leadership (new 52-week highs).
The major averages closed off of their session highs as investors grew cautious before Friday's jobs report. Non-farm payrolls are expected to expand by 180,000 in August with the unemployment rate holding steady at a four-year low of 7.4%. Ahead of the employment update, ADP's report showed that private sector hiring slowed in August and jobless claims fell more than anticipated last week. Separate reports revealed the ISM non-manufacturing index unexpectedly rose to a seven-year high and factory orders fell for the first time since March.
Overall, most sectors advanced, led by gains in Materials and Industrials. Dow Chemical Co (DOW +1.67%) and Fastenal Co (FAST +6.02%) rallied. The more defensive Telecommunications and Utilities sectors lagged behind as AT&T inc (T -1.19%) and Spectra Energy Corp (SE -0.82%) lost ground.
In fixed-income, Treasury prices fell for the fourth-straight session. The 10-year note was down 24/32 to yield 2.99% and the 30-year bond lost a full point and a half to yield 3.88%.
The Dow Jones Industrial Average and the S&P 500 Index both remain below their respective 50-day moving average lines. Subsequent rebounds above those short-term averages would be encouraging signs to watch for before one can truly consider those indices in "healthy" shape chart-wise.
Stay familiar with companies listed on the CANSLIM.net Featured Stocks Page - a page showing the most action-worthy candidates' latest notes and links to additional resources including detailed analysis with data-packed graphs which are annotated by a Certified expert. The Premium Member Homepage - includes "dynamic archives" to all prior pay reports published. Watch for an announcement via email concerning the next WEBCAST.
PICTURED: The Nasdaq Composite Index gained +0.27% on Day 6 of its rally attempt. A one day gain of +1.5% would be ideal to be considered a solid follow-through day. Meanwhile, losses must not undercut the indices' Day 1 lows, which would technically end the brief rally attempt and signal that the correction was worsening. Right now the index is still consolidating above its May highs and above its 50-day moving average (DMA) line. The 3 major averages should be trading above their respective 50-day moving average (DMA) lines to be considered in "healthy" technical shape. It is important to watch for a proper follow-through day (FTD) to signal convincingly that a solid rally is at hand before new buying efforts in stocks may be justified under the fact-based system. Patience and discipline remain paramount.
|
 Kenneth J. Gruneisen started out as a licensed stockbroker in August 1987, a couple of months prior to the historic stock market crash that took the Dow Jones Industrial Average down -22.6% in a single day. He has published daily fact-based fundamental and technical analysis on high-ranked stocks online for two decades. Through FACTBASEDINVESTING.COM, Kenneth provides educational articles, news, market commentary, and other information regarding proven investment systems that work in good times and bad.
Comments contained in the body of this report are technical opinions only and are not necessarily those of Gruneisen Growth Corp. The material herein has been obtained from sources believed to be reliable and accurate, however, its accuracy and completeness cannot be guaranteed. Our firm, employees, and customers may effect transactions, including transactions contrary to any recommendation herein, or have positions in the securities mentioned herein or options with respect thereto. Any recommendation contained in this report may not be suitable for all investors and it is not to be deemed an offer or solicitation on our part with respect to the purchase or sale of any securities. |
|
 |
Financial, Tech, Healthcare and Energy-Linked Groups Rose
Kenneth J. Gruneisen - Passed the CAN SLIM® Master's Exam
Financial shares were a positive influence on the major averages on Thursday as the Broker/Dealer Index ($XBD +0.65%) and the Bank Index ($BKX +0.73%) posted modest gains. The Semiconductor Index ($SOX +0.73%) led the tech sector higher while the Internet Index ($IIX +0.35%), Networking Index ($NWX +0.58%), and the Biotechnology Index ($BTK +0.60%) each posted a small gain. Defensive groups were mixed, as the Healthcare Index ($HMO +1.57%) rose, the Gold & Silver Index ($XAU -3.34%) was a standout dcliner and clear laggard on the mostly positive session. The Oil Services Index ($OSX +1.24%) ratcheted higher while the Integrated Oil Index ($XOI +0.13%) inched higher. The Retail Index ($RLX +0.09%) finished flat.
Charts courtesy www.stockcharts.com
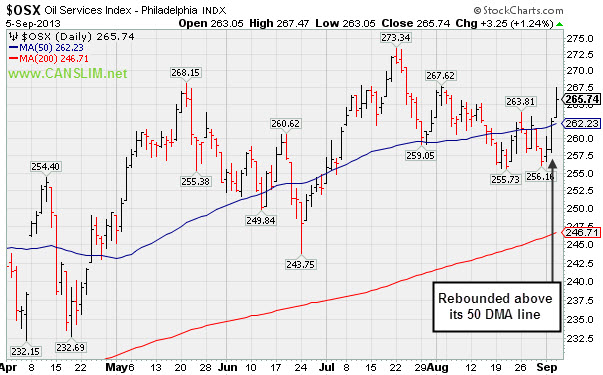
PICTURED: The Oil Services Index ($OSX +1.24%) rebounded above its 50-day moving average (DMA) line.
| Oil Services |
$OSX |
265.74 |
+3.25 |
+1.24% |
+20.70% |
| Healthcare |
$HMO |
3,490.17 |
+53.97 |
+1.57% |
+38.82% |
| Integrated Oil |
$XOI |
1,387.89 |
+1.85 |
+0.13% |
+11.76% |
| Semiconductor |
$SOX |
477.04 |
+3.48 |
+0.73% |
+24.21% |
| Networking |
$NWX |
291.59 |
+1.68 |
+0.58% |
+28.71% |
| Internet |
$IIX |
404.94 |
+1.40 |
+0.35% |
+23.84% |
| Broker/Dealer |
$XBD |
135.69 |
+0.87 |
+0.65% |
+43.85% |
| Retail |
$RLX |
821.62 |
+0.72 |
+0.09% |
+25.81% |
| Gold & Silver |
$XAU |
101.25 |
-3.50 |
-3.34% |
-38.86% |
| Bank |
$BKX |
63.40 |
+0.46 |
+0.73% |
+23.63% |
| Biotech |
$BTK |
2,156.91 |
+12.97 |
+0.60% |
+39.42% |
|
|
|
 |
New Base Formed While Finding Support at 50-Day Moving Average
Kenneth J. Gruneisen - Passed the CAN SLIM® Master's Exam
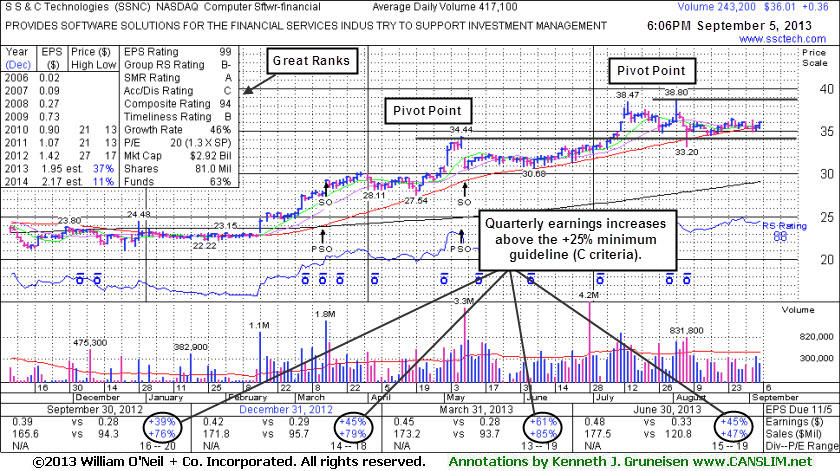
S S & C Technologies Holdings, Inc (SSNC +$0.36 or +1.01% to $36.01) is still quietly consolidating above its 50-day moving average (DMA) line and prior highs in the $34 area defining important support with volume totals cooling. A new pivot point has been cited based on its 8/02/13 high plus 10 cents. Subsequent volume-driven gains may trigger a new technical buy signal.
It was last shown in the FSU section on 8/09/13 with an annotated graph under the headline, "Finding Support Above Prior Highs and 50-Day Moving Average Line", as it rebounded and found prompt support after undercutting its 50-day moving average (DMA) and prior highs in the $34 area. Disciplined investors always limit losses if ever any stock falls more than -7% from their purchase price. Any stock which is sold can always be bought back again if strength returns, while limiting losses is critical to investors' success.
Its small supply of only 62.4 million shares in the publicly traded float can contribute to greater price volatility in the event of institutional buying or selling pressure. SSNC completed another Secondary Offering on 5/09/13, while it was previously noted in the 5/20/13 mid-day report - "The high-ranked Computer Software - Financial firm completed previously noted Secondary Offerings on 3/14/13 and on 7/19/12." New institutional owners are often attracted when a company has the help of underwriters in placing shares during offerings.
It has earned high ranks due to its strong earnings history. The past 5 quarterly comparisons through Jun '13 showed earnings increases above the +25% minimum guideline (C criteria) for buy candidates. Its annual earnings (A criteria) history has also been very strong. The number of top-rated funds owning its shares rose from 260 in Dec' 12 to 302 in Jun '13, a reassuring sign concerning the I criteria of the fact-based investment system. The Computer Software - Financial industry group currently has a B- Rating, and leadership among other individual issues in the group is a reassuring sign concerning the L criteria.
|
|
|
Color Codes Explained :
Y - Better candidates highlighted by our
staff of experts.
G - Previously featured
in past reports as yellow but may no longer be buyable under the
guidelines.
***Last / Change / Volume data in this table is the closing quote data***
Symbol/Exchange
Company Name
Industry Group |
PRICE |
CHANGE
(%Change) |
Day High |
Volume
(% DAV)
(% 50 day avg vol) |
52 Wk Hi
% From Hi |
Featured
Date |
Price
Featured |
Pivot Featured |
|
Max Buy |
BITA
-
NYSE
Bitauto Hldgs Ltd Ads
INTERNET - Internet Information Providers
|
$15.52
|
+1.58
11.33% |
$16.00
|
1,179,620
503.25% of 50 DAV
50 DAV is 234,400
|
$18.10
-14.25%
|
8/7/2013
|
$12.01
|
PP = $13.30
|
|
MB = $13.97
|
 Most Recent Note - 9/5/2013 12:11:59 PM
G - Considerable volume-driven gain today, rallying within close striking distance of its best-ever close. Found support above its 50 DMA line and prior highs.
>>> The latest Featured Stock Update with an annotated graph appeared on 9/3/2013. Click here.
View all notes |
Alert me of new notes |
CANSLIM.net Company Profile |
SEC |
Zacks Reports |
StockTalk |
News |
Chart |
Request a new note
C
A N
S L
I M


|
CELG
-
NASDAQ
Celgene Corp
DRUGS - Drug Manufacturers - Major
|
$145.59
|
-0.48
-0.33% |
$147.76
|
2,159,372
87.78% of 50 DAV
50 DAV is 2,460,100
|
$149.92
-2.89%
|
7/11/2013
|
$133.25
|
PP = $131.92
|
|
MB = $138.52
|
Most Recent Note - 9/4/2013 11:55:25 AM
Y - Building a base-on-base type pattern, it recently found support above prior highs in the $131 area and above its 50 DMA line, important chart support levels.
>>> The latest Featured Stock Update with an annotated graph appeared on 8/21/2013. Click here.
View all notes |
Alert me of new notes |
CANSLIM.net Company Profile |
SEC |
Zacks Reports |
StockTalk |
News |
Chart |
Request a new note
C
A N
S L
I M
|
FLT
-
NYSE
Fleetcor Technologies
DIVERSIFIED SERVICES - Business/Management Services
|
$104.01
|
+0.02
0.02% |
$105.21
|
463,102
74.78% of 50 DAV
50 DAV is 619,300
|
$108.38
-4.03%
|
8/19/2013
|
$99.01
|
PP = $100.97
|
|
MB = $106.02
|
Most Recent Note - 9/3/2013 9:36:46 PM
Y- Gain on light volume today for a best-ever close. Rising from an advanced "3-weeks tight" base, albeit a riskier "late stage" base. Keep in mind the M criteria argues against new buying efforts until a new confirmed rally.
>>> The latest Featured Stock Update with an annotated graph appeared on 8/12/2013. Click here.
View all notes |
Alert me of new notes |
CANSLIM.net Company Profile |
SEC |
Zacks Reports |
StockTalk |
News |
Chart |
Request a new note
C
A N
S L
I M
|
GNRC
-
NYSE
Generac Hldgs Inc
CONSUMER DURABLES - Electronic Equipment
|
$40.29
|
+0.34
0.85% |
$40.39
|
383,337
39.88% of 50 DAV
50 DAV is 961,300
|
$44.30
-9.05%
|
7/30/2013
|
$42.60
|
PP = $42.10
|
|
MB = $44.21
|
Most Recent Note - 9/5/2013 6:51:21 PM
G - Lingering below its 50 DMA line, its color code is changed to green as deterioration raised concerns. Stalled after a recent rally from an advanced "3-weeks tight" base as it priced a Secondary Offering. Disciplined investors always limit losses by selling if any stock falls more than -7% from its purchase price.
>>> The latest Featured Stock Update with an annotated graph appeared on 8/22/2013. Click here.
View all notes |
Alert me of new notes |
CANSLIM.net Company Profile |
SEC |
Zacks Reports |
StockTalk |
News |
Chart |
Request a new note
C
A N
S L
I M
|
KORS
-
NYSE
Michael Kors Hldgs Ltd
RETAIL - Apparel Stores
|
$75.84
|
+0.44
0.58% |
$76.22
|
2,343,881
65.83% of 50 DAV
50 DAV is 3,560,300
|
$75.92
-0.11%
|
8/6/2013
|
$69.66
|
PP = $66.28
|
|
MB = $69.59
|
Most Recent Note - 9/5/2013 6:52:31 PM
G - Finished at another new high close today with its 6th consecutive gain, getting very extended from any sound base. Prior highs in the $66 area define initial support to watch on pullbacks.
>>> The latest Featured Stock Update with an annotated graph appeared on 8/29/2013. Click here.
View all notes |
Alert me of new notes |
CANSLIM.net Company Profile |
SEC |
Zacks Reports |
StockTalk |
News |
Chart |
Request a new note
C
A N
S L
I M
|
Symbol/Exchange
Company Name
Industry Group |
PRICE |
CHANGE
(%Change) |
Day High |
Volume
(% DAV)
(% 50 day avg vol) |
52 Wk Hi
% From Hi |
Featured
Date |
Price
Featured |
Pivot Featured |
|
Max Buy |
LOPE
-
NASDAQ
Grand Canyon Education
DIVERSIFIED SERVICES - Education and; Training Services
|
$36.14
|
+0.16
0.44% |
$36.29
|
238,995
55.57% of 50 DAV
50 DAV is 430,100
|
$37.17
-2.77%
|
6/19/2013
|
$31.47
|
PP = $34.17
|
|
MB = $35.88
|
Most Recent Note - 9/5/2013 6:53:55 PM
G - Rose to a best-ever close today and inched nearer to its 52-week high with another gain on light volume. Earnings +15% on +19% sales for the Jun '13 quarter, below the +25% minimum earnings guideline (C criteria), raised fundamental concerns, yet technical action has been somewhat reassuring.
>>> The latest Featured Stock Update with an annotated graph appeared on 8/14/2013. Click here.
View all notes |
Alert me of new notes |
CANSLIM.net Company Profile |
SEC |
Zacks Reports |
StockTalk |
News |
Chart |
Request a new note
C
A N
S L
I M
|
PCLN
-
NASDAQ
Priceline.Com Inc
INTERNET - Internet Software and Services
|
$957.80
|
+5.35
0.56% |
$962.96
|
317,384
48.74% of 50 DAV
50 DAV is 651,200
|
$994.98
-3.74%
|
7/8/2013
|
$878.28
|
PP = $847.43
|
|
MB = $889.80
|
Most Recent Note - 8/30/2013 4:48:13 PM
G - Consolidating above prior highs with volume totals cooling, extended from any sound base. Reported earnings +24% on +27% sales revenues for the Jun '13 quarter, just under the +25% minimum earnings guideline (C criteria).
>>> The latest Featured Stock Update with an annotated graph appeared on 8/19/2013. Click here.
View all notes |
Alert me of new notes |
CANSLIM.net Company Profile |
SEC |
Zacks Reports |
StockTalk |
News |
Chart |
Request a new note
C
A N
S L
I M
|
PRAA
-
NASDAQ
Portfolio Recovery Assoc
DIVERSIFIED SERVICES - Business/Management Services
|
$56.14
|
+0.94
1.70% |
$56.64
|
760,761
145.13% of 50 DAV
50 DAV is 524,200
|
$57.57
-2.48%
|
7/31/2013
|
$51.43
|
PP = $54.72
|
|
MB = $57.46
|
Most Recent Note - 9/4/2013 1:18:10 PM
Y - Rebounding after a slump below its old high close ($53.86 on 6/17/13) led to a close back in the prior base which raised concerns. Halted its slide above important support at its 50 DMA line.
>>> The latest Featured Stock Update with an annotated graph appeared on 8/28/2013. Click here.
View all notes |
Alert me of new notes |
CANSLIM.net Company Profile |
SEC |
Zacks Reports |
StockTalk |
News |
Chart |
Request a new note
C
A N
S L
I M
|
PRLB
-
NYSE
Proto Labs Inc
MANUFACTURING - Small Tools and Accessories
|
$72.94
|
-1.76
-2.36% |
$74.65
|
346,301
78.97% of 50 DAV
50 DAV is 438,500
|
$75.76
-3.72%
|
7/29/2013
|
$64.86
|
PP = $67.50
|
|
MB = $70.88
|
Most Recent Note - 9/4/2013 11:58:42 AM
G - Hitting a new high and rallying beyond its "max buy" level, its color code is changed to green. Found support at its 50 DMA line.
>>> The latest Featured Stock Update with an annotated graph appeared on 8/27/2013. Click here.
View all notes |
Alert me of new notes |
CANSLIM.net Company Profile |
SEC |
Zacks Reports |
StockTalk |
News |
Chart |
Request a new note
C
A N
S L
I M
|
QCOR
-
NASDAQ
Questcor Pharmaceuticals
DRUGS - Biotechnology
|
$66.78
|
-0.40
-0.60% |
$67.69
|
1,041,916
61.62% of 50 DAV
50 DAV is 1,691,000
|
$74.76
-10.67%
|
7/31/2013
|
$66.46
|
PP = $59.01
|
|
MB = $61.96
|
Most Recent Note - 8/30/2013 7:17:20 PM
G - Encountered mild distributional pressure with a loss on higher (near average) volume amid a widely negative market (M criteria). It is extended beyond its "max buy" level.
>>> The latest Featured Stock Update with an annotated graph appeared on 8/26/2013. Click here.
View all notes |
Alert me of new notes |
CANSLIM.net Company Profile |
SEC |
Zacks Reports |
StockTalk |
News |
Chart |
Request a new note
C
A N
S L
I M
|
Symbol/Exchange
Company Name
Industry Group |
PRICE |
CHANGE
(%Change) |
Day High |
Volume
(% DAV)
(% 50 day avg vol) |
52 Wk Hi
% From Hi |
Featured
Date |
Price
Featured |
Pivot Featured |
|
Max Buy |
SFUN
-
NYSE
Soufun Hldgs Ltd Ads A
INTERNET - Internet Information Providers
|
$50.91
|
+0.84
1.68% |
$50.95
|
1,072,145
157.37% of 50 DAV
50 DAV is 681,300
|
$50.48
0.85%
|
7/16/2013
|
$29.54
|
PP = $27.90
|
|
MB = $29.30
|
Most Recent Note - 9/5/2013 12:48:43 PM
G - Perched at its all-time high today following a streak of 5 consecutive gains with ever-increasing volume. Very extended from any sound base. Recent highs near $42 define initial support to watch on pullbacks.
>>> The latest Featured Stock Update with an annotated graph appeared on 8/30/2013. Click here.
View all notes |
Alert me of new notes |
CANSLIM.net Company Profile |
SEC |
Zacks Reports |
StockTalk |
News |
Chart |
Request a new note
C
A N
S L
I M
|
SSNC
-
NASDAQ
S S & C Technologies
COMPUTER SOFTWARE and SERVICES - Application Software
|
$36.01
|
+0.36
1.01% |
$36.13
|
248,374
59.55% of 50 DAV
50 DAV is 417,100
|
$38.80
-7.19%
|
9/5/2013
|
$36.01
|
PP = $38.90
|
|
MB = $40.85
|
Most Recent Note - 9/5/2013 6:49:32 PM
Y - New pivot point cited based on its 8/02/13 high plus 10 cents. Subsequent volume-driven gains may trigger a new buy signal. See the latest FSU analysis for more details and a new annotated graph.
>>> The latest Featured Stock Update with an annotated graph appeared on 9/5/2013. Click here.
View all notes |
Alert me of new notes |
CANSLIM.net Company Profile |
SEC |
Zacks Reports |
StockTalk |
News |
Chart |
Request a new note
C
A N
S L
I M
|
SSYS
-
NASDAQ
Stratasys Ltd
COMPUTER HARDWARE - Computer Peripherals
|
$107.06
|
-0.39
-0.36% |
$109.79
|
587,698
68.99% of 50 DAV
50 DAV is 851,800
|
$113.49
-5.66%
|
7/8/2013
|
$91.44
|
PP = $95.00
|
|
MB = $99.75
|
Most Recent Note - 9/4/2013 1:07:15 PM
G - Pulling back today from its all-time high. Repeatedly noted - "Extended from its prior base. Prior highs in the $96 area define initial support to watch on pullbacks."
>>> The latest Featured Stock Update with an annotated graph appeared on 8/16/2013. Click here.
View all notes |
Alert me of new notes |
CANSLIM.net Company Profile |
SEC |
Zacks Reports |
StockTalk |
News |
Chart |
Request a new note
C
A N
S L
I M
|
STMP
-
NASDAQ
Stamps.Com Inc
INTERNET - Internet Software and Services
|
$43.91
|
+0.79
1.83% |
$44.22
|
59,413
45.01% of 50 DAV
50 DAV is 132,000
|
$46.47
-5.51%
|
7/31/2013
|
$40.00
|
PP = $42.98
|
|
MB = $45.13
|
Most Recent Note - 8/30/2013 7:03:50 PM
Y - Posted a 3rd consecutive gain today against a mostly negative market backdrop (M criteria). Recently found encouraging support at its 50 DMA line.
>>> The latest Featured Stock Update with an annotated graph appeared on 8/23/2013. Click here.
View all notes |
Alert me of new notes |
CANSLIM.net Company Profile |
SEC |
Zacks Reports |
StockTalk |
News |
Chart |
Request a new note
C
A N
S L
I M
|
TBBK
-
NASDAQ
Bancorp Inc
BANKING - Regional - Mid-Atlantic Banks
|
$17.02
|
+0.62
3.78% |
$17.24
|
417,270
297.84% of 50 DAV
50 DAV is 140,100
|
$16.69
1.98%
|
9/4/2013
|
$16.26
|
PP = $16.79
|
|
MB = $17.63
|
Most Recent Note - 9/5/2013 12:53:49 PM
Y - Hitting new 52-week highs with today's 6th consecutive gain, rising from an 8-week base. Making its 2nd consecutive mid-day report appearance highlighted in yellow with pivot point cited based on its 7/17/13 high plus 10 cents. Reported +25% earnings for the Jun '13 quarter. Quarterly earnings increases above the +25% guideline satisfy the C criteria. Its annual earnings (A criteria) history has been steadily improving after an abrupt downturn and loss in FY '08. Completed a new Public Offering on 12/18/12. See latest FSU analysis for more details and a new annotated graph.
>>> The latest Featured Stock Update with an annotated graph appeared on 9/4/2013. Click here.
View all notes |
Alert me of new notes |
CANSLIM.net Company Profile |
SEC |
Zacks Reports |
StockTalk |
News |
Chart |
Request a new note
C
A N
S L
I M
|
Symbol/Exchange
Company Name
Industry Group |
PRICE |
CHANGE
(%Change) |
Day High |
Volume
(% DAV)
(% 50 day avg vol) |
52 Wk Hi
% From Hi |
Featured
Date |
Price
Featured |
Pivot Featured |
|
Max Buy |
VRX
-
NYSE
Valeant Pharmaceuticals
DRUGS - Drug Manufacturers - Other
|
$99.80
|
-0.14
-0.14% |
$100.02
|
790,877
59.33% of 50 DAV
50 DAV is 1,333,000
|
$105.40
-5.31%
|
4/30/2013
|
$60.24
|
PP = $76.66
|
|
MB = $80.49
|
Most Recent Note - 9/4/2013 6:22:29 PM
G- Holding its ground -5.2% off its 52-week high and recent insider buying while trading near its highs has been noted as an encouraging sign. Reported earnings +33% on +34% sales revenues for the Jun '13 quarter, above the +25% minimum earnings guideline (C criteria).
>>> The latest Featured Stock Update with an annotated graph appeared on 8/15/2013. Click here.
View all notes |
Alert me of new notes |
CANSLIM.net Company Profile |
SEC |
Zacks Reports |
StockTalk |
News |
Chart |
Request a new note
C
A N
S L
I M
|
YNDX
-
NASDAQ
Yandex N V Class A
INTERNET - Internet Information Providers
|
$34.67
|
+1.69
5.12% |
$35.24
|
5,097,144
215.25% of 50 DAV
50 DAV is 2,368,000
|
$34.79
-0.34%
|
9/5/2013
|
$34.24
|
PP = $34.79
|
|
MB = $36.53
|
Most Recent Note - 9/5/2013 1:01:54 PM
Y - Poised for a best-ever close with today's 3rd consecutive gain after finding support above its 50 DMA line, important near-term support to watch. It did not form a base of sufficient length, however its color code is changed to yellow while a valid secondary buy point exists up to +5% above its prior high.
>>> The latest Featured Stock Update with an annotated graph appeared on 8/20/2013. Click here.
View all notes |
Alert me of new notes |
CANSLIM.net Company Profile |
SEC |
Zacks Reports |
StockTalk |
News |
Chart |
Request a new note
C
A N
S L
I M
|
|
|
|
THESE ARE NOT BUY RECOMMENDATIONS!
Comments contained in the body of this report are technical
opinions only. The material herein has been obtained
from sources believed to be reliable and accurate, however,
its accuracy and completeness cannot be guaranteed.
This site is not an investment advisor, hence it does
not endorse or recommend any securities or other investments.
Any recommendation contained in this report may not
be suitable for all investors and it is not to be deemed
an offer or solicitation on our part with respect to
the purchase or sale of any securities. All trademarks,
service marks and trade names appearing in this report
are the property of their respective owners, and are
likewise used for identification purposes only.
This report is a service available
only to active Paid Premium Members.
You may opt-out of receiving report notifications
at any time. Questions or comments may be submitted
by writing to Premium Membership Services 665 S.E. 10 Street, Suite 201 Deerfield Beach, FL 33441-5634 or by calling 1-800-965-8307
or 954-785-1121.
|
|
|

