You are not logged in.
This means you
CAN ONLY VIEW reports that were published prior to Wednesday, April 9, 2025.
You
MUST UPGRADE YOUR MEMBERSHIP if you want to see any current reports.
AFTER MARKET UPDATE - FRIDAY, SEPTEMBER 6TH, 2013
Previous After Market Report Next After Market Report >>>
|
|
|
|
DOW |
-14.98 |
14,922.50 |
-0.10% |
|
Volume |
671,664,370 |
+7% |
|
Volume |
1,666,075,820 |
+11% |
|
NASDAQ |
+1.23 |
3,660.01 |
+0.03% |
|
Advancers |
1,714 |
55% |
|
Advancers |
1,211 |
46% |
|
S&P 500 |
+0.09 |
1,655.17 |
+0.01% |
|
Decliners |
1,254 |
41% |
|
Decliners |
1,300 |
50% |
|
Russell 2000 |
+0.86 |
1,029.55 |
+0.08% |
|
52 Wk Highs |
105 |
|
|
52 Wk Highs |
101 |
|
|
S&P 600 |
+0.19 |
581.37 |
+0.03% |
|
52 Wk Lows |
38 |
|
|
52 Wk Lows |
18 |
|
|
 |
Major Averages Closed Shortened Trading Week With Gains
Kenneth J. Gruneisen - Passed the CAN SLIM® Master's Exam
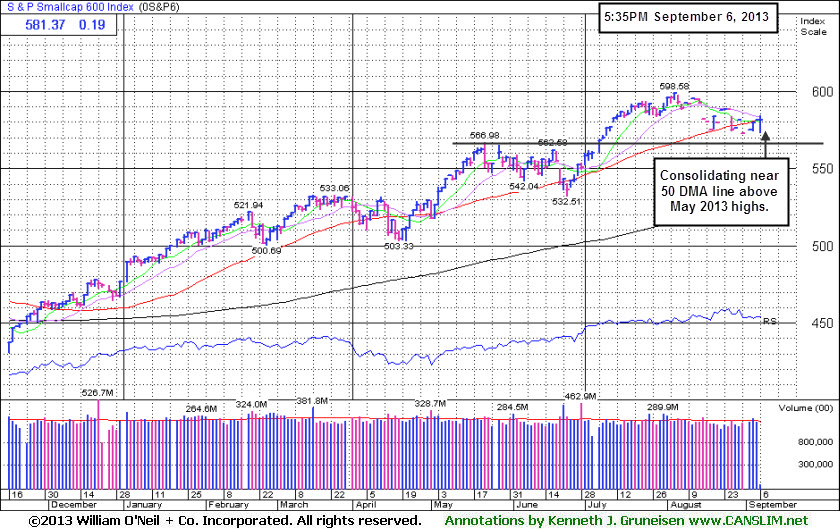
For the shortened trading week, the Dow Jones Industrial Average gained +0.8%, the S&P 500 Index was up +1.4% and the Nasdaq Composite Index advanced +1.9%. The major averages finished little changed on Friday's session. The volume totals were reported slightly higher than the prior session totals on the NYSE and on the Nasdaq exchange. Breadth was positive as advancers led decliners by nearly a 3-2 margin on the NYSE, however decliners slightly outnumbered advancers on the Nasdaq exchange. There were 37 high-ranked companies from the CANSLIM.net Leaders List that made new 52-week highs and appeared on the CANSLIM.net BreakOuts Page, down from a total of 39 stocks on the prior session. The list of stocks hitting new 52-week highs outnumbered new lows on the NYSE and on the Nasdaq exchange. There were gains for 7 of the 17 high-ranked companies currently included on the Featured Stocks Page. The market (M criteria) is technically still in a "correction", and historic studies suggest that no new buying efforts should be made during market corrections. An ideal turning point to watch for would be a solid follow-through day of gains greater than +1.5% from at least one of the 3 major averages with higher volume totals and an expansion in leadership (new 52-week highs).
Stocks ended a choppy trading session mixed as investors digested a disappointing jobs report amid ongoing tension over Syria. Utilities were the best performing sector in the S&P as Edison International (EIX +1.53%) was among the solid gainers. Industrials were the worst performing group as FedEx Corp (FDX -0.68%) edged lower. On the earnings front, VeriFone Systems Inc (PAY +10.09%) rallied after the company posted quarterly results. Ford Motor Co (F -1.63%) fell, despite Standard & Poor's raising the company's debt rating back to investment grade for the first time since 2006.
Turning to fixed income, Treasuries ended higher along the curve. The benchmark 10-year note was up 15/32 to yield 2.93% and the 30-year bond added 13/32 to yield 3.87%.
The Dow Jones Industrial Average and the S&P 500 Index both remain below their respective 50-day moving average lines. Subsequent rebounds above those short-term averages would be encouraging signs to watch for before one can truly consider those indices in "healthy" shape chart-wise. After Day 7 of the current rally attempt the major averages have not yet produced a follow-through day. A one day gain of +1.5% would be ideal to be considered a solid follow-through day. Meanwhile, losses must not undercut the indices' Day 1 lows, which would technically end the brief rally attempt and signal that the correction is worsening.
The 3 major averages should be trading above their respective 50-day moving average (DMA) lines to be considered in "healthy" technical shape. It is important to watch for a proper follow-through day (FTD) to signal convincingly that a solid rally is at hand before new buying efforts in stocks may be justified under the fact-based system. Patience and discipline remain paramount.
Stay familiar with companies listed on the CANSLIM.net Featured Stocks Page - a page showing the most action-worthy candidates' latest notes and links to additional resources including detailed analysis with data-packed graphs which are annotated by a Certified expert. The Premium Member Homepage - includes "dynamic archives" to all prior pay reports published. Watch for an announcement via email concerning the next WEBCAST.
PICTURED: The S&P Small Cap 600 Index is consolidating near its 50-day moving average line and above its May 2013 highs.
|
 Kenneth J. Gruneisen started out as a licensed stockbroker in August 1987, a couple of months prior to the historic stock market crash that took the Dow Jones Industrial Average down -22.6% in a single day. He has published daily fact-based fundamental and technical analysis on high-ranked stocks online for two decades. Through FACTBASEDINVESTING.COM, Kenneth provides educational articles, news, market commentary, and other information regarding proven investment systems that work in good times and bad.
Comments contained in the body of this report are technical opinions only and are not necessarily those of Gruneisen Growth Corp. The material herein has been obtained from sources believed to be reliable and accurate, however, its accuracy and completeness cannot be guaranteed. Our firm, employees, and customers may effect transactions, including transactions contrary to any recommendation herein, or have positions in the securities mentioned herein or options with respect thereto. Any recommendation contained in this report may not be suitable for all investors and it is not to be deemed an offer or solicitation on our part with respect to the purchase or sale of any securities. |
|
 |
Mixed Group Action While Correction Continues
Kenneth J. Gruneisen - Passed the CAN SLIM® Master's Exam
Defensive groups were mixed as the Gold & Silver Index ($XAU +1.74%) rallied while the Healthcare Index ($HMO -0.41%) edged lower. The tech sector saw small gains from the Biotechnology Index ($BTK +0.13%), Networking Index ($NWX +0.25%), and the Internet Index ($IIX +0.30%) while Semiconductor Index ($SOX -0.41%) lagged and lost ground. Financial shares were mixed as the Bank Index ($BKX -0.38%) edged lower while the Broker/Dealer Index ($XBD +0.43%) rose. The Retail Index ($RLX -0.28%) suffered a small loss. The Oil Services Index ($OSX +0.63%) posted a modest gain while the Integrated Oil Index ($XOI +0.10%) ended just above unchanged.
Charts courtesy www.stockcharts.com
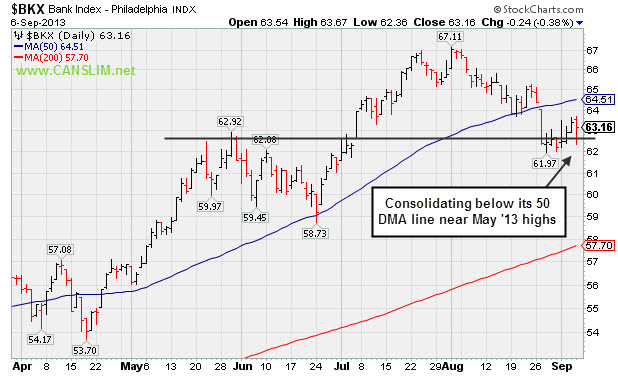
PICTURED: The Bank Index ($BKX -0.38%) is consolidating below its 50-day moving average (DMA) line near its May 2013 highs.
| Oil Services |
$OSX |
267.41 |
+1.67 |
+0.63% |
+21.46% |
| Healthcare |
$HMO |
3,475.75 |
-14.42 |
-0.41% |
+38.25% |
| Integrated Oil |
$XOI |
1,389.21 |
+1.32 |
+0.10% |
+11.87% |
| Semiconductor |
$SOX |
475.10 |
-1.94 |
-0.41% |
+23.70% |
| Networking |
$NWX |
292.30 |
+0.72 |
+0.25% |
+29.02% |
| Internet |
$IIX |
406.14 |
+1.20 |
+0.30% |
+24.20% |
| Broker/Dealer |
$XBD |
136.27 |
+0.58 |
+0.43% |
+44.46% |
| Retail |
$RLX |
819.34 |
-2.28 |
-0.28% |
+25.46% |
| Gold & Silver |
$XAU |
103.01 |
+1.76 |
+1.74% |
-37.80% |
| Bank |
$BKX |
63.16 |
-0.24 |
-0.38% |
+23.17% |
| Biotech |
$BTK |
2,159.62 |
+2.71 |
+0.13% |
+39.60% |
|
|
|
 |
Holding Ground Following Latest Volume Driven Gains
Kenneth J. Gruneisen - Passed the CAN SLIM® Master's Exam
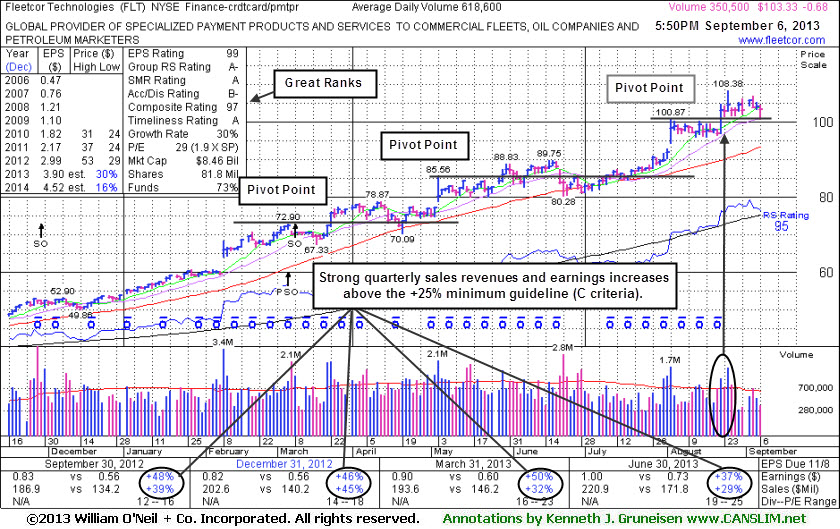
FleetCor Technologies, Inc. (FLT -$0.68 or -0.65% to $103.33) is consolidating above prior highs with light volume totals. It is perched at all-time highs. No resistance remains due to overhead supply. It recently rose with volume-driven gains from an advanced "3-weeks tight" base, albeit a riskier "late stage" base. Keep in mind the M criteria argues against new buying efforts until a new confirmed rally. It was last shown in this FSU section on 8/12/13 with an annotated graph under the headline, "Holding Ground Following Volume-Driven Gains From Late-Stage Base".
Disciplined investors avoid chasing stocks extended more than +5% above their pivot point or prior highs and always limit losses by selling any stock that falls more than -7% from their purchase price. Volume totals have been cooling after spiking higher with gains backed by above average volume.
It reported earnings +37% on +29% sales for the Jun '13 quarter, marking its 6th consecutive quarterly comparison with earnings above the +25% guideline (C criteria). The company completed another Secondary Offering on 3/08/13 after a streak of volume-driven gains into new high territory. On 3/14/12, 6/11/12, and 11/29/12 it priced Secondary Offerings and it was previously noted, "Such offerings often are a short-term hindrance to upward price progress yet typically result in broader institutional ownership interest."
The number of top-rated funds owning its shares rose from 193 in Mar '12 to 427 in Jun '13, a reassuring sign concerning the I criteria. The company hails from the Finance - Credit Card Payment Processing group which improved to a 79 Group Relative Strength Rating from a 55 rating when shown in the FSU section on 7/18/13. Impressive strength and leadership from a couple of other firms in the same industry group is also considered a reassurance concerning the L criteria.
|
|
|
Color Codes Explained :
Y - Better candidates highlighted by our
staff of experts.
G - Previously featured
in past reports as yellow but may no longer be buyable under the
guidelines.
***Last / Change / Volume data in this table is the closing quote data***
Symbol/Exchange
Company Name
Industry Group |
PRICE |
CHANGE
(%Change) |
Day High |
Volume
(% DAV)
(% 50 day avg vol) |
52 Wk Hi
% From Hi |
Featured
Date |
Price
Featured |
Pivot Featured |
|
Max Buy |
BITA
-
NYSE
Bitauto Hldgs Ltd Ads
INTERNET - Internet Information Providers
|
$15.56
|
+0.04
0.26% |
$16.58
|
969,136
376.95% of 50 DAV
50 DAV is 257,100
|
$18.10
-14.03%
|
8/7/2013
|
$12.01
|
PP = $13.30
|
|
MB = $13.97
|
 Most Recent Note - 9/6/2013 6:24:05 PM
G - Churned heavy volume today while encountering resistance after rallying within close striking distance of its best-ever close. Found support above its 50 DMA line and prior highs.
>>> The latest Featured Stock Update with an annotated graph appeared on 9/3/2013. Click here.
View all notes |
Alert me of new notes |
CANSLIM.net Company Profile |
SEC |
Zacks Reports |
StockTalk |
News |
Chart |
Request a new note
C
A N
S L
I M


|
CELG
-
NASDAQ
Celgene Corp
DRUGS - Drug Manufacturers - Major
|
$146.97
|
+1.38
0.95% |
$148.39
|
3,221,416
130.89% of 50 DAV
50 DAV is 2,461,200
|
$149.92
-1.97%
|
7/11/2013
|
$133.25
|
PP = $131.92
|
|
MB = $138.52
|
Most Recent Note - 9/4/2013 11:55:25 AM
Y - Building a base-on-base type pattern, it recently found support above prior highs in the $131 area and above its 50 DMA line, important chart support levels.
>>> The latest Featured Stock Update with an annotated graph appeared on 8/21/2013. Click here.
View all notes |
Alert me of new notes |
CANSLIM.net Company Profile |
SEC |
Zacks Reports |
StockTalk |
News |
Chart |
Request a new note
C
A N
S L
I M
|
FLT
-
NYSE
Fleetcor Technologies
DIVERSIFIED SERVICES - Business/Management Services
|
$103.33
|
-0.68
-0.65% |
$104.54
|
353,137
57.09% of 50 DAV
50 DAV is 618,600
|
$108.38
-4.66%
|
8/19/2013
|
$99.01
|
PP = $100.97
|
|
MB = $106.02
|
Most Recent Note - 9/6/2013 6:22:32 PM
Y- Consolidating above prior highs after recently rising from an advanced "3-weeks tight" base, albeit a riskier "late stage" base. See the latest FSU analysis for more details and a new annotated graph. Keep in mind the M criteria argues against new buying efforts until a new confirmed rally.
>>> The latest Featured Stock Update with an annotated graph appeared on 9/6/2013. Click here.
View all notes |
Alert me of new notes |
CANSLIM.net Company Profile |
SEC |
Zacks Reports |
StockTalk |
News |
Chart |
Request a new note
C
A N
S L
I M
|
GNRC
-
NYSE
Generac Hldgs Inc
CONSUMER DURABLES - Electronic Equipment
|
$39.69
|
-0.60
-1.49% |
$40.61
|
661,228
70.33% of 50 DAV
50 DAV is 940,200
|
$44.30
-10.41%
|
7/30/2013
|
$42.60
|
PP = $42.10
|
|
MB = $44.21
|
Most Recent Note - 9/5/2013 6:51:21 PM
G - Lingering below its 50 DMA line, its color code is changed to green as deterioration raised concerns. Stalled after a recent rally from an advanced "3-weeks tight" base as it priced a Secondary Offering. Disciplined investors always limit losses by selling if any stock falls more than -7% from its purchase price.
>>> The latest Featured Stock Update with an annotated graph appeared on 8/22/2013. Click here.
View all notes |
Alert me of new notes |
CANSLIM.net Company Profile |
SEC |
Zacks Reports |
StockTalk |
News |
Chart |
Request a new note
C
A N
S L
I M
|
KORS
-
NYSE
Michael Kors Hldgs Ltd
RETAIL - Apparel Stores
|
$75.70
|
-0.14
-0.18% |
$76.20
|
3,453,337
97.71% of 50 DAV
50 DAV is 3,534,400
|
$76.22
-0.68%
|
8/6/2013
|
$69.66
|
PP = $66.28
|
|
MB = $69.59
|
Most Recent Note - 9/5/2013 6:52:31 PM
G - Finished at another new high close today with its 6th consecutive gain, getting very extended from any sound base. Prior highs in the $66 area define initial support to watch on pullbacks.
>>> The latest Featured Stock Update with an annotated graph appeared on 8/29/2013. Click here.
View all notes |
Alert me of new notes |
CANSLIM.net Company Profile |
SEC |
Zacks Reports |
StockTalk |
News |
Chart |
Request a new note
C
A N
S L
I M
|
Symbol/Exchange
Company Name
Industry Group |
PRICE |
CHANGE
(%Change) |
Day High |
Volume
(% DAV)
(% 50 day avg vol) |
52 Wk Hi
% From Hi |
Featured
Date |
Price
Featured |
Pivot Featured |
|
Max Buy |
LOPE
-
NASDAQ
Grand Canyon Education
DIVERSIFIED SERVICES - Education and; Training Services
|
$35.51
|
-0.63
-1.74% |
$36.31
|
329,210
78.07% of 50 DAV
50 DAV is 421,700
|
$37.17
-4.47%
|
6/19/2013
|
$31.47
|
PP = $34.17
|
|
MB = $35.88
|
Most Recent Note - 9/5/2013 6:53:55 PM
G - Rose to a best-ever close today and inched nearer to its 52-week high with another gain on light volume. Earnings +15% on +19% sales for the Jun '13 quarter, below the +25% minimum earnings guideline (C criteria), raised fundamental concerns, yet technical action has been somewhat reassuring.
>>> The latest Featured Stock Update with an annotated graph appeared on 8/14/2013. Click here.
View all notes |
Alert me of new notes |
CANSLIM.net Company Profile |
SEC |
Zacks Reports |
StockTalk |
News |
Chart |
Request a new note
C
A N
S L
I M
|
PCLN
-
NASDAQ
Priceline.Com Inc
INTERNET - Internet Software and Services
|
$959.15
|
+1.35
0.14% |
$965.00
|
591,925
91.33% of 50 DAV
50 DAV is 648,100
|
$994.98
-3.60%
|
7/8/2013
|
$878.28
|
PP = $847.43
|
|
MB = $889.80
|
Most Recent Note - 9/6/2013 6:15:20 PM
G - Consolidating in an orderly fashion above prior highs, building a new base. Reported earnings +24% on +27% sales revenues for the Jun '13 quarter, just under the +25% minimum earnings guideline (C criteria).
>>> The latest Featured Stock Update with an annotated graph appeared on 8/19/2013. Click here.
View all notes |
Alert me of new notes |
CANSLIM.net Company Profile |
SEC |
Zacks Reports |
StockTalk |
News |
Chart |
Request a new note
C
A N
S L
I M
|
PRAA
-
NASDAQ
Portfolio Recovery Assoc
DIVERSIFIED SERVICES - Business/Management Services
|
$56.69
|
+0.55
0.98% |
$56.94
|
689,894
129.17% of 50 DAV
50 DAV is 534,100
|
$57.57
-1.53%
|
7/31/2013
|
$51.43
|
PP = $54.72
|
|
MB = $57.46
|
Most Recent Note - 9/4/2013 1:18:10 PM
Y - Rebounding after a slump below its old high close ($53.86 on 6/17/13) led to a close back in the prior base which raised concerns. Halted its slide above important support at its 50 DMA line.
>>> The latest Featured Stock Update with an annotated graph appeared on 8/28/2013. Click here.
View all notes |
Alert me of new notes |
CANSLIM.net Company Profile |
SEC |
Zacks Reports |
StockTalk |
News |
Chart |
Request a new note
C
A N
S L
I M
|
PRLB
-
NYSE
Proto Labs Inc
MANUFACTURING - Small Tools and Accessories
|
$72.40
|
-0.54
-0.74% |
$73.45
|
296,712
68.89% of 50 DAV
50 DAV is 430,700
|
$75.76
-4.44%
|
7/29/2013
|
$64.86
|
PP = $67.50
|
|
MB = $70.88
|
Most Recent Note - 9/4/2013 11:58:42 AM
G - Hitting a new high and rallying beyond its "max buy" level, its color code is changed to green. Found support at its 50 DMA line.
>>> The latest Featured Stock Update with an annotated graph appeared on 8/27/2013. Click here.
View all notes |
Alert me of new notes |
CANSLIM.net Company Profile |
SEC |
Zacks Reports |
StockTalk |
News |
Chart |
Request a new note
C
A N
S L
I M
|
QCOR
-
NASDAQ
Questcor Pharmaceuticals
DRUGS - Biotechnology
|
$66.79
|
+0.01
0.01% |
$67.49
|
710,123
41.92% of 50 DAV
50 DAV is 1,694,000
|
$74.76
-10.66%
|
7/31/2013
|
$66.46
|
PP = $59.01
|
|
MB = $61.96
|
Most Recent Note - 9/6/2013 6:17:45 PM
G - Holding its ground, extended from any sound base. Recent lows in the $64 area define near-term support to watch above its 50 DMA line.
>>> The latest Featured Stock Update with an annotated graph appeared on 8/26/2013. Click here.
View all notes |
Alert me of new notes |
CANSLIM.net Company Profile |
SEC |
Zacks Reports |
StockTalk |
News |
Chart |
Request a new note
C
A N
S L
I M
|
Symbol/Exchange
Company Name
Industry Group |
PRICE |
CHANGE
(%Change) |
Day High |
Volume
(% DAV)
(% 50 day avg vol) |
52 Wk Hi
% From Hi |
Featured
Date |
Price
Featured |
Pivot Featured |
|
Max Buy |
SFUN
-
NYSE
Soufun Hldgs Ltd Ads A
INTERNET - Internet Information Providers
|
$49.53
|
-1.38
-2.71% |
$50.99
|
601,922
86.11% of 50 DAV
50 DAV is 699,000
|
$50.95
-2.79%
|
7/16/2013
|
$29.54
|
PP = $27.90
|
|
MB = $29.30
|
Most Recent Note - 9/5/2013 12:48:43 PM
G - Perched at its all-time high today following a streak of 5 consecutive gains with ever-increasing volume. Very extended from any sound base. Recent highs near $42 define initial support to watch on pullbacks.
>>> The latest Featured Stock Update with an annotated graph appeared on 8/30/2013. Click here.
View all notes |
Alert me of new notes |
CANSLIM.net Company Profile |
SEC |
Zacks Reports |
StockTalk |
News |
Chart |
Request a new note
C
A N
S L
I M
|
SSNC
-
NASDAQ
S S & C Technologies
COMPUTER SOFTWARE and SERVICES - Application Software
|
$35.95
|
-0.06
-0.17% |
$36.23
|
241,061
57.75% of 50 DAV
50 DAV is 417,400
|
$38.80
-7.35%
|
9/5/2013
|
$36.01
|
PP = $38.90
|
|
MB = $40.85
|
Most Recent Note - 9/5/2013 6:49:32 PM
Y - New pivot point cited based on its 8/02/13 high plus 10 cents. Subsequent volume-driven gains may trigger a new buy signal. See the latest FSU analysis for more details and a new annotated graph.
>>> The latest Featured Stock Update with an annotated graph appeared on 9/5/2013. Click here.
View all notes |
Alert me of new notes |
CANSLIM.net Company Profile |
SEC |
Zacks Reports |
StockTalk |
News |
Chart |
Request a new note
C
A N
S L
I M
|
SSYS
-
NASDAQ
Stratasys Ltd
COMPUTER HARDWARE - Computer Peripherals
|
$106.38
|
-0.68
-0.64% |
$108.95
|
753,034
88.47% of 50 DAV
50 DAV is 851,200
|
$113.49
-6.26%
|
7/8/2013
|
$91.44
|
PP = $95.00
|
|
MB = $99.75
|
Most Recent Note - 9/4/2013 1:07:15 PM
G - Pulling back today from its all-time high. Repeatedly noted - "Extended from its prior base. Prior highs in the $96 area define initial support to watch on pullbacks."
>>> The latest Featured Stock Update with an annotated graph appeared on 8/16/2013. Click here.
View all notes |
Alert me of new notes |
CANSLIM.net Company Profile |
SEC |
Zacks Reports |
StockTalk |
News |
Chart |
Request a new note
C
A N
S L
I M
|
STMP
-
NASDAQ
Stamps.Com Inc
INTERNET - Internet Software and Services
|
$44.02
|
+0.11
0.25% |
$44.92
|
179,379
138.62% of 50 DAV
50 DAV is 129,400
|
$46.47
-5.27%
|
7/31/2013
|
$40.00
|
PP = $42.98
|
|
MB = $45.13
|
Most Recent Note - 9/6/2013 6:19:38 PM
Y - Posted a 7th consecutive gain today and ended at a best-ever close. Recently found encouraging support at its 50 DMA line.
>>> The latest Featured Stock Update with an annotated graph appeared on 8/23/2013. Click here.
View all notes |
Alert me of new notes |
CANSLIM.net Company Profile |
SEC |
Zacks Reports |
StockTalk |
News |
Chart |
Request a new note
C
A N
S L
I M
|
TBBK
-
NASDAQ
Bancorp Inc
BANKING - Regional - Mid-Atlantic Banks
|
$17.18
|
+0.16
0.94% |
$17.46
|
436,050
296.03% of 50 DAV
50 DAV is 147,300
|
$17.24
-0.35%
|
9/4/2013
|
$16.26
|
PP = $16.79
|
|
MB = $17.63
|
Most Recent Note - 9/6/2013 6:21:23 PM
Y - Hit another new 52-week high today with its 7th consecutive gain. Triggered a technical buy signal with a breakout gain on 3 times average volume on the prior session, rising from an 8-week base. Prior highs define important near-term support to watch on pullbacks. An annotated graph and more details were included in the FSU section on 9/04/13 under the headline, "Forming Sound Set-Up While "M" Correction Remains Overriding Concern".
>>> The latest Featured Stock Update with an annotated graph appeared on 9/4/2013. Click here.
View all notes |
Alert me of new notes |
CANSLIM.net Company Profile |
SEC |
Zacks Reports |
StockTalk |
News |
Chart |
Request a new note
C
A N
S L
I M
|
Symbol/Exchange
Company Name
Industry Group |
PRICE |
CHANGE
(%Change) |
Day High |
Volume
(% DAV)
(% 50 day avg vol) |
52 Wk Hi
% From Hi |
Featured
Date |
Price
Featured |
Pivot Featured |
|
Max Buy |
VRX
-
NYSE
Valeant Pharmaceuticals
DRUGS - Drug Manufacturers - Other
|
$100.24
|
+0.44
0.44% |
$101.01
|
738,850
56.46% of 50 DAV
50 DAV is 1,308,600
|
$105.40
-4.90%
|
4/30/2013
|
$60.24
|
PP = $76.66
|
|
MB = $80.49
|
Most Recent Note - 9/4/2013 6:22:29 PM
G- Holding its ground -5.2% off its 52-week high and recent insider buying while trading near its highs has been noted as an encouraging sign. Reported earnings +33% on +34% sales revenues for the Jun '13 quarter, above the +25% minimum earnings guideline (C criteria).
>>> The latest Featured Stock Update with an annotated graph appeared on 8/15/2013. Click here.
View all notes |
Alert me of new notes |
CANSLIM.net Company Profile |
SEC |
Zacks Reports |
StockTalk |
News |
Chart |
Request a new note
C
A N
S L
I M
|
YNDX
-
NASDAQ
Yandex N V Class A
INTERNET - Internet Information Providers
|
$34.24
|
-0.43
-1.24% |
$35.10
|
3,127,626
128.37% of 50 DAV
50 DAV is 2,436,400
|
$35.24
-2.84%
|
9/5/2013
|
$34.24
|
PP = $34.79
|
|
MB = $36.53
|
Most Recent Note - 9/6/2013 1:02:45 PM
Y - Perched at its 52-week high following a spurt of gains from support at its 50 DMA line, important near-term support to watch. It did not form a base of sufficient length, however its color code was changed to yellow while a valid secondary buy point exists up to +5% above its prior high.
>>> The latest Featured Stock Update with an annotated graph appeared on 8/20/2013. Click here.
View all notes |
Alert me of new notes |
CANSLIM.net Company Profile |
SEC |
Zacks Reports |
StockTalk |
News |
Chart |
Request a new note
C
A N
S L
I M
|
|
|
|
THESE ARE NOT BUY RECOMMENDATIONS!
Comments contained in the body of this report are technical
opinions only. The material herein has been obtained
from sources believed to be reliable and accurate, however,
its accuracy and completeness cannot be guaranteed.
This site is not an investment advisor, hence it does
not endorse or recommend any securities or other investments.
Any recommendation contained in this report may not
be suitable for all investors and it is not to be deemed
an offer or solicitation on our part with respect to
the purchase or sale of any securities. All trademarks,
service marks and trade names appearing in this report
are the property of their respective owners, and are
likewise used for identification purposes only.
This report is a service available
only to active Paid Premium Members.
You may opt-out of receiving report notifications
at any time. Questions or comments may be submitted
by writing to Premium Membership Services 665 S.E. 10 Street, Suite 201 Deerfield Beach, FL 33441-5634 or by calling 1-800-965-8307
or 954-785-1121.
|
|
|

