You are not logged in.
This means you
CAN ONLY VIEW reports that were published prior to Wednesday, April 9, 2025.
You
MUST UPGRADE YOUR MEMBERSHIP if you want to see any current reports.
AFTER MARKET UPDATE - WEDNESDAY, SEPTEMBER 4TH, 2013
Previous After Market Report Next After Market Report >>>
|
|
|
|
DOW |
+96.91 |
14,930.87 |
+0.65% |
|
Volume |
728,094,460 |
-7% |
|
Volume |
1,741,225,700 |
+11% |
|
NASDAQ |
+36.43 |
3,649.04 |
+1.01% |
|
Advancers |
2,150 |
69% |
|
Advancers |
1,650 |
63% |
|
S&P 500 |
+13.31 |
1,653.08 |
+0.81% |
|
Decliners |
859 |
28% |
|
Decliners |
867 |
33% |
|
Russell 2000 |
+9.32 |
1,025.58 |
+0.92% |
|
52 Wk Highs |
68 |
|
|
52 Wk Highs |
81 |
|
|
S&P 600 |
+4.47 |
579.59 |
+0.78% |
|
52 Wk Lows |
33 |
|
|
52 Wk Lows |
24 |
|
|
 |
Major Indices Posted Modest Gains
Kenneth J. Gruneisen - Passed the CAN SLIM® Master's Exam
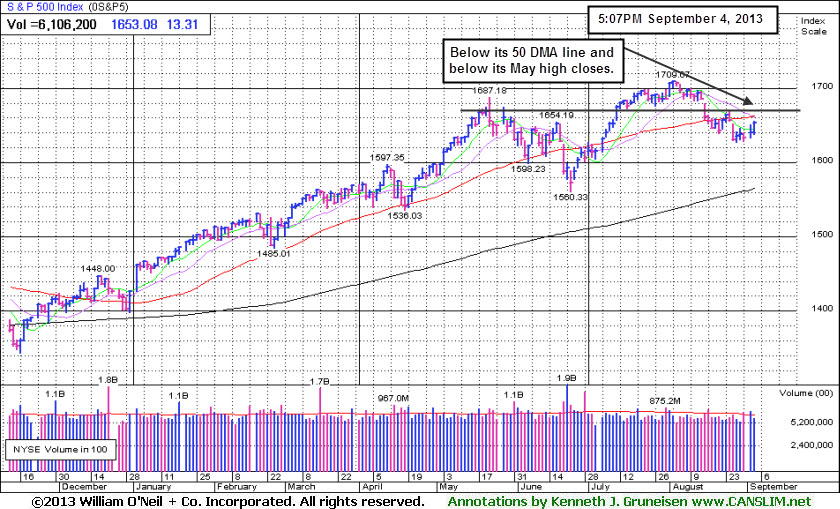
The major averages finished higher for the second straight session but finished off their best levels on Wednesday. The volume totals were reported mixed, lighter than the prior session total on the NYSE and higher on the Nasdaq exchange. Breadth was positive as advancers led decliners by a 5-2 margin on the NYSE and by a 2-1 margin on the Nasdaq exchange. There were 35 high-ranked companies from the CANSLIM.net Leaders List that made new 52-week highs and appeared on the CANSLIM.net BreakOuts Page, up from a total of 31 stocks on the prior session. The list of stocks hitting new 52-week highs outnumbered new lows on the NYSE and on the Nasdaq exchange. There were gains for 13 of the 17 high-ranked companies currently included on the Featured Stocks Page. The market (M criteria) is technically still in a "correction", and historic studies suggest that no new buying efforts should be made during market corrections. An ideal turning point to watch for would be a solid follow-through day of gains greater than +1.5% from at least one of the 3 major averages with higher volume totals and an expansion in leadership (new 52-week highs).
The Dow experienced its best day in over a month as it gained over 96 points to 14,930. Nine of the 10 S&P 500 sectors gained ground. Telecommunications paced the advance as Verizon Communications Inc (VZ +1.67%) rebounded from yesterday's slump. The Consumer Discretionary group also helped lift the market thanks to a rally staged by automakers and retailers. Ford Motor Co (F +3.49%) zoomed higher after posting its best monthly sales since 2006, and Dollar General Corp (DG +4.66%) reported better-than-expected earnings results.
Investors were also focused on Capitol Hill as a Senate committee debated a resolution that would give President Obama approval for a U.S. military attack on Syria. The Fed also garnered attention after its Beige Book revealed the U.S. economy continued to improve over the past quarter, which prompted speculation that the central bank may begin tapering its stimulus measures at the upcoming FOMC meeting.
In fixed-income, Treasuries declined for a third day. The 10-year note was down 10/32 to yield 2.89% and the 30-year bond lost 4/32 to yield 3.80%.
The Dow Jones Industrial Average and the S&P 500 Index both remain below their respective 50-day moving average lines. Subsequent rebounds above those short-term averages would be encouraging signs to watch for before one can truly consider those indices in "healthy" shape chart-wise.
Stay familiar with companies listed on the CANSLIM.net Featured Stocks Page - a page showing the most action-worthy candidates' latest notes and links to additional resources including detailed analysis with data-packed graphs which are annotated by a Certified expert. The Premium Member Homepage - includes "dynamic archives" to all prior pay reports published. Watch for an announcement via email concerning the next WEBCAST.
PICTURED: The S&P 500 Index gained +0.81% on Day 5 of its rally attempt. A one day gain of +1.5% would be ideal to be considered a solid follow-through day. Meanwhile, losses must not undercut the indices' Day 1 lows, which would technically end the brief rally attempt and signal that the correction was worsening. Right now the benchmark index is still consolidating below its May highs and below its 50-day moving average (DMA) line. The 3 major averages should be trading above their respective 50-day moving average (DMA) lines to be considered in "healthy" technical shape. It is important to watch for a proper follow-through day (FTD) to signal convincingly that a solid rally is at hand before new buying efforts in stocks may be justified under the fact-based system. Patience and discipline remain paramount.
|
 Kenneth J. Gruneisen started out as a licensed stockbroker in August 1987, a couple of months prior to the historic stock market crash that took the Dow Jones Industrial Average down -22.6% in a single day. He has published daily fact-based fundamental and technical analysis on high-ranked stocks online for two decades. Through FACTBASEDINVESTING.COM, Kenneth provides educational articles, news, market commentary, and other information regarding proven investment systems that work in good times and bad.
Comments contained in the body of this report are technical opinions only and are not necessarily those of Gruneisen Growth Corp. The material herein has been obtained from sources believed to be reliable and accurate, however, its accuracy and completeness cannot be guaranteed. Our firm, employees, and customers may effect transactions, including transactions contrary to any recommendation herein, or have positions in the securities mentioned herein or options with respect thereto. Any recommendation contained in this report may not be suitable for all investors and it is not to be deemed an offer or solicitation on our part with respect to the purchase or sale of any securities. |
|
 |
Tech Sector Led Widespread Group Gains
Kenneth J. Gruneisen - Passed the CAN SLIM® Master's Exam
The tech-sector underpinned the major averages' gains as the Internet Index ($IIX +1.63%), Biotechnology Index ($BTK +2.09%), Semiconductor Index ($SOX +2.58%), and Networking Index ($NWX +2.98%) posted unanimous gains. Financial shares were a positive influence as well as the Broker/Dealer Index ($XBD +1.62%) outpaced the Bank Index ($BKX +0.70%). The Retail Index ($RLX +0.98%) and the Healthcare Index ($HMO +1.34%) also posted solid gains, and the Integrated Oil Index ($XOI +0.58%) and the Oil Services Index ($OSX +1.59%) both rose as energy-related shares had a positive bias. Meanwhile, the Gold & Silver Index ($XAU +0.06%) finished flat, lagging growth-oriented groups.
Charts courtesy www.stockcharts.com
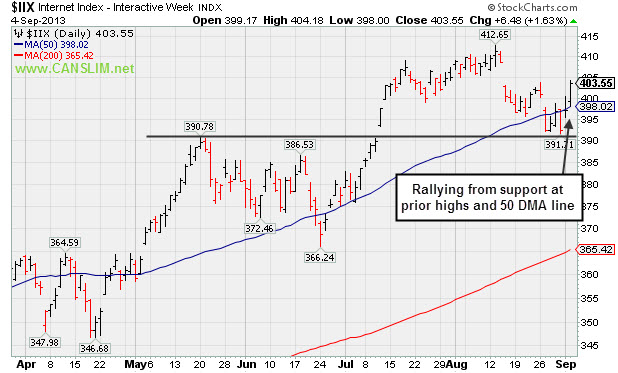
PICTURED: The Internet Index ($IIX +1.63%) is rallying from support at its prior highs and 50-day moving average (DMA) line.
| Oil Services |
$OSX |
262.49 |
+4.10 |
+1.59% |
+19.23% |
| Healthcare |
$HMO |
3,436.20 |
+45.50 |
+1.34% |
+36.67% |
| Integrated Oil |
$XOI |
1,386.05 |
+8.01 |
+0.58% |
+11.61% |
| Semiconductor |
$SOX |
473.56 |
+11.92 |
+2.58% |
+23.30% |
| Networking |
$NWX |
289.91 |
+8.40 |
+2.98% |
+27.97% |
| Internet |
$IIX |
403.55 |
+6.48 |
+1.63% |
+23.41% |
| Broker/Dealer |
$XBD |
134.82 |
+2.14 |
+1.62% |
+42.92% |
| Retail |
$RLX |
820.90 |
+7.99 |
+0.98% |
+25.70% |
| Gold & Silver |
$XAU |
104.75 |
+0.06 |
+0.06% |
-36.75% |
| Bank |
$BKX |
62.94 |
+0.44 |
+0.70% |
+22.74% |
| Biotech |
$BTK |
2,143.94 |
+43.91 |
+2.09% |
+38.58% |
|
|
|
 |
Forming Sound Set-Up While "M" Correction Remains Overriding Concern
Kenneth J. Gruneisen - Passed the CAN SLIM® Master's Exam
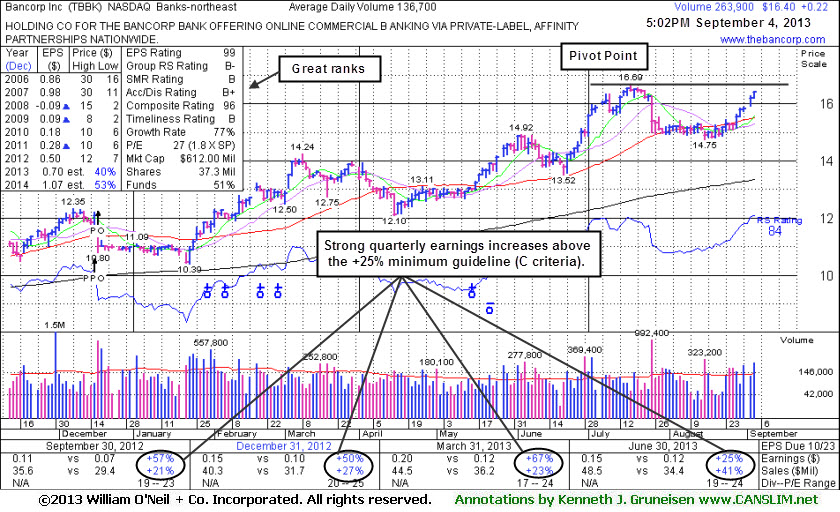
Bancorp Inc (TBBK +$0.22 or +1.36% to $16.40) has rebounded near its 52-week high with 5 consecutive gains after sputtering near its 50-day moving average (DMA) line in recent weeks. It was highlighted in yellow with pivot point cited based on its 7/17/13 high plus 10 cents while building on an 8-week base in the earlier mid-day report (read here). It reported +25% earnings for the Jun '13 quarter. Quarterly earnings increases above the +25% guideline satisfy the C criteria. Its annual earnings (A criteria) history has been steadily improving after an abrupt downturn and loss in FY '08. It completed a new Public Offering on 12/18/12.
The number of top-rated funds owning its share rose from 169 in Sep '12 to 181 in Jun '13, a reassuring sign concerning the I criteria. This makes an ideal stock for members' watch lists while waiting until a proper technical buy signal occurs, providing proof of fresh institutional buying demand. Keep in mind that the broader market (M criteria) weakness is an overriding concern that currently argues against new buying efforts in stocks until a new confirmed rally is noted. Its small supply (S criteria) of only 32.9 million shares in the public float can contribute to greater price volatility in the event of institutional buying or selling.
|
|
|
Color Codes Explained :
Y - Better candidates highlighted by our
staff of experts.
G - Previously featured
in past reports as yellow but may no longer be buyable under the
guidelines.
***Last / Change / Volume data in this table is the closing quote data***
Symbol/Exchange
Company Name
Industry Group |
PRICE |
CHANGE
(%Change) |
Day High |
Volume
(% DAV)
(% 50 day avg vol) |
52 Wk Hi
% From Hi |
Featured
Date |
Price
Featured |
Pivot Featured |
|
Max Buy |
BITA
-
NYSE
Bitauto Hldgs Ltd Ads
INTERNET - Internet Information Providers
|
$13.94
|
-0.01
-0.07% |
$14.13
|
165,118
70.44% of 50 DAV
50 DAV is 234,400
|
$18.10
-22.98%
|
8/7/2013
|
$12.01
|
PP = $13.30
|
|
MB = $13.97
|
Most Recent Note - 9/3/2013 9:37:55 PM
G - Consolidating above its 50 DMA line and prior highs. See the latest FSU analysis for more details and a new annotated graph.
>>> The latest Featured Stock Update with an annotated graph appeared on 9/3/2013. Click here.
View all notes |
Alert me of new notes |
CANSLIM.net Company Profile |
SEC |
Zacks Reports |
StockTalk |
News |
Chart |
Request a new note
C
A N
S L
I M


|
CELG
-
NASDAQ
Celgene Corp
DRUGS - Drug Manufacturers - Major
|
$146.07
|
+3.06
2.14% |
$146.21
|
2,626,289
106.20% of 50 DAV
50 DAV is 2,473,000
|
$149.92
-2.57%
|
7/11/2013
|
$133.25
|
PP = $131.92
|
|
MB = $138.52
|
 Most Recent Note - 9/4/2013 11:55:25 AM
Y - Building a base-on-base type pattern, it recently found support above prior highs in the $131 area and above its 50 DMA line, important chart support levels.
>>> The latest Featured Stock Update with an annotated graph appeared on 8/21/2013. Click here.
View all notes |
Alert me of new notes |
CANSLIM.net Company Profile |
SEC |
Zacks Reports |
StockTalk |
News |
Chart |
Request a new note
C
A N
S L
I M
|
FLT
-
NYSE
Fleetcor Technologies
DIVERSIFIED SERVICES - Business/Management Services
|
$103.99
|
-1.81
-1.71% |
$106.90
|
670,501
106.85% of 50 DAV
50 DAV is 627,500
|
$108.38
-4.05%
|
8/19/2013
|
$99.01
|
PP = $100.97
|
|
MB = $106.02
|
Most Recent Note - 9/3/2013 9:36:46 PM
Y- Gain on light volume today for a best-ever close. Rising from an advanced "3-weeks tight" base, albeit a riskier "late stage" base. Keep in mind the M criteria argues against new buying efforts until a new confirmed rally.
>>> The latest Featured Stock Update with an annotated graph appeared on 8/12/2013. Click here.
View all notes |
Alert me of new notes |
CANSLIM.net Company Profile |
SEC |
Zacks Reports |
StockTalk |
News |
Chart |
Request a new note
C
A N
S L
I M
|
GNRC
-
NYSE
Generac Hldgs Inc
CONSUMER DURABLES - Electronic Equipment
|
$39.95
|
+0.25
0.63% |
$40.11
|
545,250
55.65% of 50 DAV
50 DAV is 979,800
|
$44.30
-9.82%
|
7/30/2013
|
$42.60
|
PP = $42.10
|
|
MB = $44.21
|
Most Recent Note - 8/29/2013 12:37:49 PM
Y - Testing support at its 50 DMA line today. Any further deterioration would raise concerns and trigger a technical sell signal. Stalled after a recent rally from an advanced "3-weeks tight" base as it priced a Secondary Offering. Disciplined investors always limit losses by selling if any stock falls more than -7% from its purchase price.
>>> The latest Featured Stock Update with an annotated graph appeared on 8/22/2013. Click here.
View all notes |
Alert me of new notes |
CANSLIM.net Company Profile |
SEC |
Zacks Reports |
StockTalk |
News |
Chart |
Request a new note
C
A N
S L
I M
|
KORS
-
NYSE
Michael Kors Hldgs Ltd
RETAIL - Apparel Stores
|
$75.40
|
+0.97
1.30% |
$75.92
|
3,457,903
96.94% of 50 DAV
50 DAV is 3,567,200
|
$75.01
0.52%
|
8/6/2013
|
$69.66
|
PP = $66.28
|
|
MB = $69.59
|
Most Recent Note - 8/29/2013 6:24:31 PM
G - Finished at a new high close today with another gain on below average volume. Prior highs in the $66 area define initial support to watch on pullbacks. See the latest FSU analysis for more details and a new annotated graph.
>>> The latest Featured Stock Update with an annotated graph appeared on 8/29/2013. Click here.
View all notes |
Alert me of new notes |
CANSLIM.net Company Profile |
SEC |
Zacks Reports |
StockTalk |
News |
Chart |
Request a new note
C
A N
S L
I M
|
Symbol/Exchange
Company Name
Industry Group |
PRICE |
CHANGE
(%Change) |
Day High |
Volume
(% DAV)
(% 50 day avg vol) |
52 Wk Hi
% From Hi |
Featured
Date |
Price
Featured |
Pivot Featured |
|
Max Buy |
LOPE
-
NASDAQ
Grand Canyon Education
DIVERSIFIED SERVICES - Education and; Training Services
|
$35.98
|
+0.97
2.77% |
$36.08
|
308,511
71.28% of 50 DAV
50 DAV is 432,800
|
$37.17
-3.20%
|
6/19/2013
|
$31.47
|
PP = $34.17
|
|
MB = $35.88
|
Most Recent Note - 9/4/2013 1:21:14 PM
G - Rising within close striking distance of a best-ever close and near its 52-week high, rebounding above its 50 DMA line with recent gains on light volume. Earnings +15% on +19% sales for the Jun '13 quarter, below the +25% minimum earnings guideline (C criteria), raised fundamental concerns, yet technical action has been somewhat reassuring.
>>> The latest Featured Stock Update with an annotated graph appeared on 8/14/2013. Click here.
View all notes |
Alert me of new notes |
CANSLIM.net Company Profile |
SEC |
Zacks Reports |
StockTalk |
News |
Chart |
Request a new note
C
A N
S L
I M
|
PCLN
-
NASDAQ
Priceline.Com Inc
INTERNET - Internet Software and Services
|
$952.45
|
+9.62
1.02% |
$952.62
|
426,663
64.68% of 50 DAV
50 DAV is 659,700
|
$994.98
-4.27%
|
7/8/2013
|
$878.28
|
PP = $847.43
|
|
MB = $889.80
|
Most Recent Note - 8/30/2013 4:48:13 PM
G - Consolidating above prior highs with volume totals cooling, extended from any sound base. Reported earnings +24% on +27% sales revenues for the Jun '13 quarter, just under the +25% minimum earnings guideline (C criteria).
>>> The latest Featured Stock Update with an annotated graph appeared on 8/19/2013. Click here.
View all notes |
Alert me of new notes |
CANSLIM.net Company Profile |
SEC |
Zacks Reports |
StockTalk |
News |
Chart |
Request a new note
C
A N
S L
I M
|
PRAA
-
NASDAQ
Portfolio Recovery Assoc
DIVERSIFIED SERVICES - Business/Management Services
|
$55.20
|
+2.06
3.88% |
$55.38
|
556,683
106.44% of 50 DAV
50 DAV is 523,000
|
$57.57
-4.12%
|
7/31/2013
|
$51.43
|
PP = $54.72
|
|
MB = $57.46
|
Most Recent Note - 9/4/2013 1:18:10 PM
Y - Rebounding after a slump below its old high close ($53.86 on 6/17/13) led to a close back in the prior base which raised concerns. Halted its slide above important support at its 50 DMA line.
>>> The latest Featured Stock Update with an annotated graph appeared on 8/28/2013. Click here.
View all notes |
Alert me of new notes |
CANSLIM.net Company Profile |
SEC |
Zacks Reports |
StockTalk |
News |
Chart |
Request a new note
C
A N
S L
I M
|
PRLB
-
NYSE
Proto Labs Inc
MANUFACTURING - Small Tools and Accessories
|
$74.70
|
+2.20
3.03% |
$75.76
|
463,629
104.94% of 50 DAV
50 DAV is 441,800
|
$72.91
2.46%
|
7/29/2013
|
$64.86
|
PP = $67.50
|
|
MB = $70.88
|
Most Recent Note - 9/4/2013 11:58:42 AM
G - Hitting a new high and rallying beyond its "max buy" level, its color code is changed to green. Found support at its 50 DMA line.
>>> The latest Featured Stock Update with an annotated graph appeared on 8/27/2013. Click here.
View all notes |
Alert me of new notes |
CANSLIM.net Company Profile |
SEC |
Zacks Reports |
StockTalk |
News |
Chart |
Request a new note
C
A N
S L
I M
|
QCOR
-
NASDAQ
Questcor Pharmaceuticals
DRUGS - Biotechnology
|
$67.18
|
-1.44
-2.10% |
$68.90
|
1,314,985
77.89% of 50 DAV
50 DAV is 1,688,200
|
$74.76
-10.14%
|
7/31/2013
|
$66.46
|
PP = $59.01
|
|
MB = $61.96
|
Most Recent Note - 8/30/2013 7:17:20 PM
G - Encountered mild distributional pressure with a loss on higher (near average) volume amid a widely negative market (M criteria). It is extended beyond its "max buy" level.
>>> The latest Featured Stock Update with an annotated graph appeared on 8/26/2013. Click here.
View all notes |
Alert me of new notes |
CANSLIM.net Company Profile |
SEC |
Zacks Reports |
StockTalk |
News |
Chart |
Request a new note
C
A N
S L
I M
|
Symbol/Exchange
Company Name
Industry Group |
PRICE |
CHANGE
(%Change) |
Day High |
Volume
(% DAV)
(% 50 day avg vol) |
52 Wk Hi
% From Hi |
Featured
Date |
Price
Featured |
Pivot Featured |
|
Max Buy |
SFUN
-
NYSE
Soufun Hldgs Ltd Ads A
INTERNET - Internet Information Providers
|
$50.07
|
+2.95
6.26% |
$50.48
|
2,100,351
323.68% of 50 DAV
50 DAV is 648,900
|
$47.48
5.45%
|
7/16/2013
|
$29.54
|
PP = $27.90
|
|
MB = $29.30
|
Most Recent Note - 9/4/2013 12:58:58 PM
G - Today's 5th consecutive gain with ever-increasing volume has it surging into new high territory, getting extended from a sound base. Recent highs near $42 define initial support to watch on pullbacks.
>>> The latest Featured Stock Update with an annotated graph appeared on 8/30/2013. Click here.
View all notes |
Alert me of new notes |
CANSLIM.net Company Profile |
SEC |
Zacks Reports |
StockTalk |
News |
Chart |
Request a new note
C
A N
S L
I M
|
SSNC
-
NASDAQ
S S & C Technologies
COMPUTER SOFTWARE and SERVICES - Application Software
|
$35.65
|
+0.34
0.96% |
$35.67
|
256,541
61.62% of 50 DAV
50 DAV is 416,300
|
$38.80
-8.12%
|
7/11/2013
|
$35.80
|
PP = $34.54
|
|
MB = $36.27
|
Most Recent Note - 8/30/2013 6:59:28 PM
Y - Still quietly consolidating above its 50 DMA line and prior highs in the $34 area defining important support with volume totals cooling. Disciplined investors always limit losses if ever any stock falls more than -7% from their purchase price.
>>> The latest Featured Stock Update with an annotated graph appeared on 8/9/2013. Click here.
View all notes |
Alert me of new notes |
CANSLIM.net Company Profile |
SEC |
Zacks Reports |
StockTalk |
News |
Chart |
Request a new note
C
A N
S L
I M
|
SSYS
-
NASDAQ
Stratasys Ltd
COMPUTER HARDWARE - Computer Peripherals
|
$107.45
|
-2.81
-2.55% |
$109.97
|
1,447,516
172.04% of 50 DAV
50 DAV is 841,400
|
$113.49
-5.32%
|
7/8/2013
|
$91.44
|
PP = $95.00
|
|
MB = $99.75
|
Most Recent Note - 9/4/2013 1:07:15 PM
G - Pulling back today from its all-time high. Repeatedly noted - "Extended from its prior base. Prior highs in the $96 area define initial support to watch on pullbacks."
>>> The latest Featured Stock Update with an annotated graph appeared on 8/16/2013. Click here.
View all notes |
Alert me of new notes |
CANSLIM.net Company Profile |
SEC |
Zacks Reports |
StockTalk |
News |
Chart |
Request a new note
C
A N
S L
I M
|
STMP
-
NASDAQ
Stamps.Com Inc
INTERNET - Internet Software and Services
|
$43.12
|
+0.55
1.29% |
$43.27
|
133,613
103.26% of 50 DAV
50 DAV is 129,400
|
$46.47
-7.21%
|
7/31/2013
|
$40.00
|
PP = $42.98
|
|
MB = $45.13
|
Most Recent Note - 8/30/2013 7:03:50 PM
Y - Posted a 3rd consecutive gain today against a mostly negative market backdrop (M criteria). Recently found encouraging support at its 50 DMA line.
>>> The latest Featured Stock Update with an annotated graph appeared on 8/23/2013. Click here.
View all notes |
Alert me of new notes |
CANSLIM.net Company Profile |
SEC |
Zacks Reports |
StockTalk |
News |
Chart |
Request a new note
C
A N
S L
I M
|
TBBK
-
NASDAQ
Bancorp Inc
BANKING - Regional - Mid-Atlantic Banks
|
$16.40
|
+0.22
1.36% |
$16.41
|
251,055
183.65% of 50 DAV
50 DAV is 136,700
|
$16.69
-1.74%
|
9/4/2013
|
$16.26
|
PP = $16.79
|
|
MB = $17.63
|
Most Recent Note - 9/4/2013 6:21:19 PM
Y - Rebounding near its 52-week high with 5 consecutive gains after sputtering near its 50 DMA line in recent weeks. Highlighted in yellow with pivot point cited based on its 7/17/13 high plus 10 cents while building on an 8-week base. Reported +25% earnings for the Jun '13 quarter. Quarterly earnings increases above the +25% guideline satisfy the C criteria. Its annual earnings (A criteria) history has been steadily improving after an abrupt downturn and loss in FY '08. Completed a new Public Offering on 12/18/12. See latest FSU analysis for more details and a new annotated graph.
>>> The latest Featured Stock Update with an annotated graph appeared on 9/4/2013. Click here.
View all notes |
Alert me of new notes |
CANSLIM.net Company Profile |
SEC |
Zacks Reports |
StockTalk |
News |
Chart |
Request a new note
C
A N
S L
I M
|
Symbol/Exchange
Company Name
Industry Group |
PRICE |
CHANGE
(%Change) |
Day High |
Volume
(% DAV)
(% 50 day avg vol) |
52 Wk Hi
% From Hi |
Featured
Date |
Price
Featured |
Pivot Featured |
|
Max Buy |
VRX
-
NYSE
Valeant Pharmaceuticals
DRUGS - Drug Manufacturers - Other
|
$99.94
|
+0.59
0.59% |
$100.47
|
1,001,113
74.15% of 50 DAV
50 DAV is 1,350,100
|
$105.40
-5.18%
|
4/30/2013
|
$60.24
|
PP = $76.66
|
|
MB = $80.49
|
Most Recent Note - 9/4/2013 6:22:29 PM
G- Holding its ground -5.2% off its 52-week high and recent insider buying while trading near its highs has been noted as an encouraging sign. Reported earnings +33% on +34% sales revenues for the Jun '13 quarter, above the +25% minimum earnings guideline (C criteria).
>>> The latest Featured Stock Update with an annotated graph appeared on 8/15/2013. Click here.
View all notes |
Alert me of new notes |
CANSLIM.net Company Profile |
SEC |
Zacks Reports |
StockTalk |
News |
Chart |
Request a new note
C
A N
S L
I M
|
YNDX
-
NASDAQ
Yandex N V Class A
INTERNET - Internet Information Providers
|
$32.98
|
+0.96
3.00% |
$33.51
|
2,443,371
102.87% of 50 DAV
50 DAV is 2,375,100
|
$34.79
-5.20%
|
7/10/2013
|
$29.29
|
PP = $29.59
|
|
MB = $31.07
|
Most Recent Note - 9/4/2013 6:23:30 PM
G - Finding support above its 50 DMA line, important near-term support to watch.
>>> The latest Featured Stock Update with an annotated graph appeared on 8/20/2013. Click here.
View all notes |
Alert me of new notes |
CANSLIM.net Company Profile |
SEC |
Zacks Reports |
StockTalk |
News |
Chart |
Request a new note
C
A N
S L
I M
|
|
|
|
THESE ARE NOT BUY RECOMMENDATIONS!
Comments contained in the body of this report are technical
opinions only. The material herein has been obtained
from sources believed to be reliable and accurate, however,
its accuracy and completeness cannot be guaranteed.
This site is not an investment advisor, hence it does
not endorse or recommend any securities or other investments.
Any recommendation contained in this report may not
be suitable for all investors and it is not to be deemed
an offer or solicitation on our part with respect to
the purchase or sale of any securities. All trademarks,
service marks and trade names appearing in this report
are the property of their respective owners, and are
likewise used for identification purposes only.
This report is a service available
only to active Paid Premium Members.
You may opt-out of receiving report notifications
at any time. Questions or comments may be submitted
by writing to Premium Membership Services 665 S.E. 10 Street, Suite 201 Deerfield Beach, FL 33441-5634 or by calling 1-800-965-8307
or 954-785-1121.
|
|
|

