You are not logged in.
This means you
CAN ONLY VIEW reports that were published prior to Monday, April 14, 2025.
You
MUST UPGRADE YOUR MEMBERSHIP if you want to see any current reports.
AFTER MARKET UPDATE - FRIDAY, SEPTEMBER 4TH, 2009
Previous After Market Report Next After Market Report >>>
|
|
|
|
DOW |
+96.66 |
9,441.27 |
+1.03% |
|
Volume |
1,019,739,750 |
-12% |
|
Volume |
1,784,024,390 |
-6% |
|
NASDAQ |
+35.58 |
2,018.78 |
+1.79% |
|
Advancers |
2,441 |
79% |
|
Advancers |
2,006 |
71% |
|
S&P 500 |
+13.16 |
1,016.40 |
+1.31% |
|
Decliners |
575 |
19% |
|
Decliners |
689 |
24% |
|
Russell 2000 |
+8.01 |
570.50 |
+1.42% |
|
52 Wk Highs |
101 |
|
|
52 Wk Highs |
31 |
|
|
S&P 600 |
+3.63 |
300.87 |
+1.22% |
|
52 Wk Lows |
2 |
|
|
52 Wk Lows |
5 |
|
|
 |
Major Averages Rise On Quiet Volume Heading Into Holiday
Adam Sarhan, Contributing Writer,
For the week, the major averages ended lower which put pressure on the current rally. On Friday, the major averages edged higher on lighter volume than the prior session which signaled a lack of conviction from the institutional crowd. Advancers trumped decliners by a 4-to-1 ratio on the NYSE and by nearly a 3-to-1 ratio on the Nasdaq exchange. There were 11 high-ranked companies from the CANSLIM.net Leaders List that made a new 52-week high and appeared on the CANSLIM.net BreakOuts Page, up from the 6 issues that appeared on the prior session. New 52-week highs still outnumbered new 52-week lows on both exchanges while new lows were in the single digits again.
This was an interesting week on Wall Street. On Monday, stocks edged lower after China's stock market tumbled -6.7%. This was the largest largest single-day decline since June 2008 for the Shanghai Composite and the loss officially sent that index back into a bear market (marked by a decline of at least -20% from a recent high). Over the weekend, Japan's Democratic Party won a major election which marked an end to the single-party government that lasted almost unbroken for half a century. The reason why it is important to pay attention to Asia is because Asian markets were one of the first indexes to rally earlier this year. Therefore, the fact that they are breaking down, coupled with the recent "stalling" action in the US, does not bode well for the bulls.
On Tuesday, stocks across the world sold off on the first trading day of September . Historically, September and October are the two worst months of the major averages and after the very impressive 6-month rally off the March lows many investors were eager to reduce their exposure. The US market spent the first hour advancing after two stronger than expected economic reports were released. The Institute for Supply Management’s manufacturing index rose to 52.9 which topped forecasts and the boom/bust reading of 50. The reading was the highest level since June 2007 and signaled expansion. A separate report showed that more Americans than anticipated signed contracts to buy existing homes in July, also known as pending home sales. Unfortunately, the bears showed up and sent a slew of leading stocks and the major averages sharply lower. This ominous action puts the current rally under serious pressure and reiterates the importance of remaining in cash until a new batch of healthy leadership emerges.
Stocks edged higher on Wednesday and Thursday on lower volume than Tuesday's heavy sell-off. Normally, one would like to see volume expand as the major averages rally and decline when they pullback. The fact that leadership has not expanded and the major averages have not (yet) recovered from Tuesday's sell off suggests the current rally remains under pressure.
Before Friday's opening bell, the labor department reported that US employers slashed -216,000 jobs last month which was slightly better than the street's forecast. The street was looking for a decline of -276,000 jobs last month. The report also showed that the unemployment rate jumped to +9.7% which was the highest level since 1983! The latest numbers show that a whopping 6.9 million people lost their job since December 2007 when the recession officially began. In other news, the Group of 20 (G-20) met to discuss the global economy and how some of the world's largest economies should maintain a unified stance against the recession and continue with the planned stimulus measures. One official at the meeting said the economy remains "fragile."
PICTURED: The Nasdaq Composite Index's weekly chart shows the tech-heavy index perched below its multi-year downward trendline (resistance).
|
|
|
 |
Tech Strength Helps Nasdaq Lead Major Indices
Kenneth J. Gruneisen - Passed the CAN SLIM® Master's Exam
The tech sector's solid gains helped the tech-heavy Nasdaq Composite Index out pace its peers on Friday's pre-holiday session as the Internet Index ($IIX +1.71%), Networking Index ($NWX +2.00%), Biotechnology Index ($BTK +2.51%), and Semiconductor Index ($SOX +2.68%) climbed considerably despite lighter volume. The Bank Index ($BKX +1.39%)was a positive influence while there were more modest gains from the Broker/Dealer Index ($XBD +0.71%) and Retail Index ($RLX +0.54%). Generally defensive areas also advanced as the Gold & Silver Index ($XAU +1.25%) and Healthcare Index ($HMO +1.29%) traded up, and energy shares rose, lifting the Oil Services Index ($OSX +2.16%) and Integrated Oil Index ($XOI +1.40%).
Charts courtesy www.stockcharts.com
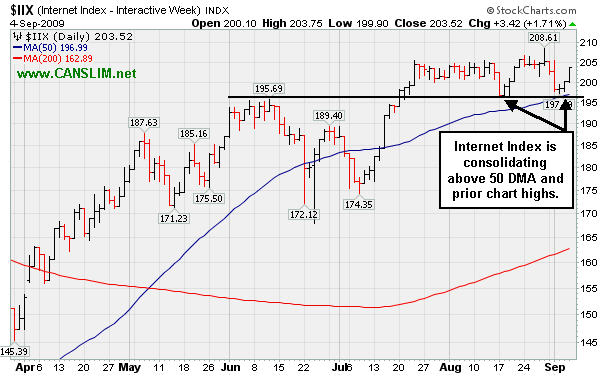
PICTURED: The Internet Index ($IIX +1.71%) is consolidating above its 50-day moving average (DMA) line and prior chart highs.
| Oil Services |
$OSX |
175.74 |
+3.71 |
+2.16% |
+44.77% |
| Healthcare |
$HMO |
1,225.81 |
+15.57 |
+1.29% |
+27.66% |
| Integrated Oil |
$XOI |
981.88 |
+13.54 |
+1.40% |
+0.22% |
| Semiconductor |
$SOX |
309.74 |
+8.09 |
+2.68% |
+45.99% |
| Networking |
$NWX |
210.88 |
+4.14 |
+2.00% |
+46.56% |
| Internet |
$IIX |
203.52 |
+3.42 |
+1.71% |
+52.14% |
| Broker/Dealer |
$XBD |
110.85 |
+0.78 |
+0.71% |
+43.09% |
| Retail |
$RLX |
366.00 |
+1.98 |
+0.54% |
+31.06% |
| Gold & Silver |
$XAU |
166.25 |
+2.06 |
+1.25% |
+34.23% |
| Bank |
$BKX |
45.24 |
+0.62 |
+1.39% |
+2.08% |
| Biotech |
$BTK |
924.72 |
+22.68 |
+2.51% |
+42.89% |
|
|
|
 |
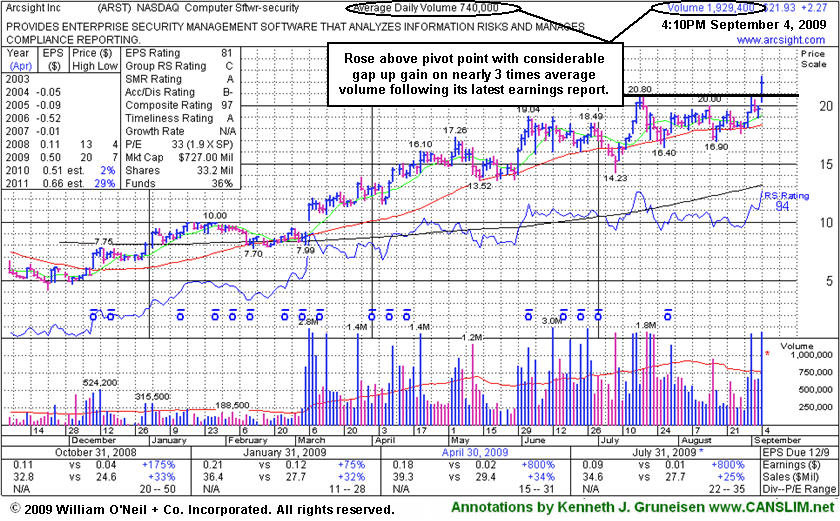
Gap Up Gain Follows Quarterly Report For Computer Software Firm
Kenneth J. Gruneisen - Passed the CAN SLIM® Master's Exam
ArcSight, Inc. (ARST +$2.31 or +10.51% to $21.97) gapped up today and hit a new all-time high with a considerable gain on heavy volume after reporting results for the quarter ended July 31, 2009. Volume was nearly 3 times its average daily volume as it blasted above its pivot point, triggering a technical buy signal. Prior chart highs are now an important support level to watch on pullbacks, and any deterioration back into its prior base would raise concerns. Disciplined investors avoid chasing stocks more than +5% above their pivot point, and the window of time to take action within the investment system's guidelines can sometimes be brief. It should be noted that the stock ended the week near its previously cited "max buy" level. ARST was featured in yellow in the 9/01/09 mid-day report with an annotated daily graph (read here) and it was also featured with more detailed analysis in the September 2009 CANSLIM.net News with an annotated weekly graph (read here).
|
|
|
Color Codes Explained :
Y - Better candidates highlighted by our
staff of experts.
G - Previously featured
in past reports as yellow but may no longer be buyable under the
guidelines.
***Last / Change / Volume quote data in this table corresponds with the timestamp on the note***
Symbol/Exchange
Company Name
Industry Group |
Last |
Chg. |
Vol
% DAV |
Date Featured |
Price Featured |
Latest Pivot Point
Featured |
Status |
| Latest Max Buy Price |
ARO
- NYSE
Aeropostale Inc
RETAIL - Apparel Stores
|
$41.66
|
+0.37
|
2,225,805
73% DAV
3,066,200
|
8/21/2009
(Date
Featured) |
$39.21
(Price
Featured) |
PP = $38.84 |
G |
| MB = $40.78 |
Most Recent Note - 9/4/2009 4:28:20 PM
G - Small gain today on light volume for a new high. Gapped up on 9/03/09 after raising guidance, closing near the session high with a gain on above average volume. Color code was changed to green after its rally above the previously cited max buy level. High-ranked leader in the Retail - Clothing/shoe group found support at prior highs in the $38 area. A gap up gain for a new all-time high on 8/21/09 helped trigger a technical buy signal as it rose from a flat base pattern with almost 3 times average volume. It was featured in yellow with new pivot point and max buy levels noted in the 8/21/09 Mid-Day BreakOuts Report (read here).
>>> The latest Featured Stock Update with an annotated graph appeared on 9/2/2009. click here.
|
|
C
A
S
I |
News |
Chart |
SEC
View all notes Alert
me of new notes
Company
Profile
|
ARST
-
|
$21.97
|
+2.31
|
2,111,767
285% DAV
740,000
|
9/1/2009
(Date
Featured) |
$19.91
(Price
Featured) |
PP = $20.90 |
Y |
| MB = $21.95 |
Most Recent Note - 9/4/2009 4:30:18 PM
Y - Gapped up today and hit a new all-time high with a considerable gain on nearly 3 times average volume, triggering a technical buy signal after reporting results for the quarter ended July 31, 2009. Featured in yellow in the 9/01/09 mid-day report with an annotated daily graph (read here) and it was also featured with more detailed analysis in the September 2009 CANSLIM.net News with an annotated weekly graph (read here).
>>> The latest Featured Stock Update with an annotated graph appeared on 9/4/2009. click here.
|
|
C
A
S
I |
News |
Chart |
SEC
View all notes Alert
me of new notes
Company
Profile
|
CPLA
- NASDAQ
Capella Education Co
DIVERSIFIED SERVICES - Education and Training Services
|
$62.26
|
-0.53
|
151,857
82% DAV
184,700
|
7/9/2009
(Date
Featured) |
$59.69
(Price
Featured) |
PP = $62.06 |
Y |
| MB = $65.16 |
Most Recent Note - 9/4/2009 4:32:17 PM
Y - Consolidating at support offered by its 50 DMA line and prior chart highs, trading in a tight range on light volume near its pivot point, within close striking range of its 52-week high. The Commercial Services-Schools Group has shown some isolated leadership which is somewhat reassuring for the L criteria, but the groups still has low ranks and CPLA's Relative Strength rank has slumped to 59, under the 80+ guideline. Its small supply of only 13.9 million shares in the float could contribute to greater price volatility in the event of institutional accumulation or distribution. The number of top-rated funds owning an interest rose from 91 in Sept '08, to 139 as of June '09, which is reassuring with respect to the I criteria. It has a very good earnings history that satisfies the C & A criteria.
>>> The latest Featured Stock Update with an annotated graph appeared on 9/3/2009. click here.
|
|
C
A
S
I |
News |
Chart |
SEC
View all notes Alert
me of new notes
Company
Profile
|
CRM
- NYSE
Salesforce.com Inc
INTERNET - Internet Software & Services
|
$52.80
|
+0.45
|
1,442,084
76% DAV
1,909,700
|
8/16/2009
(Date
Featured) |
$47.12
(Price
Featured) |
PP = $45.59 |
Y |
| MB = $47.87 |
Most Recent Note - 9/4/2009 4:42:30 PM
Y - Consolidating on light volume in a tight trading range since its "breakaway gap" for a considerable gain on 8/21/09 with more than 5 times average volume. A Stock Bulletin was published with detailed analysis and an annotated graph on 8/16/09 (read here).
>>> The latest Featured Stock Update with an annotated graph appeared on 8/31/2009. click here.
|
|
C
A
S
I |
News |
Chart |
SEC
View all notes Alert
me of new notes
Company
Profile
|
EBIX
- NASDAQ
Ebix Inc
COMPUTER SOFTWARE & SERVICES - Business Software & Services
|
$52.49
|
+1.20
|
103,811
107% DAV
96,800
|
8/28/2009
(Date
Featured) |
$45.86
(Price
Featured) |
PP = $45.35 |
G |
| MB = $47.62 |
Most Recent Note - 9/4/2009 4:43:43 PM
G - After 11 consecutive gains it is very extended from its latest base. Prior chart highs near $46 are an important support level to watch on pullbacks. Featured in yellow in the 8/28/09 Mid-Day BreakOuts Report (read here). This high-ranked leader had traded up more than +59% after it was first featured in the March 2008 CANSLIM.net News (read here), but weak action later in the year subsequently prompted it to be dropped from the Featured Stocks list. Do not be confused by the 3:1 split that took effect on 10/09/08.
>>> The latest Featured Stock Update with an annotated graph appeared on 8/28/2009. click here.
|
|
C
A
S
I |
News |
Chart |
SEC
View all notes Alert
me of new notes
Company
Profile
|
GMCR
- NASDAQ
Green Mtn Coffee Roastrs
FOOD & BEVERAGE - Processed & Packaged Goods
|
$58.60
|
+0.23
|
517,564
32% DAV
1,603,300
|
7/17/2009
(Date
Featured) |
$60.15
(Price
Featured) |
PP = $63.79 |
G |
| MB = $66.98 |
Most Recent Note - 9/4/2009 4:45:41 PM
G - Quiet trading under its 50 DMA line in recent weeks is raising concerns, while a violation of its prior chart low ($54.32 on 8/18/09) would complete a bearish "head-and-shoulders" pattern and trigger more worrisome technical sell signals. GMCR traded up more than +168% since appearing with an annotated graph under the headline "It May Soon Be Time To Go Green" when featured in the January 2009 CANSLIM.net News (read here).
>>> The latest Featured Stock Update with an annotated graph appeared on 8/26/2009. click here.
|
|
C
A
S
I |
News |
Chart |
SEC
View all notes Alert
me of new notes
Company
Profile
|
NTES
- NASDAQ
Netease Inc Adr
INTERNET - Internet Information Providers
|
$42.52
|
+1.20
|
676,591
31% DAV
2,178,200
|
7/17/2009
(Date
Featured) |
$39.29
(Price
Featured) |
PP = $38.74 |
G |
| MB = $40.68 |
Most Recent Note - 9/4/2009 4:46:54 PM
G - Gain on light volume today, still quietly consolidating in a tight range above support at its 50 DMA line and above prior chart highs in the $38 area. Deterioration below those levels would raise more serious concerns and triggger additional sell signals.
>>> The latest Featured Stock Update with an annotated graph appeared on 8/27/2009. click here.
|
|
C
A
S
I |
News |
Chart |
SEC
View all notes Alert
me of new notes
Company
Profile
|
NVEC
- NASDAQ
N V E Corp
ELECTRONICS - Semiconductor - Specialized
|
$54.00
|
+1.60
|
47,327
54% DAV
87,500
|
8/26/2009
(Date
Featured) |
$55.32
(Price
Featured) |
PP = $57.60 |
G |
| MB = $60.48 |
Most Recent Note - 9/4/2009 4:47:56 PM
G - Hovering just above important support at its 50 DMA line and prior chart highs with 3 consecutive gains on very light volume. Color code was changed to green based on its weak action and failure to produce gains above its latest pivot point. Quarterly sales revenues in the 6 million dollar range are still rather minuscule, leaving concerns.
>>> The latest Featured Stock Update with an annotated graph appeared on 9/1/2009. click here.
|
|
C
A
S
I |
News |
Chart |
SEC
View all notes Alert
me of new notes
Company
Profile
|
PEGA
- NASDAQ
Pegasystems Inc
COMPUTER SOFTWARE & SERVICES - Business Software & Services
|
$30.09
|
+0.38
|
218,408
59% DAV
373,200
|
7/29/2009
(Date
Featured) |
$27.53
(Price
Featured) |
PP = $27.49 |
G |
| MB = $28.86 |
Most Recent Note - 9/4/2009 4:49:27 PM
G - Second consecutive gain on light volume while consolidating near an upward trendline connecting its July-August lows. That trendline may be considered an initial technical support level above its 50 DMA line and prior chart highs.
>>> The latest Featured Stock Update with an annotated graph appeared on 8/24/2009. click here.
|
|
C
A
S
I |
News |
Chart |
SEC
View all notes Alert
me of new notes
Company
Profile
|
|
|
|
THESE ARE NOT BUY RECOMMENDATIONS!
Comments contained in the body of this report are technical
opinions only. The material herein has been obtained
from sources believed to be reliable and accurate, however,
its accuracy and completeness cannot be guaranteed.
This site is not an investment advisor, hence it does
not endorse or recommend any securities or other investments.
Any recommendation contained in this report may not
be suitable for all investors and it is not to be deemed
an offer or solicitation on our part with respect to
the purchase or sale of any securities. All trademarks,
service marks and trade names appearing in this report
are the property of their respective owners, and are
likewise used for identification purposes only.
This report is a service available
only to active Paid Premium Members.
You may opt-out of receiving report notifications
at any time. Questions or comments may be submitted
by writing to Premium Membership Services 665 S.E. 10 Street, Suite 201 Deerfield Beach, FL 33441-5634 or by calling 1-800-965-8307
or 954-785-1121.
|
|
|


