You are not logged in.
This means you
CAN ONLY VIEW reports that were published prior to Tuesday, April 15, 2025.
You
MUST UPGRADE YOUR MEMBERSHIP if you want to see any current reports.
AFTER MARKET UPDATE - THURSDAY, SEPTEMBER 3RD, 2009
Previous After Market Report Next After Market Report >>>
|
|
|
|
DOW |
+63.94 |
9,344.61 |
+0.69% |
|
Volume |
1,161,573,790 |
-16% |
|
Volume |
1,905,703,140 |
-7% |
|
NASDAQ |
+16.13 |
1,983.20 |
+0.82% |
|
Advancers |
2,327 |
75% |
|
Advancers |
1,807 |
64% |
|
S&P 500 |
+8.49 |
1,003.24 |
+0.85% |
|
Decliners |
686 |
22% |
|
Decliners |
868 |
31% |
|
Russell 2000 |
+6.66 |
562.49 |
+1.20% |
|
52 Wk Highs |
75 |
|
|
52 Wk Highs |
15 |
|
|
S&P 600 |
+3.16 |
297.24 |
+1.07% |
|
52 Wk Lows |
0 |
|
|
52 Wk Lows |
5 |
|
|
 |
Gain on Light Volume Reveals Lackluster Buying From Large Institutions
Adam Sarhan, Contributing Writer,
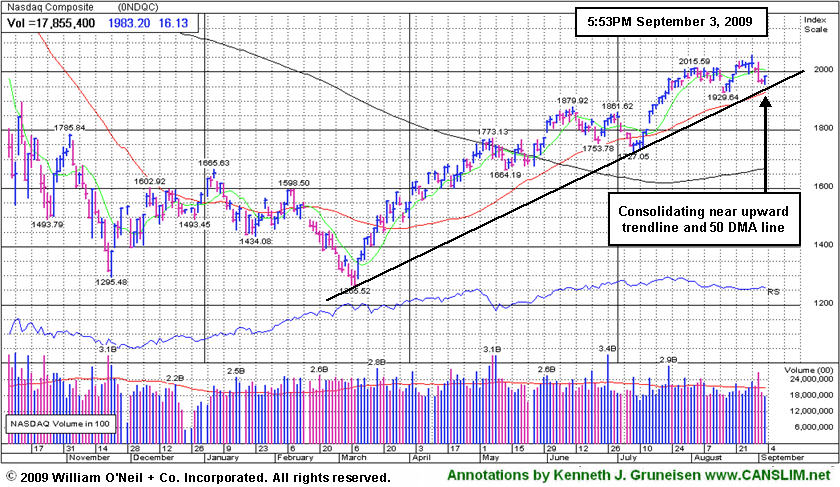
The major averages ended unanimously higher, yet volume totals on the stock exchanges contracted for the second straight day. The fact that the market has edged higher on lighter volume after Tuesday's heavy volume sell off suggests the bulls are running out of gas. Advancers led decliners by more than a 3-to-1 ratio on the NYSE and by more than a 2-to-1 ratio on the Nasdaq exchange. There were only 6 high-ranked companies from the CANSLIM.net Leaders List that made a new 52-week high and appeared on the CANSLIM.net BreakOuts Page, up from the 4 issues that appeared on the prior session. New 52-week highs still outnumbered new 52-week lows on both exchanges while new lows were in the single digits again.
Precious metals stole the show for the second straight day as stocks ended widely higher on lighter volume Thursday. Gold and silver stocks added to the prior session's impressive rally, helping the lagging group quickly sprint higher. Historically, investors have been known to invest in gold as a hedge against inflation or use it as insurance against a global scare. The fact that gold and silver have surged sharply -after the major averages soared over +50% from their March lows, suggests that capital is rotating away from equities and into so-called "safer" investments (i.e. gold and bonds). It will be very interesting to see how the major averages perform in the near term, and whether this time around the group will serve as a safe haven, or offer any meaningful upside in a period of declining equity prices.
The Labor Department reported that unemployment claims fell last week by 4,000 to 570,000 while the number of those receiving benefits rose. This was lower than the Street's forecast for a larger drop. Before Friday's opening bell, the Labor Department is slated to release last month's employment report which is is expected to show that US employers slashed over 200,000 jobs last month. One of the largest problems facing the economic recovery is the massive unemployment rate.
The International Council of Shopping Centers released a report which showed that retail sales slid -2.1% in August but were better than an expected drop of -3.5%. The Institute for Supply Management said its service index, was negative but closer to the boom/bust level of 50. This was the 11th consecutive monthly decline.
PICTURED: The Nasdaq Composite Index is consolidating near upward trendline and 50-day moving average (DMA) line.
|
|
|
 |
XAU Again Leads Groups Moving Higher
Kenneth J. Gruneisen - Passed the CAN SLIM® Master's Exam
The Gold & Silver Index ($XAU +4.67%) added to the prior session's powerful gain while another leading group from the prior session, the Healthcare Index ($HMO +0.36%), paused. Thursday's action was widely positive, with the Broker/Dealer Index ($XBD +1.55%) and Bank Index ($BKX +2.53%) among the positive influences on the major averages as financial group, and the influential Retail Index ($RLX +2.03%), posted solid gains. The tech sector was unanimously positive as the Internet Index ($IIX +0.87%), Biotechnology Index ($BTK +1.42%), Semiconductor Index ($SOX +1.43%), and Networking Index ($NWX +1.69%) rose. The Oil Services Index ($OSX +1.80%) outpaced the Integrated Oil Index ($XOI +0.57%).
Charts courtesy www.stockcharts.com
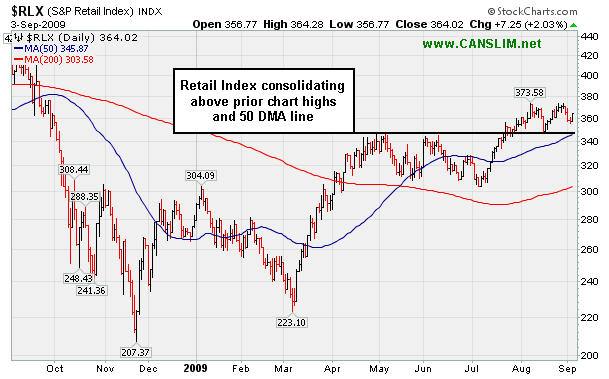
PICTURED: The Retail Index is consolidating above prior chart highs and its 50-day moving average (DMA) line.
| Oil Services |
$OSX |
172.03 |
+3.05 |
+1.80% |
+41.72% |
| Healthcare |
$HMO |
1,210.24 |
+4.36 |
+0.36% |
+26.04% |
| Integrated Oil |
$XOI |
968.34 |
+5.50 |
+0.57% |
-1.16% |
| Semiconductor |
$SOX |
301.65 |
+4.25 |
+1.43% |
+42.17% |
| Networking |
$NWX |
206.74 |
+3.44 |
+1.69% |
+43.68% |
| Internet |
$IIX |
200.10 |
+1.73 |
+0.87% |
+49.59% |
| Broker/Dealer |
$XBD |
110.07 |
+1.68 |
+1.55% |
+42.08% |
| Retail |
$RLX |
364.02 |
+7.25 |
+2.03% |
+30.35% |
| Gold & Silver |
$XAU |
164.19 |
+7.32 |
+4.67% |
+32.57% |
| Bank |
$BKX |
44.62 |
+1.10 |
+2.53% |
+0.68% |
| Biotech |
$BTK |
902.04 |
+12.66 |
+1.42% |
+39.38% |
|
|
|
 |
Healthy Consolidation Above Prior Highs And 50-Day Average
Kenneth J. Gruneisen - Passed the CAN SLIM® Master's Exam
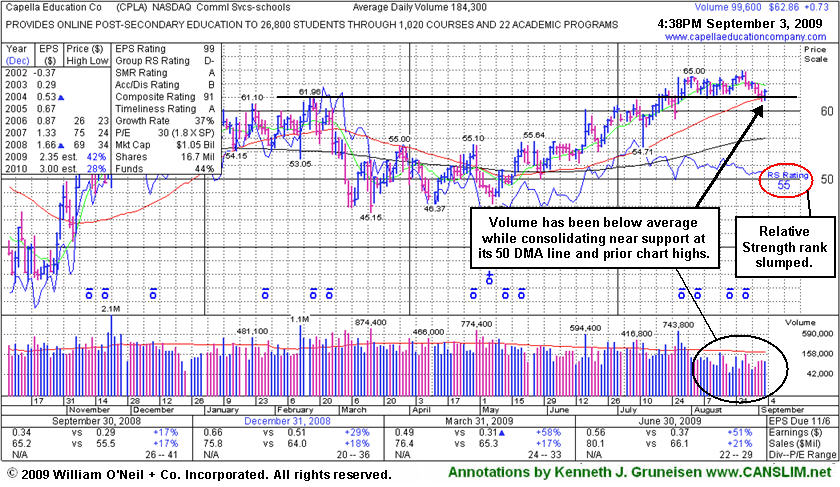
Capella Education Co. (CPLA +$0.66 or +1.05% to $62.79) found support near its 50-day moving average (DMA) line today. Its current consolidation resembles a bullish base-on-base type pattern while trading in a tight range on light volume near its pivot point, within close striking range of its 52-week high. Volume has been mostly quiet during its healthy consolidation, and there is virtually no resistance due to overhead supply. Its gap up gain on 7/28/09 with more than +50% above average volume helped it rise above its pivot point and trigger a technical buy signal. However, since first featured in yellow in the 7/09/09 Mid-Day BreakOuts Report (read here) its Relative Strength rank has slumped to a mediocre 65 (see the red circle), under the 80+ guideline, a sign that it has recently been lagging. By comparison, Bank Of America Corp (BAC +3.50%) is now -57.4% off its 52 week high, yet it currently is being rewarded with a 92 Relative Strength rank. This anomaly is due to the fact the newspapers' relative strength ranking system puts greater emphasis on the most recent 6 month period, and CPLA has moved mostly sideways in that time frame, meanwhile many badly beaten down stocks like BAC have rallied back considerably from their extreme lows in the past 6 months.
This is a strong performing leader in the Commercial Services-Schools Group. While the group has shown some leadership, concern is raised by the fact it currently has a D- for a Relative Strength Rating. CPLA's small supply of only 13.9 million shares in the float could contribute to greater price volatility in the event of institutional accumulation or distribution. The number of top-rated funds owning an interest rose from 91 in Sept '08, to 139 as of June '09, which is reassuring with respect to the I criteria. It has a very good earnings history that satisfies the C & A criteria.
A follow through day of constructive gains with heavier volume from the major averages, and from this issue, would be very crucial reassurances confirming heavy buying demand from the large institutional investors - demand which can fuel a sustained rally. Meanwhile, subsequent deterioration back under its pivot point (based on the old $61.96 high of February 17, 2009) would negate its breakout, raise concerns, and trigger a technical sell signal.
|
|
|
Color Codes Explained :
Y - Better candidates highlighted by our
staff of experts.
G - Previously featured
in past reports as yellow but may no longer be buyable under the
guidelines.
***Last / Change / Volume quote data in this table corresponds with the timestamp on the note***
Symbol/Exchange
Company Name
Industry Group |
Last |
Chg. |
Vol
% DAV |
Date Featured |
Price Featured |
Latest Pivot Point
Featured |
Status |
| Latest Max Buy Price |
ARO
- NYSE
Aeropostale Inc
RETAIL - Apparel Stores
|
$41.35
|
+2.77
|
3,844,934
127% DAV
3,031,100
|
8/21/2009
(Date
Featured) |
$39.21
(Price
Featured) |
PP = $38.84 |
G |
| MB = $40.78 |
Most Recent Note - 9/3/2009
G - Gapped up today after it raised guidance, closing near the session high with a gain on above average volume. Color code is changed to green after its rally above the previously cited max buy level. High-ranked leader in the Retail - Clothing/shoe group found support at prior highs in the $38 area. A gap up gain for a new all-time high on 8/21/09 helped trigger a technical buy signal as it rose from a flat base pattern with almost 3 times average volume. It was featured in yellow with new pivot point and max buy levels noted in the 8/21/09 Mid-Day BreakOuts Report (read here). It has a good annual earnings history (the A criteria), and the 2 latest quarterly comparisons showed +81% and +84% earnings increases, well above the investment system's +25% guideline.
>>> The latest Featured Stock Update with an annotated graph appeared on 9/2/2009. click here.
|
|
C
A
S
I |
News |
Chart |
SEC
View all notes Alert
me of new notes
Company
Profile
|
ARST
-
|
$19.69
|
+0.08
|
578,702
77% DAV
749,900
|
9/1/2009
(Date
Featured) |
$19.91
(Price
Featured) |
PP = $20.90 |
Y |
| MB = $21.95 |
Most Recent Note - 9/3/2009
Y - Consolidating within close striking distance of all-time highs. Featured in yellow in the 9/01/09 mid-day report with an annotated daily graph (read here) and it was also featured with more detailed analysis in the September 2009 CANSLIM.net News with an annotated weekly graph (read here).
>>> The latest Featured Stock Update with an annotated graph appeared on 8/31/2009. click here.
|
|
C
A
S
I |
News |
Chart |
SEC
View all notes Alert
me of new notes
Company
Profile
|
CPLA
- NASDAQ
Capella Education Co
DIVERSIFIED SERVICES - Education and Training Services
|
$62.71
|
+0.58
|
97,684
53% DAV
184,300
|
7/9/2009
(Date
Featured) |
$59.69
(Price
Featured) |
PP = $62.06 |
Y |
| MB = $65.16 |
Most Recent Note - 9/3/2009 4:15:37 PM
Y - Found support near its 50 DMA line today, trading in a tight range on light volume near its pivot point, within close striking range of its 52-week high. The Commercial Services-Schools Group has shown some isolated leadership which is somewhat reassuring for the L criteria, but the groups still has low ranks and CPLA's Relative Strength rank has slumped to 55, under the 80+ guideline. Its small supply of only 13.9 million shares in the float could contribute to greater price volatility in the event of institutional accumulation or distribution. The number of top-rated funds owning an interest rose from 91 in Sept '08, to 139 as of June '09, which is reassuring with respect to the I criteria. It has a very good earnings history that satisfies the C & A criteria.
>>> The latest Featured Stock Update with an annotated graph appeared on 9/3/2009. click here.
|
|
C
A
S
I |
News |
Chart |
SEC
View all notes Alert
me of new notes
Company
Profile
|
CRM
- NYSE
Salesforce.com Inc
INTERNET - Internet Software & Services
|
$52.35
|
+0.79
|
1,621,642
84% DAV
1,920,900
|
8/16/2009
(Date
Featured) |
$47.12
(Price
Featured) |
PP = $45.59 |
Y |
| MB = $47.87 |
Most Recent Note - 9/3/2009 4:16:34 PM
Y - Continuing its tight consolidation since its "breakaway gap" for a considerable gain on 8/21/09 with more than 5 times average volume. A Stock Bulletin was published with detailed analysis and an annotated graph on 8/16/09 (read here).
>>> The latest Featured Stock Update with an annotated graph appeared on 8/31/2009. click here.
|
|
C
A
S
I |
News |
Chart |
SEC
View all notes Alert
me of new notes
Company
Profile
|
EBIX
- NASDAQ
Ebix Inc
COMPUTER SOFTWARE & SERVICES - Business Software & Services
|
$51.29
|
+0.84
|
62,665
65% DAV
96,100
|
8/28/2009
(Date
Featured) |
$45.86
(Price
Featured) |
PP = $45.35 |
G |
| MB = $47.62 |
Most Recent Note - 9/3/2009 4:19:55 PM
G - Today was its 10th consecutive gain, and it is extended from its latest base. Prior chart highs near $46 are an important support level to watch. Featured in yellow in the 8/28/09 Mid-Day BreakOuts Report (read here). This high-ranked leader had traded up more than +59% after it was first featured in the March 2008 CANSLIM.net News (read here), but weak action later in the year subsequently prompted it to be dropped from the Featured Stocks list. Do not be confused by the 3:1 split that took effect on 10/09/08.
>>> The latest Featured Stock Update with an annotated graph appeared on 8/28/2009. click here.
|
|
C
A
S
I |
News |
Chart |
SEC
View all notes Alert
me of new notes
Company
Profile
|
GMCR
- NASDAQ
Green Mtn Coffee Roastrs
FOOD & BEVERAGE - Processed & Packaged Goods
|
$58.37
|
-0.22
|
495,645
31% DAV
1,622,000
|
7/17/2009
(Date
Featured) |
$60.15
(Price
Featured) |
PP = $63.79 |
G |
| MB = $66.98 |
Most Recent Note - 9/3/2009 4:22:45 PM
G - A violation of its prior chart low ($54.32 on 8/18/09) would technically complete a bearish "head-and-shoulders" pattern and trigger more worrisome sell signals. Quiet consolidation continues under its 50 DMA line which is now downward sloping and a source of technical resistance. GMCR traded up more than +168% since appearing with an annotated graph under the headline "It May Soon Be Time To Go Green" when featured in the January 2009 CANSLIM.net News (read here).
>>> The latest Featured Stock Update with an annotated graph appeared on 8/26/2009. click here.
|
|
C
A
S
I |
News |
Chart |
SEC
View all notes Alert
me of new notes
Company
Profile
|
NTES
- NASDAQ
Netease Inc Adr
INTERNET - Internet Information Providers
|
$41.32
|
-0.10
|
1,714,767
78% DAV
2,205,700
|
7/17/2009
(Date
Featured) |
$39.29
(Price
Featured) |
PP = $38.74 |
G |
| MB = $40.68 |
Most Recent Note - 9/3/2009 4:26:35 PM
G - Still quietly consolidating in a tight range above support at its 50 DMA line and above prior chart highs in the $38 area. Deterioration below those levels would raise more serious concerns and triggger additional sell signals.
>>> The latest Featured Stock Update with an annotated graph appeared on 8/27/2009. click here.
|
|
C
A
S
I |
News |
Chart |
SEC
View all notes Alert
me of new notes
Company
Profile
|
NVEC
- NASDAQ
N V E Corp
ELECTRONICS - Semiconductor - Specialized
|
$52.40
|
+0.62
|
33,167
37% DAV
88,700
|
8/26/2009
(Date
Featured) |
$55.32
(Price
Featured) |
PP = $57.60 |
G |
| MB = $60.48 |
Most Recent Note - 9/3/2009 4:27:35 PM
G - Hovering just above important support at its 50 DMA line and prior chart highs with another gain on lighter volume. Color code was changed to green based on its weak action and failure to produce gains above its latest pivot point. Quarterly sales revenues in the 6 million dollar range are still rather minuscule, leaving concerns.
>>> The latest Featured Stock Update with an annotated graph appeared on 9/1/2009. click here.
|
|
C
A
S
I |
News |
Chart |
SEC
View all notes Alert
me of new notes
Company
Profile
|
PEGA
- NASDAQ
Pegasystems Inc
COMPUTER SOFTWARE & SERVICES - Business Software & Services
|
$29.71
|
+0.29
|
268,933
72% DAV
372,300
|
7/29/2009
(Date
Featured) |
$27.53
(Price
Featured) |
PP = $27.49 |
G |
| MB = $28.86 |
Most Recent Note - 9/3/2009 4:32:29 PM
G - Consolidating near an upward trendline connecting its July-August lows which may be considered an initial technical support level above its 50 DMA line and prior chart highs.
>>> The latest Featured Stock Update with an annotated graph appeared on 8/24/2009. click here.
|
|
C
A
S
I |
News |
Chart |
SEC
View all notes Alert
me of new notes
Company
Profile
|
|
|
|
THESE ARE NOT BUY RECOMMENDATIONS!
Comments contained in the body of this report are technical
opinions only. The material herein has been obtained
from sources believed to be reliable and accurate, however,
its accuracy and completeness cannot be guaranteed.
This site is not an investment advisor, hence it does
not endorse or recommend any securities or other investments.
Any recommendation contained in this report may not
be suitable for all investors and it is not to be deemed
an offer or solicitation on our part with respect to
the purchase or sale of any securities. All trademarks,
service marks and trade names appearing in this report
are the property of their respective owners, and are
likewise used for identification purposes only.
This report is a service available
only to active Paid Premium Members.
You may opt-out of receiving report notifications
at any time. Questions or comments may be submitted
by writing to Premium Membership Services 665 S.E. 10 Street, Suite 201 Deerfield Beach, FL 33441-5634 or by calling 1-800-965-8307
or 954-785-1121.
|
|
|


