***Last / Change / Volume data in this table is the closing quote data***
Symbol/Exchange
Company Name
Industry Group |
PRICE |
CHANGE
(%Change) |
Day High |
Volume
(% DAV)
(% 50 day avg vol) |
52 Wk Hi
% From Hi |
Featured
Date |
Price
Featured |
Pivot Featured |
|
Max Buy |
ABV
-
NYSE
Comp De Bebidas Adr
FOOD and BEVERAGE - Beverages - Brewers
|
$110.69
|
+2.92
2.71% |
$111.87
|
601,955
90.93% of 50 DAV
50 DAV is 662,000
|
$112.60
-1.70%
|
6/29/2010
|
$104.74
|
PP = $109.33
|
|
MB = $114.80
|
 Most Recent Note - 8/31/2010 3:54:13 PM
G - This Brazil-based beverage firm is poised for a new high close with today's gain. Found support near its 50 DMA line recently.
>>> The latest Featured Stock Update with an annotated graph appeared on 8/18/2010. Click here.
View all notes |
Alert me of new notes |
CANSLIM.net Company Profile |
SEC |
Zacks Reports |
StockTalk |
News |
Chart |
Request a new note
C
A N
S L
I M


|
ARUN
-
NASDAQ
Aruba Networks Inc
COMPUTER HARDWARE - Networking andamp; Communication Dev
|
$18.36
|
+0.30
1.66% |
$19.01
|
3,509,286
206.04% of 50 DAV
50 DAV is 1,703,200
|
$18.70
-1.82%
|
8/30/2010
|
$18.12
|
PP = $18.51
|
|
MB = $19.44
|
Most Recent Note - 8/31/2010 12:18:56 PM
Y - Hit a new 52-week high today, trading above its pivot point. Technically, its 8/27/10 gain with heavy volume helped it rally up the right side of a 5-week base during which its 50 DMA line acted as a support level. Confirming gains and a follow-through day for the major averages (M criteria) would be reassuring signs. It rebounded impressively since dropped from the Featured Stocks list on 5/06/10 as it and the broader market endured heavy distributional pressure.

>>> The latest Featured Stock Update with an annotated graph appeared on 4/29/2010. Click here.
View all notes |
Alert me of new notes |
CANSLIM.net Company Profile |
SEC |
Zacks Reports |
StockTalk |
News |
Chart |
Request a new note
C
A N
S L
I M
|
BIDU
-
NASDAQ
Baidu Inc Ads
INTERNET - Internet Information Providers
|
$78.43
|
+1.19
1.54% |
$78.94
|
7,700,696
70.04% of 50 DAV
50 DAV is 10,995,200
|
$88.32
-11.20%
|
7/14/2010
|
$75.03
|
PP = $78.59
|
|
MB = $82.52
|
Most Recent Note - 8/30/2010 5:32:29 PM
G - Negative reversal today led to a close below its 50 DMA line again.
>>> The latest Featured Stock Update with an annotated graph appeared on 8/13/2010. Click here.
View all notes |
Alert me of new notes |
CANSLIM.net Company Profile |
SEC |
Zacks Reports |
StockTalk |
News |
Chart |
Request a new note
C
A N
S L
I M
|
CACC
-
NASDAQ
Credit Acceptance Corp
FINANCIAL SERVICES - Credit Services
|
$56.65
|
-0.08
-0.14% |
$57.58
|
87,712
163.03% of 50 DAV
50 DAV is 53,800
|
$61.41
-7.75%
|
7/29/2010
|
$52.04
|
PP = $54.07
|
|
MB = $56.77
|
Most Recent Note - 8/30/2010 3:25:43 PM
G - Consolidating near its "max buy" level at its low today with volume totals recently cooling. Support to watch is its 50 DMA and old high near $54. It traded up in 19 of the past 21 months.
>>> The latest Featured Stock Update with an annotated graph appeared on 8/2/2010. Click here.
View all notes |
Alert me of new notes |
CANSLIM.net Company Profile |
SEC |
Zacks Reports |
StockTalk |
News |
Chart |
Request a new note
C
A N
S L
I M
|
CRM
-
NYSE
Salesforce.Com Inc
INTERNET - Internet Software and Services
|
$109.88
|
+0.71
0.65% |
$110.65
|
3,040,009
118.41% of 50 DAV
50 DAV is 2,567,300
|
$114.15
-3.74%
|
6/2/2010
|
$88.44
|
PP = $89.60
|
|
MB = $94.08
|
Most Recent Note - 8/30/2010 5:33:46 PM
G - Down today with below average volume. It is still extended from any sound base, not currently buyable under the investment system guidelines.
>>> The latest Featured Stock Update with an annotated graph appeared on 8/16/2010. Click here.
View all notes |
Alert me of new notes |
CANSLIM.net Company Profile |
SEC |
Zacks Reports |
StockTalk |
News |
Chart |
Request a new note
C
A N
S L
I M
|
Symbol/Exchange
Company Name
Industry Group |
PRICE |
CHANGE
(%Change) |
Day High |
Volume
(% DAV)
(% 50 day avg vol) |
52 Wk Hi
% From Hi |
Featured
Date |
Price
Featured |
Pivot Featured |
|
Max Buy |
EGO
-
NYSE
Eldorado Gold Corp
METALS and MINING - Gold
|
$19.56
|
+0.25
1.29% |
$20.06
|
6,946,570
163.91% of 50 DAV
50 DAV is 4,238,100
|
$19.72
-0.81%
|
8/19/2010
|
$18.25
|
PP = $19.17
|
|
MB = $20.13
|
Most Recent Note - 8/31/2010 12:24:36 PM
Y - Gain today for a new 52-week high amid strong leadership (L criteria) in the group. The Canada-based mining firm triggered a technical buy signal last week. However, 3 out of 4 stocks go the direction of the major averages and the M criteria argues against new buying efforts until a follow-through day confirms a new rally.
>>> The latest Featured Stock Update with an annotated graph appeared on 8/19/2010. Click here.
View all notes |
Alert me of new notes |
CANSLIM.net Company Profile |
SEC |
Zacks Reports |
StockTalk |
News |
Chart |
Request a new note
C
A N
S L
I M
|
FFIV
-
NASDAQ
F 5 Networks Inc
INTERNET - Internet Software and Services
|
$87.43
|
-1.81
-2.03% |
$89.21
|
1,385,030
82.43% of 50 DAV
50 DAV is 1,680,200
|
$92.70
-5.69%
|
6/16/2010
|
$74.50
|
PP = $74.10
|
|
MB = $77.81
|
Most Recent Note - 8/31/2010 3:50:06 PM
G - Still consolidating in an orderly fashion. Its 50 DMA and recent lows near $80 define support.
>>> The latest Featured Stock Update with an annotated graph appeared on 8/4/2010. Click here.
View all notes |
Alert me of new notes |
CANSLIM.net Company Profile |
SEC |
Zacks Reports |
StockTalk |
News |
Chart |
Request a new note
C
A N
S L
I M
|
FOSL
-
NASDAQ
Fossil Inc
CONSUMER DURABLES - Recreational Goods, Other
|
$47.49
|
-0.46
-0.96% |
$48.74
|
1,339,539
155.25% of 50 DAV
50 DAV is 862,800
|
$49.50
-4.06%
|
8/10/2010
|
$45.54
|
PP = $42.69
|
|
MB = $44.82
|
Most Recent Note - 8/31/2010 12:28:02 PM
G - Trading up today for an 8th consecutive gain, getting extended from any sound base.
>>> The latest Featured Stock Update with an annotated graph appeared on 8/11/2010. Click here.
View all notes |
Alert me of new notes |
CANSLIM.net Company Profile |
SEC |
Zacks Reports |
StockTalk |
News |
Chart |
Request a new note
C
A N
S L
I M
|
GMCR
-
NASDAQ
Green Mtn Coffee Roastrs
FOOD and BEVERAGE - Processed and Packaged Goods
|
$30.82
|
+0.64
2.12% |
$31.00
|
4,402,267
192.96% of 50 DAV
50 DAV is 2,281,400
|
$33.98
-9.30%
|
8/17/2010
|
$33.62
|
PP = $33.30
|
|
MB = $34.97
|
Most Recent Note - 8/31/2010 5:40:14 PM
G - Solid gain today with above average volume, rallying up from its 50 DMA line. Possible handle may be forming after the previously noted cup shaped pattern.
>>> The latest Featured Stock Update with an annotated graph appeared on 8/17/2010. Click here.
View all notes |
Alert me of new notes |
CANSLIM.net Company Profile |
SEC |
Zacks Reports |
StockTalk |
News |
Chart |
Request a new note
C
A N
S L
I M
|
HS
-
NYSE
Healthspring Inc
HEALTH SERVICES - Health Care Plans
|
$20.76
|
+0.41
2.01% |
$20.99
|
936,512
166.14% of 50 DAV
50 DAV is 563,700
|
$20.66
0.48%
|
8/27/2010
|
$19.91
|
PP = $19.75
|
|
MB = $20.74
|
Most Recent Note - 8/31/2010 6:16:34 PM
Y - Hit a new 52-week high today with a gain on above average volume, closing near its "max buy" level. Gapped up on 8/27/10 after announcing news that it will acquire Bravo Health for $545 million, rallying from a short flat base as it was featured in the mid-day report.
>>> The latest Featured Stock Update with an annotated graph appeared on 8/27/2010. Click here.
View all notes |
Alert me of new notes |
CANSLIM.net Company Profile |
SEC |
Zacks Reports |
StockTalk |
News |
Chart |
Request a new note
C
A N
S L
I M
|
Symbol/Exchange
Company Name
Industry Group |
PRICE |
CHANGE
(%Change) |
Day High |
Volume
(% DAV)
(% 50 day avg vol) |
52 Wk Hi
% From Hi |
Featured
Date |
Price
Featured |
Pivot Featured |
|
Max Buy |
MELI
-
NASDAQ
Mercadolibre Inc
INTERNET - Internet Software and; Services
|
$65.94
|
+1.20
1.85% |
$66.04
|
575,740
55.42% of 50 DAV
50 DAV is 1,038,800
|
$70.95
-7.06%
|
5/13/2010
|
$54.21
|
PP = $55.85
|
|
MB = $58.64
|
Most Recent Note - 8/30/2010 3:39:14 PM
G - Consolidating quietly well above prior highs in the $62 area and its 50 DMA line defining chart support. Recently noted - "The pullback may be offering investors a secondary buy point, however weakened market conditions (M criteria) are a concern now arguing against new buying effort until a new follow-through day occurs."
>>> The latest Featured Stock Update with an annotated graph appeared on 8/26/2010. Click here.
View all notes |
Alert me of new notes |
CANSLIM.net Company Profile |
SEC |
Zacks Reports |
StockTalk |
News |
Chart |
Request a new note
C
A N
S L
I M
|
MRX
-
NYSE
Medicis Pharmaceut Cl A
DRUGS - Biotechnology
|
$27.50
|
+0.27
0.99% |
$27.81
|
1,704,269
147.77% of 50 DAV
50 DAV is 1,153,300
|
$28.15
-2.31%
|
8/12/2010
|
$26.88
|
PP = $26.71
|
|
MB = $28.05
|
Most Recent Note - 8/30/2010 1:07:49 PM
Y - Rallying today near its 52-week high with little resistance remaining due to overhead supply. The high-ranked Medical - Ethical Drugs firm found support recently while consolidating near prior chart highs.
>>> The latest Featured Stock Update with an annotated graph appeared on 8/12/2010. Click here.
View all notes |
Alert me of new notes |
CANSLIM.net Company Profile |
SEC |
Zacks Reports |
StockTalk |
News |
Chart |
Request a new note
C
A N
S L
I M
|
MWIV
-
NASDAQ
M W I Veterinary Supply
HEALTH SERVICES - Medical Instruments and; Supplies
|
$53.01
|
+0.17
0.32% |
$53.39
|
61,627
78.91% of 50 DAV
50 DAV is 78,100
|
$55.46
-4.42%
|
7/29/2010
|
$52.05
|
PP = $52.09
|
|
MB = $54.69
|
Most Recent Note - 8/30/2010 5:35:40 PM
Y - Negatively reversed today after a small gap up, closing at the session low. Recent lows in the $46 area define an important chart support level.
>>> The latest Featured Stock Update with an annotated graph appeared on 7/30/2010. Click here.
View all notes |
Alert me of new notes |
CANSLIM.net Company Profile |
SEC |
Zacks Reports |
StockTalk |
News |
Chart |
Request a new note
C
A N
S L
I M
|
NEM
-
NYSE
Newmont Mining Corp
METALS and MINING - Gold
|
$61.32
|
+1.40
2.34% |
$61.92
|
7,702,892
102.83% of 50 DAV
50 DAV is 7,491,100
|
$63.38
-3.25%
|
8/31/2010
|
$61.32
|
PP = $63.48
|
|
MB = $66.65
|
Most Recent Note - 8/31/2010 6:24:56 PM
Y - Closed 61 cents off its 7/09/10 high close today with a gap up gain on average volume helping it rise further above its 50 DMA line. Color code is changed to yellow with new pivot point cited based on its 52-week high plus ten cents. Disciplined investors will watch for a confirming gain above its pivot with heavy volume and a follow-through day from one of the major averages. Leadership in the Mining - Gold/Silver/Gems group (L criteria) is a nice reassurance.
>>> The latest Featured Stock Update with an annotated graph appeared on 8/6/2010. Click here.
View all notes |
Alert me of new notes |
CANSLIM.net Company Profile |
SEC |
Zacks Reports |
StockTalk |
News |
Chart |
Request a new note
C
A N
S L
I M
|
NEOG
-
NASDAQ
Neogen Corp
DRUGS - Diagnostic Substances
|
$29.22
|
+0.64
2.24% |
$29.31
|
164,397
197.12% of 50 DAV
50 DAV is 83,400
|
$30.39
-3.85%
|
7/22/2010
|
$27.19
|
PP = $27.87
|
|
MB = $29.26
|
Most Recent Note - 8/31/2010 6:27:22 PM
Y- Consolidating -4% off its all-time high, it posted a gain today with above average volume. Recently rallied up from its 50 DMA line and prior highs in the $27 area defining important technical support.
>>> The latest Featured Stock Update with an annotated graph appeared on 8/20/2010. Click here.
View all notes |
Alert me of new notes |
CANSLIM.net Company Profile |
SEC |
Zacks Reports |
StockTalk |
News |
Chart |
Request a new note
C
A N
S L
I M
|
Symbol/Exchange
Company Name
Industry Group |
PRICE |
CHANGE
(%Change) |
Day High |
Volume
(% DAV)
(% 50 day avg vol) |
52 Wk Hi
% From Hi |
Featured
Date |
Price
Featured |
Pivot Featured |
|
Max Buy |
NFLX
-
NASDAQ
Netflix Inc
SPECIALTY RETAIL - Music and Video Stores
|
$125.52
|
+2.42
1.97% |
$126.95
|
3,440,509
78.30% of 50 DAV
50 DAV is 4,393,800
|
$140.90
-10.92%
|
8/10/2010
|
$124.05
|
PP = $124.00
|
|
MB = $130.20
|
Most Recent Note - 8/30/2010 3:33:06 PM
Y- Holding its ground, consolidating near its prior high of $124 noted as an important support level to watch. Color code was changed to yellow while finding recent support near its pivot point.
>>> The latest Featured Stock Update with an annotated graph appeared on 8/10/2010. Click here.
View all notes |
Alert me of new notes |
CANSLIM.net Company Profile |
SEC |
Zacks Reports |
StockTalk |
News |
Chart |
Request a new note
C
A N
S L
I M
|
PAY
-
NYSE
Verifone Systems Inc
COMPUTER HARDWARE - Transaction Automation Systems
|
$24.18
|
-0.73
-2.93% |
$25.00
|
1,455,113
120.59% of 50 DAV
50 DAV is 1,206,700
|
$25.12
-3.74%
|
8/25/2010
|
$24.30
|
PP = $23.74
|
|
MB = $24.93
|
Most Recent Note - 8/31/2010 3:39:09 PM
Y - Pulling back today from its 52-week high, its color code is changed to yellow while consolidating under its "max buy" level. Blasted higher on 8/25/10 following better than expected results, noted in the mid-day report (read here) while then rising from a cup-with-handle base - "Long ago, based on disappointing fundamental news and very weak technical action, it was dropped from the Featured Stocks list on 12/3/2007 as it gapped down for a considerable loss after the company said it would restate its earnings for the past three quarters, with the added warning that revelations of deeper problems may follow. It has rebounded impressively and is now clear of overhead supply after a powerful technical breakout with 6 times average volume, however the M criteria is now arguing against new buying efforts until a new follow-through day occurs from at least one of the major averages."
>>> The latest Featured Stock Update with an annotated graph appeared on 8/30/2010. Click here.
View all notes |
Alert me of new notes |
CANSLIM.net Company Profile |
SEC |
Zacks Reports |
StockTalk |
News |
Chart |
Request a new note
C
A N
S L
I M
|
ROVI
-
NASDAQ
Rovi Corp
COMPUTER SOFTWARE andamp; SERVICES - Security Software andamp; Services
|
$43.51
|
+1.46
3.47% |
$43.63
|
1,320,952
116.44% of 50 DAV
50 DAV is 1,134,400
|
$44.96
-3.23%
|
8/31/2010
|
$43.31
|
PP = $45.06
|
|
MB = $47.31
|
Most Recent Note - 8/31/2010 3:43:19 PM
Y - Rallying up from support at its 50 DMA line. Color code is changed to yellow with new pivot point cited while building a base-on-base type pattern.
>>> The latest Featured Stock Update with an annotated graph appeared on 8/24/2010. Click here.
View all notes |
Alert me of new notes |
CANSLIM.net Company Profile |
SEC |
Zacks Reports |
StockTalk |
News |
Chart |
Request a new note
C
A N
S L
I M
|
SHOO
-
NASDAQ
Steven Madden Limited
CONSUMER NON-DURABLES - Textile - Apparel Footwear
|
$34.40
|
+0.35
1.01% |
$34.66
|
286,256
66.57% of 50 DAV
50 DAV is 430,000
|
$40.98
-16.07%
|
8/5/2010
|
$39.55
|
PP = $41.08
|
|
MB = $43.13
|
Most Recent Note - 8/30/2010 3:23:38 PM
G - Considerable loss today, violating its 50 DMA line and recent lows, raising concerns. The next support is at its 200 DMA line and prior chart lows in the $30 area.
>>> The latest Featured Stock Update with an annotated graph appeared on 8/5/2010. Click here.
View all notes |
Alert me of new notes |
CANSLIM.net Company Profile |
SEC |
Zacks Reports |
StockTalk |
News |
Chart |
Request a new note
C
A N
S L
I M
|
SLW
-
NYSE
Silver Wheaton Corp
METALS and; MINING - Silver
|
$22.56
|
-0.30
-1.31% |
$23.58
|
8,026,336
173.97% of 50 DAV
50 DAV is 4,613,700
|
$23.18
-2.67%
|
8/25/2010
|
$21.40
|
PP = $21.99
|
|
MB = $23.09
|
Most Recent Note - 8/31/2010 12:38:47 PM
Y - Hit another new all-time high today amid strength in the group, trading near its "max buy" level. The M criteria remains a concern until a follow-through day confirms a new rally.
>>> The latest Featured Stock Update with an annotated graph appeared on 8/25/2010. Click here.
View all notes |
Alert me of new notes |
CANSLIM.net Company Profile |
SEC |
Zacks Reports |
StockTalk |
News |
Chart |
Request a new note
C
A N
S L
I M
|
Symbol/Exchange
Company Name
Industry Group |
PRICE |
CHANGE
(%Change) |
Day High |
Volume
(% DAV)
(% 50 day avg vol) |
52 Wk Hi
% From Hi |
Featured
Date |
Price
Featured |
Pivot Featured |
|
Max Buy |
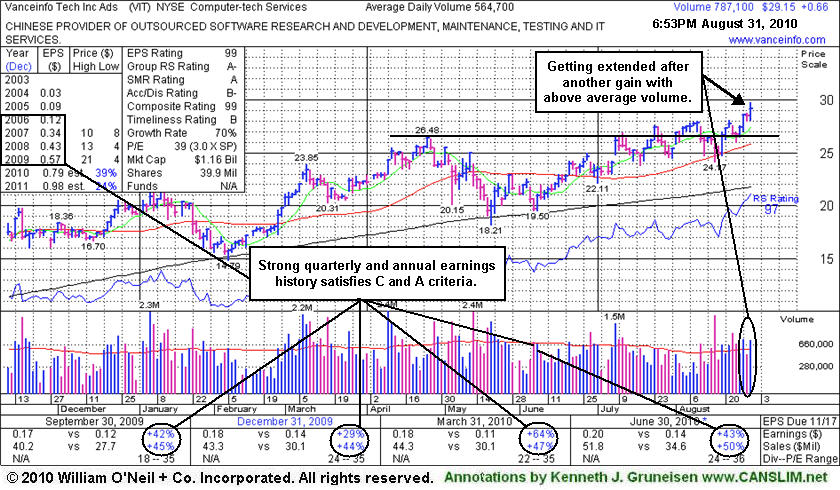
VIT
-
NYSE
Vanceinfo Tech Inc Ads
COMPUTER SOFTWARE and SERVICES - Business Software and Services
|
$29.15
|
+0.66
2.32% |
$29.74
|
787,071
140.12% of 50 DAV
50 DAV is 561,700
|
$28.79
1.25%
|
7/8/2010
|
$25.20
|
PP = $26.58
|
|
MB = $27.91
|
Most Recent Note - 8/31/2010 12:47:03 PM
G - Hitting another new all-time high today. Gain on 8/27/10 with +50% above average volume helped it rally to a new all-time high and close above its "max buy" level. Color code was changed to green. No resistance remains due to overhead supply.
>>> The latest Featured Stock Update with an annotated graph appeared on 8/31/2010. Click here.
View all notes |
Alert me of new notes |
CANSLIM.net Company Profile |
SEC |
Zacks Reports |
StockTalk |
News |
Chart |
Request a new note
C
A N
S L
I M
|
WCRX
-
NASDAQ
Warner Chilcott Plc
DRUGS - Drug Manufacturers - Other
|
$28.42
|
-0.20
-0.70% |
$28.97
|
1,605,611
93.30% of 50 DAV
50 DAV is 1,720,900
|
$30.57
-7.03%
|
8/23/2010
|
$29.54
|
PP = $29.34
|
|
MB = $30.81
|
Most Recent Note - 8/27/2010 6:24:02 PM
Y - Posted a gain today with heavy volume, yet it ended the session still below its pivot point after 2 prior losses on lighter volume. It was featured in yellow in the mid-day report on 8/23/10 (read here), rising from a cup shaped base.
>>> The latest Featured Stock Update with an annotated graph appeared on 8/23/2010. Click here.
View all notes |
Alert me of new notes |
CANSLIM.net Company Profile |
SEC |
Zacks Reports |
StockTalk |
News |
Chart |
Request a new note
C
A N
S L
I M
|