You are not logged in.
This means
you CAN ONLY VIEW reports that were published prior to Sunday, April 6, 2025.
You
MUST UPGRADE YOUR MEMBERSHIP if you want to see any current reports.
 MIDDAY BREAKOUTS REPORT - WEDNESDAY, SEPTEMBER 1ST, 2010 MIDDAY BREAKOUTS REPORT - WEDNESDAY, SEPTEMBER 1ST, 2010
Previous Mid Day Report Next Mid Day Report >>>
|
|
DOW 10247.98 233.26 (2.33%) | NASDAQ 2171.03 57 (2.70%) | S&P 500 1078.02 28.69 (2.73%)
|
Time of Screening :
9/1/2010 12:28:03 PM Report Released :
9/1/2010 1:33:27 PM
Price is:
Above 52W High and Less Than 52W High
but within 5% of the 52 Week High
Volume Is:
At least 75% of 50 Day Average at
the time of the screening.
More details about this report...
At around
mid-way through each trading day we run
a screen against our database of
high-ranked stocks, searching for
possible buy candidates that are trading
at or near their 52-week high on above
average volume. The results of that
screen are split into the two sections
you see below. The first, titled
"TODAY's FEATURED STOCKS" shows stocks
that our experts have recently
identified as among the strongest candidates to
consider. Stocks highlighted in yellow
are the most timely and noteworthy, so
particular attention and prompt action
may be appropriate. The second section,
titled "TODAY's BREAKOUT SCREEN" shows
the remainder of stocks meeting today's
screen parameters. Our experts have
reviewed and included notes on these
stocks as well, but found that they may
not match up as favorably.
|
|
Y - Today's strongest
candidates
highlighted
by our staff
of experts.
|
|
G - Previously featured in
this report as yellow and
now may no longer be buyable
under the guidelines.
|
|
|
Symbol/Exchange
Company Name
Industry Group |
PRICE |
CHANGE
(%Change) |
Day High |
Volume
(% DAV)
(50 DAV) |
52 Wk Hi
% From Hi |
Date
Featured |
Price
Featured |
Pivot Point |
|
Max Buy |
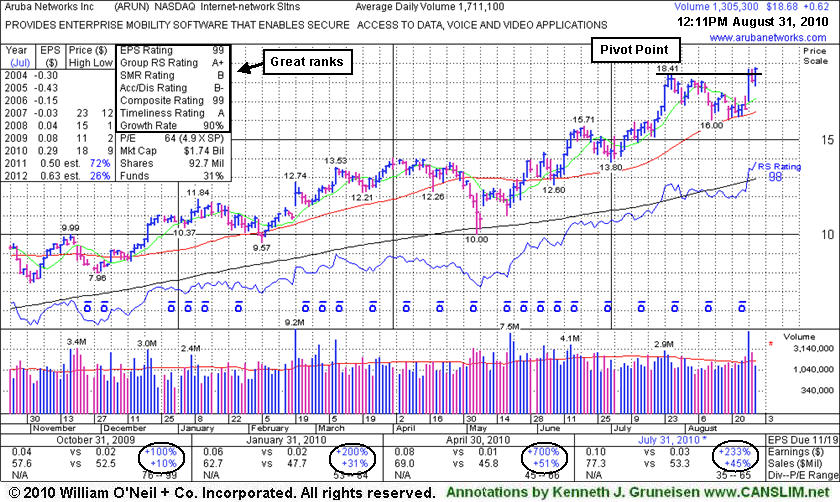
ARUN
- NASDAQ
Aruba Networks Inc
|
$19.15
|
+0.79
4.28%
|
$19.32
|
1,519,461
88.80% of 50 DAV
50 DAV is 1,711,100
|
$19.32
-0.91%
|
8/30/2010 |
$18.12
|
PP = $18.51
MB = $19.44 |
Most Recent Note - 9/1/2010 12:38:50 PM
Y - Hitting another new 52-week high today, trading above its pivot point. Its prior session close was below the pivot point cited. Technically, its 8/27/10 gain with heavy volume helped it rally up the right side of a 5-week base during which its 50 DMA line acted as a support level. Confirming gains and a follow-through day for the major averages (M criteria) would be reassuring signs. It rebounded impressively since dropped from the Featured Stocks list on 5/06/10 as it and the broader market endured heavy distributional pressure.
>>> The latest Featured Stock Update with an annotated graph appeared on 4/29/2010. Click here.
|
|
View all notes |
Alert me of new notes |
Company Profile |
SEC |
News |
Chart | C
A N
S L
I M
|
CMG
- NYSE
Chipotle Mexican Grill
|
$158.31
|
+7.48
4.96%
|
$158.46
|
881,501
128.20% of 50 DAV
50 DAV is 687,600
|
$158.45
-0.09%
|
9/1/2010 |
$158.31
|
PP = $155.52
MB = $163.30 |
Most Recent Note - 9/1/2010 12:44:55 PM
Y - Rallying to multi-year highs today with a considerable gain backed by above average volume and color code is changed to yellow with pivot point based on its 52-week high plus 10 cents. Sales revenues increases have shown acceleration while up +12%, +16%, +20% in recent quarterly comparisons while the C criteria is satisfied by earnings increases above the +25% guideline and it has a good annual (A criteria) earnings history. Noted in prior mid-day reports -"rebounded considerably after a very deep correction, falling from $123 when it was dropped from the Featured Stocks list 1/7/08, to as low as $36 in November '08."
>>> The latest Featured Stock Update with an annotated graph appeared on 11/14/2007. Click here.
|
|
View all notes |
Alert me of new notes |
Company Profile |
SEC |
News |
Chart | C
A N
S L
I M
|
CRM
- NYSE
Salesforce.com Inc
|
$115.53
|
+5.65
5.14%
|
$115.73
|
2,476,821
96.69% of 50 DAV
50 DAV is 2,561,500
|
$115.94
-0.35%
|
6/2/2010 |
$88.44
|
PP = $89.60
MB = $94.08 |
Most Recent Note - 9/1/2010 12:47:20 PM
G - Gapped up today and rallied for a new all-time high. It is extended from a sound base, not currently buyable under the investment system guidelines.
>>> The latest Featured Stock Update with an annotated graph appeared on 8/16/2010. Click here.
|
|
View all notes |
Alert me of new notes |
Company Profile |
SEC |
News |
Chart | C
A N
S L
I M
|
EGO
- NYSE
Eldorado Gold Corp
|
$19.11
|
-0.45
-2.30%
|
$19.85
|
3,933,049
96.44% of 50 DAV
50 DAV is 4,078,400
|
$20.06
-4.74%
|
8/19/2010 |
$18.25
|
PP = $19.17
MB = $20.13 |
Most Recent Note - 9/1/2010 12:54:31 PM
Y - Pulling back today near its pivot point following a recent streak of volume-driven gains to new 52-week highs amid strong leadership (L criteria) in the group. The Canada-based mining firm triggered a technical buy signal last week. Gains today for the major averages (M criteria) have the look of a solid follow-through day confirming a new rally.
>>> The latest Featured Stock Update with an annotated graph appeared on 8/19/2010. Click here.
|
|
View all notes |
Alert me of new notes |
Company Profile |
SEC |
News |
Chart | C
A N
S L
I M
|
HS
-
|
$21.55
|
+0.79
3.81%
|
$21.82
|
450,771
78.35% of 50 DAV
50 DAV is 575,300
|
$21.82
-1.24%
|
8/27/2010 |
$19.91
|
PP = $19.75
MB = $20.74 |
Most Recent Note - 9/1/2010 1:02:04 PM
G - Gapped up today and hit another new 52-week high, and its color code is changed to green after rallying beyond its "max buy" level. Gapped up on 8/27/10 after announcing news that it will acquire Bravo Health for $545 million, rallying from a short flat base as it was featured in the mid-day report.
>>> The latest Featured Stock Update with an annotated graph appeared on 8/27/2010. Click here.
|
|
View all notes |
Alert me of new notes |
Company Profile |
SEC |
News |
Chart | C
A N
S L
I M
|
MRX
-
|
$28.47
|
+0.97
3.53%
|
$28.65
|
961,298
82.91% of 50 DAV
50 DAV is 1,159,400
|
$28.65
-0.62%
|
8/12/2010 |
$26.88
|
PP = $26.71
MB = $28.05 |
Most Recent Note - 9/1/2010 1:10:45 PM
Y - Gapped up today and hit a new 52-week high amid widespread strength which has the current session looking like a follow-through day (good for the M criteria). The high-ranked Medical - Ethical Drugs firm found support recently while consolidating near prior chart highs.
>>> The latest Featured Stock Update with an annotated graph appeared on 8/12/2010. Click here.
|
|
View all notes |
Alert me of new notes |
Company Profile |
SEC |
News |
Chart | C
A N
S L
I M
|
PAY
- NYSE
Paymentus Holdings
|
$25.77
|
+1.59
6.58%
|
$25.90
|
1,067,925
86.94% of 50 DAV
50 DAV is 1,228,400
|
$25.90
-0.50%
|
8/25/2010 |
$24.30
|
PP = $23.74
MB = $24.93 |
Most Recent Note - 9/1/2010 1:15:12 PM
G - Hit a new 52-week high today and its color code is changed to green after rising beyond its "max buy" level. Blasted higher on 8/25/10 following better than expected results, noted in the mid-day report while then rising from a cup-with-handle base.
>>> The latest Featured Stock Update with an annotated graph appeared on 8/30/2010. Click here.
|
|
View all notes |
Alert me of new notes |
Company Profile |
SEC |
News |
Chart | C
A N
S L
I M
|
VIT
-
|
$28.49
|
-0.66
-2.26%
|
$29.80
|
483,477
85.62% of 50 DAV
50 DAV is 564,700
|
$29.80
-4.40%
|
7/8/2010 |
$25.20
|
PP = $26.58
MB = $27.91 |
Most Recent Note - 9/1/2010 1:30:42 PM
G - Pulling back today from its all-time high. Patient investors may watch for secondary buy points. Recent gains lifted it more than +5% above its old chart highs.
>>> The latest Featured Stock Update with an annotated graph appeared on 8/31/2010. Click here.
|
|
View all notes |
Alert me of new notes |
Company Profile |
SEC |
News |
Chart | C
A N
S L
I M
|
|
 |
Symbol - Exchange - Industry Group
Company Name |
Last |
Chg |
Day
High |
52 WK Hi |
% From Hi |
Volume
% DAV |
DAV |
ABX
- NYSE - METALS & MINING - Gold
Barrick Gold Corporation
|
$45.69 |
-1.07
-2.29%
|
$47.56
|
$48.02
|
-4.85% |
6,230,833
75.73%
|
8,227,900
|
Most Recent Note for ABX - 9/1/2010 12:31:55 PM
Recently challenging its 52-week high. Its annual earnings (A criteria) history has been up and down while recent quarterly comparisons showed strong sales and earnings growth. Leadership in the Mining - Gold/Silver/gems group (L criteria) is very reassuring.
|
|
View all notes |
Alert me of new notes |
Company Profile |
SEC |
News |
Chart | C
A N
S L
I M
|
ARMH
- NASDAQ - ELECTRONICS - Semiconductor - Specialized
A R M Holdings Plc Ads
|
$17.03 |
+0.38
2.28%
|
$17.44
|
$17.44
|
-2.35% |
2,349,622
90.07%
|
2,608,600
|
Most Recent Note for ARMH - 9/1/2010 12:35:48 PM
Gapped up today and hit another new 52-week high. Noted in the 8/31/10 mid-day report - "After basing above its 50 DMA line for about 5 weeks since gapping up on 7/23/10. Recent quarters show improving sales and earnings however its prior comparisons and annual earnings history (A criteria) are below the guidelines of the fact based investment system."
|
|
View all notes |
Alert me of new notes |
Company Profile |
SEC |
News |
Chart | C
A N
S L
I M
|
CASY
- NASDAQ - RETAIL - Super/Mini Markets
Caseys General Stores
|
$38.72 |
+1.10
2.92%
|
$39.05
|
$39.56
|
-2.12% |
1,397,296
120.97%
|
1,155,100
|
Most Recent Note for CASY - 9/1/2010 12:39:13 PM
Consolidating since its gap up on 4/09/10 on merger/acquisition news.
|
|
View all notes |
Alert me of new notes |
Company Profile |
SEC |
News |
Chart | C
A N
S L
I M
|
EC
- NYSE - ENERGY - Independent Oil & Gas
Ecopetrol Sa Adr
|
$39.30 |
+0.57
1.47%
|
$39.30
|
$39.41
|
-0.28% |
128,982
80.46%
|
160,300
|
Most Recent Note for EC - 9/1/2010 12:49:09 PM
Gain today for a new all-time high. Noted in recent mid-day reports - "Very extended from a sound base after clearing resistance at the $30 level. Columbian Oil and Gas - Integrated firm reported strong sales and earnings increases for the quarter ended June 30, 2010 versus the year earlier period. Recent quarterly comparisons have shown great improvement, but its prior quarterly and annual earnings history has been below guidelines of the fact-based system."
|
|
View all notes |
Alert me of new notes |
Company Profile |
SEC |
News |
Chart | C
A N
S L
I M
|
EE
- NYSE - Utility-Gas Distribution
Excelerate Energy Cl A
|
$23.60 |
+0.65
2.83%
|
$23.63
|
$23.63
|
-0.13% |
241,279
83.92%
|
287,500
|
Most Recent Note for EE - 9/1/2010 12:50:50 PM
Hit a new 52-week high today. Noted in 8/25/10 mid-day report - "Recent quarters show improving earnings but its sales and prior earnings history are below the investment system's guidelines. Current earnings per share should be up 25% or more and in many cases accelerating in recent quarters. Quarterly sales should also be up 25% or more or accelerating over prior quarters."
|
|
View all notes |
Alert me of new notes |
Company Profile |
SEC |
News |
Chart | C
A N
S L
I M
|
FIZZ
- NASDAQ - FOOD & BEVERAGE - Beverages - Soft Drinks
National Beverage Corp
|
$14.78 |
+0.44
3.07%
|
$14.81
|
$14.81
|
-0.20% |
50,708
75.01%
|
67,600
|
Most Recent Note for FIZZ - 9/1/2010 12:58:08 PM
Hit a new 52-week high today, which may interest technical traders. However, quarterly sales revenues increases in the +1-6% range for the past 8 comparisons versus the year ago period are an indication there has not been great growth in demand for its products.
|
|
View all notes |
Alert me of new notes |
Company Profile |
SEC |
News |
Chart | C
A N
S L
I M
|
FMX
- NYSE - FOOD & BEVERAGE - Beverages - Brewers
Fomento Econ Mex Sab Ads
|
$50.01 |
+1.31
2.69%
|
$50.11
|
$50.43
|
-0.83% |
977,785
127.75%
|
765,400
|
Most Recent Note for FMX - 9/1/2010 1:00:04 PM
Still stubbornly holding its ground within close striking distance of its 52-week high. Found support near its 50 and 200 DMA lines recently. As noted in prior mid-day reports - "Recent quarterly comparisons showed earnings improving but its annual earnings history (A criteria) included a downward turn in FY '08. Technically the $49-50 area has been a stubborn multi-year resistance level."
|
|
View all notes |
Alert me of new notes |
Company Profile |
SEC |
News |
Chart | C
A N
S L
I M
|
INTU
- NASDAQ - COMPUTER SOFTWARE & SERVICES - Application Software
Intuit Inc
|
$43.46 |
+0.72
1.69%
|
$43.80
|
$44.85
|
-3.10% |
3,815,656
96.90%
|
3,937,800
|
Most Recent Note for INTU - 9/1/2010 1:02:56 PM
Holding its ground near its 52-week high since its considerable gap up gain on 8/20/10. Its recently quarterly comparisons showed earnings growth below guidelines while sales revenues have gradually accelerated. It has a good annual earnings (A criteria) history.
|
|
View all notes |
Alert me of new notes |
Company Profile |
SEC |
News |
Chart | C
A N
S L
I M
|
MCRS
- NASDAQ - COMPUTER SOFTWARE & SERVICES - Technical & System Software
Micros Systems Inc
|
$38.51 |
+0.41
1.08%
|
$38.77
|
$40.04
|
-3.82% |
404,982
120.42%
|
336,300
|
Most Recent Note for MCRS - 9/1/2010 1:07:22 PM
Holding its ground above prior chart highs in the $37-38 area. It hit a new 52-week high and multi-year high when its breakaway gap was noted in the 8/27/10 mid-day report - "Its recent quarterly comparisons showed improving sales revenues and earnings increases after a streak of negative comparisons. It sank as lows as $13.34 from $29.91 when it was dropped from the Featured Stocks list on 5/01/08."
|
|
View all notes |
Alert me of new notes |
Company Profile |
SEC |
News |
Chart | C
A N
S L
I M
|
MSB
- NYSE - FINANCIAL SERVICES - Diversified Investments
Mesabi Trust
|
$28.65 |
+1.37
5.02%
|
$28.75
|
$28.75
|
-0.35% |
264,574
170.14%
|
155,500
|
Most Recent Note for MSB - 9/1/2010 1:12:04 PM
Hit a new 52-week high today. Recent mid-day report appearances when rising from a cup-with-handle type base pattern noted - "The 2 latest quarters showed better increases but prior quarters and annual earnings history has been below guidelines of the fact-based investment system."
|
|
View all notes |
Alert me of new notes |
Company Profile |
SEC |
News |
Chart | C
A N
S L
I M
|
NI
- NYSE - UTILITIES - Diversified Utilities
Nisource Inc
|
$17.65 |
+0.29
1.67%
|
$17.75
|
$17.75
|
-0.56% |
4,501,488
150.73%
|
2,986,400
|
Most Recent Note for NI - 9/1/2010 1:12:52 PM
Gapped up today for a new 52-week high. Noted in recent mid-day reports - "Erratic sales revenues and earnings history is below guidelines of the fact-based investment system."
|
|
View all notes |
Alert me of new notes |
Company Profile |
SEC |
News |
Chart | C
A N
S L
I M
|
SAN
- NYSE - BANKING - Foreign Regional Banks
Banco Santander Sa Adr
|
$89.70 |
+3.38
3.92%
|
$89.80
|
$89.83
|
-0.14% |
121,847
75.12%
|
162,200
|
Most Recent Note for SAN - 9/1/2010 1:19:31 PM
Hit a new 52-week high today, rising from a short flat base. The Chilean bank has a good annual earnings (A criteria) history and has shown great earnings increases in some recent quarterly comparisons. Sales revenues increases have not been strong and steady and included a recent streak of 5 quarters with negative sales growth.
|
|
View all notes |
Alert me of new notes |
Company Profile |
SEC |
News |
Chart | C
A N
S L
I M
|
TRS
- NASDAQ - MANUFACTURING - Diversified
Trimas Corp
|
$13.87 |
+0.98
7.60%
|
$14.04
|
$14.04
|
-1.21% |
192,417
90.63%
|
212,300
|
Most Recent Note for TRS - 9/1/2010 1:22:53 PM
It matched its 52-week high yet again today. Its consolidation above prior highs included a brief violation of its 50 DMA line. It has a history of healthy base-on-base type patterns over the past year. Noted in prior mid-day reports - "It is up more than 10-fold from a low below $1.00 in March '09. Quarterly and annual sales and earnings history is below guidelines of the fact-based system."
|
|
View all notes |
Alert me of new notes |
Company Profile |
SEC |
News |
Chart | C
A N
S L
I M
|
UGP
- NYSE - SPECIALTY RETAIL - Specialty Retail, Other
Ultrapar Participaco Adr
|
$55.87 |
+0.30
0.54%
|
$56.59
|
$56.59
|
-1.27% |
64,499
88.84%
|
72,600
|
Most Recent Note for UGP - 9/1/2010 1:26:48 PM
Hit a new 52-week high today. When consolidating above prior chart highs in the $51 area (8/12/10) and then rising (8/16/10) it was noted in mid-day reports - "This Brazilian Oil and Gas - Refining/Marketing firm showed strong sales and earning increases in recent quarterly comparisons versus the year ago period. Its annual earnings (A criteria) growth has not been strong and steady."
|
|
View all notes |
Alert me of new notes |
Company Profile |
SEC |
News |
Chart | C
A N
S L
I M
|
VGR
- NYSE - TOBACCO - Cigarettes
Vector Group Ltd
|
$19.11 |
+0.06
0.31%
|
$19.28
|
$19.30
|
-0.98% |
245,906
77.77%
|
316,200
|
Most Recent Note for VGR - 9/1/2010 1:28:02 PM
Holding its ground stubbornly in a tight range near its 52-week high for the past 6 weeks. Noted in recent mid-day reports - "This Tobacco firm's earnings history is below the fact-based system's guidelines."
|
|
View all notes |
Alert me of new notes |
Company Profile |
SEC |
News |
Chart | C
A N
S L
I M
|
YUM
- NYSE - LEISURE - Restaurants
Yum! Brands Inc
|
$42.15 |
+0.45
1.08%
|
$42.34
|
$44.00
|
-4.20% |
3,151,869
77.13%
|
4,086,600
|
Most Recent Note for YUM - 9/1/2010 1:33:00 PM
Consolidating above support near its 50 DMA line, prior chart highs in the $43-44 area define a stubborn resistance level. Sales and earnings are well below guidelines of the fact-based investment system.
|
|
View all notes |
Alert me of new notes |
Company Profile |
SEC |
News |
Chart | C
A N
S L
I M
|
|
|
|
THESE ARE NOT BUY RECOMMENDATIONS!
Comments contained in the body of this report are technical
opinions only. The material herein has been obtained
from sources believed to be reliable and accurate, however,
its accuracy and completeness cannot be guaranteed.
We are not an investment advisor, hence it does
not endorse or recommend any securities or other investments.
Any recommendation contained in this report may not
be suitable for all investors and it is not to be deemed
an offer or solicitation on our part with respect to
the purchase or sale of any securities. All trademarks,
service marks and trade names appearing in this report
are the property of their respective owners, and are
likewise used for identification purposes only.
This report is a service available
only to active Paid Premium Members.
You may opt-out of receiving report notifications
at any time. Questions or comments may be submitted
by writing to FactBasedInvesting.com c/o Premium
Member Services 665 S.E. 10 Street, Suite 201
Deerfield Beach, FL 33441-5634 or by calling 954-785-1121.
We appreciate any feedback
members may wish to send via the inquiry form
here.
|
|
|


