You are not logged in.
This means you
CAN ONLY VIEW reports that were published prior to Monday, April 14, 2025.
You
MUST UPGRADE YOUR MEMBERSHIP if you want to see any current reports.
AFTER MARKET UPDATE - TUESDAY, AUGUST 30TH, 2011
Previous After Market Report Next After Market Report >>>
|
|
|
|
DOW |
+20.70 |
11,559.95 |
+0.18% |
|
Volume |
1,017,231,090 |
+12% |
|
Volume |
1,825,461,560 |
+15% |
|
NASDAQ |
+14.00 |
2,576.11 |
+0.55% |
|
Advancers |
1,865 |
60% |
|
Advancers |
1,321 |
50% |
|
S&P 500 |
+2.84 |
1,212.92 |
+0.23% |
|
Decliners |
1,127 |
36% |
|
Decliners |
1,207 |
46% |
|
Russell 2000 |
+3.43 |
728.08 |
+0.47% |
|
52 Wk Highs |
41 |
|
|
52 Wk Highs |
26 |
|
|
S&P 600 |
+1.82 |
397.05 |
+0.46% |
|
52 Wk Lows |
4 |
|
|
52 Wk Lows |
22 |
|
|
 |
Major Averages Manage Positive Reversal With Expansion in New Highs
Kenneth J. Gruneisen - Passed the CAN SLIM® Master's Exam
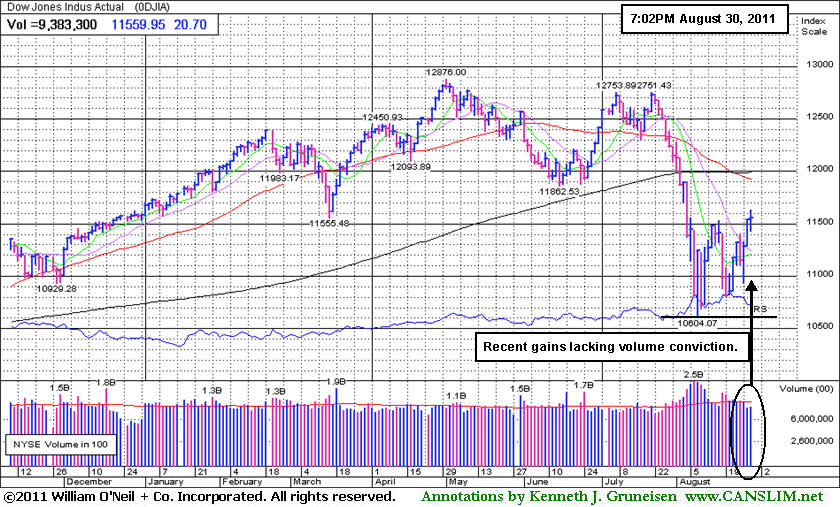
The Dow Jones Industrial Average, S&P 500 Index, and Nasdaq Composite Index overcame early losses and tallied unanimous gains on Tuesday, but the major indices finished well off their respective intra-day highs. Coupled with the positive reversal, higher volume totals were reported on the NYSE and on the Nasdaq exchange, revealing better buying conviction coming from the institutional crowd. Breadth was slightly positive as advancing issues led decliners by 3-2 on the NYSE and by a narrow 12-11 margin on the Nasdaq exchange. On the NYSE and on the Nasdaq exchange new 52-week highs outnumbered new 52-week lows, marking the first time since July 25th that new 52-week highs outnumbered the new 52-week lows on both major stock exchanges. There were 27 high-ranked companies from the CANSLIM.net Leaders List that made new 52-week highs and appeared on the CANSLIM.net BreakOuts Page, up from the prior session total of 22 stocks. Any sustainable rally requires a healthy crop of strong leaders hitting new 52-week highs, so the further expansion in the new highs list was a welcome and reassuring sign of heartier leadership. There were gains for 6 of the 7 high-ranked leaders currently included on the Featured Stocks Page.
The stock market crawled out of an early morning hole and closed higher on hopes the Federal Reserve is ready to take more action to stimulate the economy. The minutes of the Fed meeting in August revealed that some members felt economic conditions favored something more than a pledge to hold interest rates low. Economic data out this morning buttressed that view. August consumer confidence dropped to the lowest level in more than two years and was much weaker than expected.
The S&P Case Shiller index of property values in twenty cities declined -4.5% in June compared to a year earlier. The inability of home prices to stabilize remains a major headwind for the overall housing sector. Homebuilding stocks rose in spite of the report.
Telecommunications and industrial shares also fared well. Caterpillar Inc (CAT +1.9%) added 18 points to the Dow Industrials. Boeing Co (BA +2.2%) rose after the aircraft maker said it received approval from its board to build a version of its 737 jet with a redesigned engine. Dollar General Corp (DG +5.8%) rose after boosting its revenue forecast.
The market environment (M criteria) is currently in a confirmed uptrend. However, the new rally has endured a distribution day, and while leadership (stocks hitting new 52-week highs) improved, the quieter volume hints that buying demand from the institutional crowd may not be sufficient strength to allow the major averages to sustain a meaningful advance. The indices also remain well below their respective 200-day moving average (DMA) lines, and to be considered truly "healthy" they would need to rebound above their long-term averages.
The September 2011 issue of CANSLIM.net News will be available soon. The Q3 2011 Webcast has also been scheduled for Wednesday, September 28th at 8PM EST. Links to all prior reports and webcasts are available on the Premium Member Homepage.
PICTURED: The Dow Jones Industrial Average has recently rallied without great volume conviction.
|
 Kenneth J. Gruneisen started out as a licensed stockbroker in August 1987, a couple of months prior to the historic stock market crash that took the Dow Jones Industrial Average down -22.6% in a single day. He has published daily fact-based fundamental and technical analysis on high-ranked stocks online for two decades. Through FACTBASEDINVESTING.COM, Kenneth provides educational articles, news, market commentary, and other information regarding proven investment systems that work in good times and bad.
Comments contained in the body of this report are technical opinions only and are not necessarily those of Gruneisen Growth Corp. The material herein has been obtained from sources believed to be reliable and accurate, however, its accuracy and completeness cannot be guaranteed. Our firm, employees, and customers may effect transactions, including transactions contrary to any recommendation herein, or have positions in the securities mentioned herein or options with respect thereto. Any recommendation contained in this report may not be suitable for all investors and it is not to be deemed an offer or solicitation on our part with respect to the purchase or sale of any securities. |
|
 |
Defensive Groups Rose While Financials Backpedaled
Kenneth J. Gruneisen - Passed the CAN SLIM® Master's Exam
Defensive groups fared well as the Healthcare Index ($HMO +1.22%) and Gold & Silver Index ($XAU +1.49%) posted gains. Meanwhile, the Bank Index ($BKX -0.95%) and Broker/Dealer Index ($XBD -0.68%) backpedaled, even while most other groups finished with a positive bias on Tuesday's session. Modest gains in energy-related shares helped the Integrated Oil Index ($XOI +0.35%) and the Oil Services Index ($OSX +0.76%) rise, and the Retail Index ($RLX +0.39%) also posted a small gain. The Internet Index ($IIX +1.38%), Biotechnology Index ($BTK +1.16%), and Networking Index ($NWX +0.38%) posted gains while the Semiconductor Index ($SOX -0.06%) finished flat.
Charts courtesy www.stockcharts.com
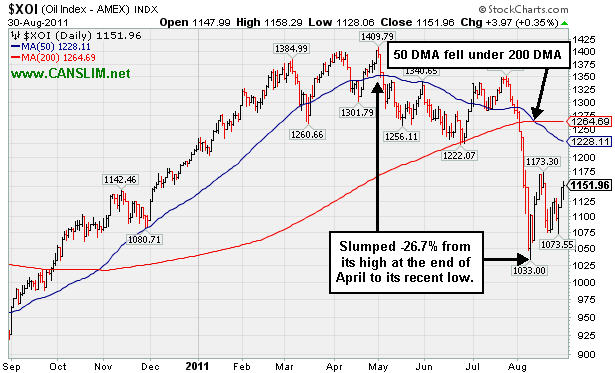
PICTURED: The Integrated Oil Index ($XOI +0.35%) slumped -26.7% from its high at the end of April to its recent low. Its 50-day moving average (DMA) line recently slumped below its 200 DMA line, technically termed a "death cross".
| Oil Services |
$OSX |
235.55 |
+1.77 |
+0.76% |
-3.90% |
| Healthcare |
$HMO |
2,076.97 |
+25.10 |
+1.22% |
+22.75% |
| Integrated Oil |
$XOI |
1,151.96 |
+3.97 |
+0.35% |
-5.05% |
| Semiconductor |
$SOX |
358.23 |
-0.21 |
-0.06% |
-13.01% |
| Networking |
$NWX |
241.18 |
+0.91 |
+0.38% |
-14.03% |
| Internet |
$IIX |
286.23 |
+3.88 |
+1.38% |
-6.98% |
| Broker/Dealer |
$XBD |
91.47 |
-0.63 |
-0.68% |
-24.73% |
| Retail |
$RLX |
513.10 |
+1.99 |
+0.39% |
+0.93% |
| Gold & Silver |
$XAU |
218.51 |
+3.20 |
+1.49% |
-3.56% |
| Bank |
$BKX |
39.47 |
-0.38 |
-0.95% |
-24.40% |
| Biotech |
$BTK |
1,192.26 |
+13.70 |
+1.16% |
-8.12% |
|
|
|
 |
Smart Investors May Reconsider Rallying Retailer
Kenneth J. Gruneisen - Passed the CAN SLIM® Master's Exam
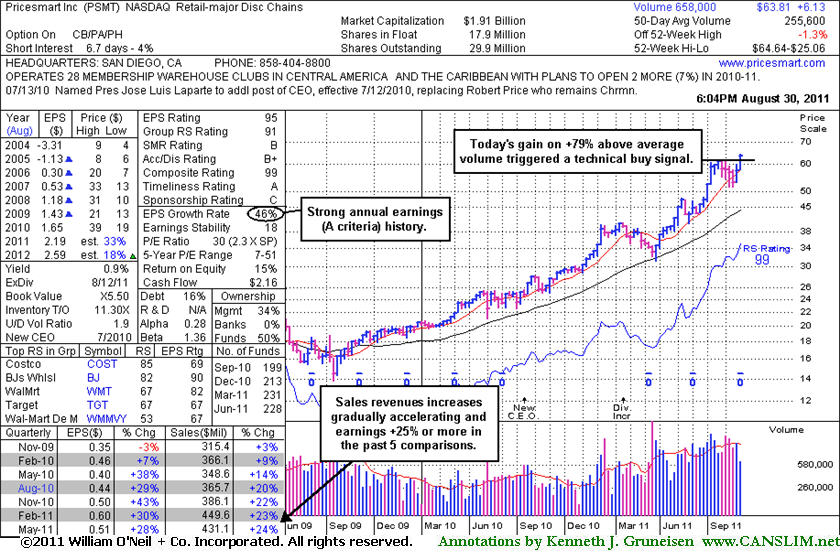
Pricesmart Inc (PSMT +$2.01 or +3.25% to $63.81) hit a new 52-week high with today's 3rd consecutive gain. Its color code was changed to yellow and a new pivot point was cited in the mid-day report, and its strong finish with +79% above average volume helped it clear a "square box" base formed over the past 5 weeks. The weekly graph below shows that this high-ranked leader in the Retail - Major Discount Chains group rebounded promptly after undercutting prior chart lows and slumping below its 50-day moving average (DMA) line when last noted on 8/08/11 as it was dropped from the Featured Stocks list. Recent resilience and renewed strength has prompted its return to the Featured Stocks list.
The volume-driven gain above its pivot point confirmed a new technical buy signal, and it now faces no resistance due to overhead supply. Its small supply (S criteria) of only 17.9 million shares in the publicly traded float can contribute to greater volatility in the event of institutional buying or selling. Disciplined investors avoid chasing stocks extended more than +5% above prior chart highs, and they always limit losses by selling if any stock falls more than -7% from their purchase price. The number of top-rated funds owning its shares rose from 199 in Sept '10 to 228 in Jun '11, which is a reassuring sign concerning the I criteria of the fact-based investment system.
Recent quarterly comparisons (C criteria) show earnings increases above the +25% guideline versus the year earlier and slow sequential acceleration in its sales revenues increases. Its annual earnings (A criteria) growth rate has been strong and steady. Regular readers may have seen prior reference to blue triangles beside the yearly earnings numbers in each year from 2005-2009 on the chart below which indicate pre-tax, non-recurring items were included (where possible, such items are normally removed to provide data better suited for comparison).
|
|
|
Color Codes Explained :
Y - Better candidates highlighted by our
staff of experts.
G - Previously featured
in past reports as yellow but may no longer be buyable under the
guidelines.
***Last / Change / Volume data in this table is the closing quote data***
Symbol/Exchange
Company Name
Industry Group |
PRICE |
CHANGE
(%Change) |
Day High |
Volume
(% DAV)
(% 50 day avg vol) |
52 Wk Hi
% From Hi |
Featured
Date |
Price
Featured |
Pivot Featured |
|
Max Buy |
EXLS
-
NASDAQ
Exlservice Holdings Inc
DIVERSIFIED SERVICES - Business/Management Services
|
$25.80
|
+0.51
2.02% |
$26.12
|
93,025
103.82% of 50 DAV
50 DAV is 89,600
|
$26.46
-2.49%
|
8/2/2011
|
$24.85
|
PP = $24.85
|
|
MB = $26.09
|
 Most Recent Note - 8/30/2011 4:30:41 PM
Y - Wedging up near its 52-week high with today's 3rd consecutive gain on near average volume. Gapped up on 8/29/11 and posted a confirming gain with +43% above average volume while rallying above the previously cited pivot point. Recent low ($23.01 on 8/19/11) and 50 DMA line define important support to watch above its 200 DMA line.
>>> The latest Featured Stock Update with an annotated graph appeared on 8/25/2011. Click here.
View all notes |
Alert me of new notes |
CANSLIM.net Company Profile |
SEC |
Zacks Reports |
StockTalk |
News |
Chart |
Request a new note
C
A N
S L
I M


|
FCFS
-
NASDAQ
First Cash Financial Svs
SPECIALTY RETAIL - Specialty Retail, Other
|
$46.94
|
+1.64
3.62% |
$47.34
|
581,830
181.94% of 50 DAV
50 DAV is 319,800
|
$47.80
-1.80%
|
5/31/2011
|
$42.00
|
PP = $40.23
|
|
MB = $42.24
|
Most Recent Note - 8/30/2011 1:07:21 PM
G - Challenging its 52-week high with today's gain, but it has not formed a sound base pattern. Recently found support near its 50 DMA line. Prior lows near $37-38 define additional chart support to watch.
>>> The latest Featured Stock Update with an annotated graph appeared on 8/22/2011. Click here.
View all notes |
Alert me of new notes |
CANSLIM.net Company Profile |
SEC |
Zacks Reports |
StockTalk |
News |
Chart |
Request a new note
C
A N
S L
I M
|
JCOM
-
NASDAQ
J 2 Global Communication
INTERNET - Internet Software and Services
|
$32.00
|
+1.20
3.90% |
$32.64
|
1,042,913
305.57% of 50 DAV
50 DAV is 341,300
|
$31.72
0.88%
|
8/8/2011
|
$30.38
|
PP = $29.31
|
|
MB = $30.78
|
Most Recent Note - 8/30/2011 1:11:26 PM
G - Color code was changed to green again after quickly rallying well above its "max buy" level and hitting a new 52-week high with today's volume-driven gain. Prior highs in the $30-31 area which were a resistance level now define initial chart support on pullbacks.
>>> The latest Featured Stock Update with an annotated graph appeared on 8/29/2011. Click here.
View all notes |
Alert me of new notes |
CANSLIM.net Company Profile |
SEC |
Zacks Reports |
StockTalk |
News |
Chart |
Request a new note
C
A N
S L
I M
|
MA
-
NYSE
Mastercard Inc Cl A
DIVERSIFIED SERVICES - Business/Management Services
|
$329.73
|
+2.36
0.72% |
$331.80
|
1,121,096
74.81% of 50 DAV
50 DAV is 1,498,500
|
$340.42
-3.14%
|
8/3/2011
|
$324.82
|
PP = $322.38
|
|
MB = $338.50
|
Most Recent Note - 8/29/2011 6:42:37 PM
Y - Perched -3.8% off its 8/03/11 all-time high after today's small gain on average volume. Recently found support near its 50 DMA line.
>>> The latest Featured Stock Update with an annotated graph appeared on 8/26/2011. Click here.
View all notes |
Alert me of new notes |
CANSLIM.net Company Profile |
SEC |
Zacks Reports |
StockTalk |
News |
Chart |
Request a new note
C
A N
S L
I M
|
MG
-
NYSE
Mistras Group Inc
DIVERSIFIED SERVICES - Bulding and Faci;ity Management Services
|
$20.51
|
+0.10
0.49% |
$20.72
|
178,852
119.08% of 50 DAV
50 DAV is 150,200
|
$20.82
-1.49%
|
8/10/2011
|
$17.89
|
PP = $17.58
|
|
MB = $18.46
|
Most Recent Note - 8/29/2011 6:43:21 PM
G - Gapped up today and hit a new all-time high with a gain on slightly above average volume. No resistance remains due to overhead supply. Previous resistance in the $17-18 area defined important chart support after encountering mild distributional pressure.
>>> The latest Featured Stock Update with an annotated graph appeared on 8/24/2011. Click here.
View all notes |
Alert me of new notes |
CANSLIM.net Company Profile |
SEC |
Zacks Reports |
StockTalk |
News |
Chart |
Request a new note
C
A N
S L
I M
|
Symbol/Exchange
Company Name
Industry Group |
PRICE |
CHANGE
(%Change) |
Day High |
Volume
(% DAV)
(% 50 day avg vol) |
52 Wk Hi
% From Hi |
Featured
Date |
Price
Featured |
Pivot Featured |
|
Max Buy |
MKTX
-
NASDAQ
Marketaxess Holdings Inc
FINANCIAL SERVICES - Investment Brokerage - Nationa
|
$29.98
|
-0.77
-2.50% |
$30.95
|
198,993
81.92% of 50 DAV
50 DAV is 242,900
|
$30.84
-2.79%
|
7/29/2011
|
$25.87
|
PP = $26.35
|
|
MB = $27.67
|
Most Recent Note - 8/30/2011 4:41:01 PM
G - Touched another new all-time high today then reversed into the red for a small loss with lighter than average volume. It is extended from its prior base. Prior resistance in the $25-26 area defines chart support to watch.
>>> The latest Featured Stock Update with an annotated graph appeared on 8/23/2011. Click here.
View all notes |
Alert me of new notes |
CANSLIM.net Company Profile |
SEC |
Zacks Reports |
StockTalk |
News |
Chart |
Request a new note
C
A N
S L
I M
|
PSMT
-
NASDAQ
Pricesmart Inc
RETAIL - Drug Stores
|
$63.81
|
+2.01
3.25% |
$64.64
|
457,419
178.96% of 50 DAV
50 DAV is 255,600
|
$62.27
2.47%
|
8/30/2011
|
$63.01
|
PP = $62.37
|
|
MB = $65.49
|
Most Recent Note - 8/30/2011 6:39:57 PM
Y - Hit a new 52-week high with today's 3rd consecutive gain. Color code was changed to yellow again when it appeared in the earlier mid-day report (read here) with a new pivot point cited. Its considerable gain with +79% above average volume triggered a technical buy signal as it cleared a "square box" base formed over the past 5 weeks. PSMT rebounded promptly after undercutting prior chart lows and slumping below its 50 DMA line when last noted on 8/08/11. See the latest FSU analysis for more details and a new annotated graph.
>>> The latest Featured Stock Update with an annotated graph appeared on 8/30/2011. Click here.
View all notes |
Alert me of new notes |
CANSLIM.net Company Profile |
SEC |
Zacks Reports |
StockTalk |
News |
Chart |
Request a new note
C
A N
S L
I M
|
|
|
|
THESE ARE NOT BUY RECOMMENDATIONS!
Comments contained in the body of this report are technical
opinions only. The material herein has been obtained
from sources believed to be reliable and accurate, however,
its accuracy and completeness cannot be guaranteed.
This site is not an investment advisor, hence it does
not endorse or recommend any securities or other investments.
Any recommendation contained in this report may not
be suitable for all investors and it is not to be deemed
an offer or solicitation on our part with respect to
the purchase or sale of any securities. All trademarks,
service marks and trade names appearing in this report
are the property of their respective owners, and are
likewise used for identification purposes only.
This report is a service available
only to active Paid Premium Members.
You may opt-out of receiving report notifications
at any time. Questions or comments may be submitted
by writing to Premium Membership Services 665 S.E. 10 Street, Suite 201 Deerfield Beach, FL 33441-5634 or by calling 1-800-965-8307
or 954-785-1121.
|
|
|

