You are not logged in.
This means you
CAN ONLY VIEW reports that were published prior to Monday, April 14, 2025.
You
MUST UPGRADE YOUR MEMBERSHIP if you want to see any current reports.
AFTER MARKET UPDATE - MONDAY, AUGUST 22ND, 2011
Previous After Market Report Next After Market Report >>>
|
|
|
|
DOW |
+36.93 |
10,854.58 |
+0.34% |
|
Volume |
1,191,563,290 |
-21% |
|
Volume |
1,922,507,920 |
-18% |
|
NASDAQ |
+3.54 |
2,345.38 |
+0.15% |
|
Advancers |
1,323 |
42% |
|
Advancers |
1,183 |
44% |
|
S&P 500 |
+0.27 |
1,123.80 |
+0.02% |
|
Decliners |
1,703 |
55% |
|
Decliners |
1,410 |
52% |
|
Russell 2000 |
-0.37 |
651.33 |
-0.06% |
|
52 Wk Highs |
13 |
|
|
52 Wk Highs |
9 |
|
|
S&P 600 |
+0.24 |
356.57 |
+0.07% |
|
52 Wk Lows |
247 |
|
|
52 Wk Lows |
216 |
|
|
 |
Bank Of America Tallied Biggest Loss in S&P 500
Kenneth J. Gruneisen - Passed the CAN SLIM® Master's Exam
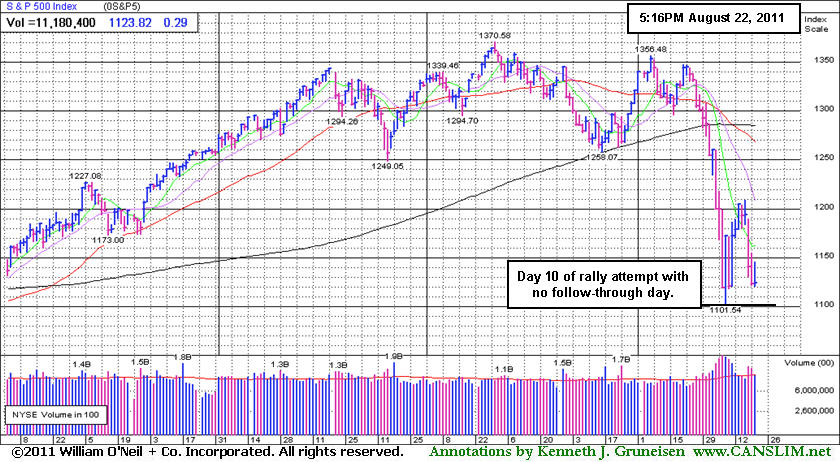
The Dow Jones Industrial Average, S&P 500 Index, and Nasdaq Composite Index erased most of Monday's early gains and closed the session with small gains or barely better than unchanged. Volume totals were reported lower on the NYSE and on the Nasdaq exchange versus Friday's options expiration day which typically inflates volume totals. Breadth was negative as declining issues beat advancers by about 6-5 on the NYSE and by 7-6 on the Nasdaq exchange. On the NYSE and on the Nasdaq exchange new 52-week lows totals solidly outnumbered the new 52-week highs totals. There were 8 high-ranked companies from the CANSLIM.net Leaders List that made new 52-week highs and appeared on the CANSLIM.net BreakOuts Page, up from the prior session total of 3 stocks. Any sustainable rally requires a healthy crop of strong leaders hitting new 52-week highs, so it is of concern again that leadership has evaporated! There were 4 gainers out of the 6 high-ranked leaders currently included on the Featured Stocks Page.
The Dow pared an initial jump of 202 points and the Nasdaq Composite was up as many as 55 points in the opening minutes. Investors looked ahead to a speech by the Federal Reserve Chairman in Jackson Hole Wyoming at the end of the week. Many are hoping, but are not convinced that Ben Bernanke will propose measures the Fed could use to prevent the economy from falling into recession.
The percentage of U.S. mortgages overdue by one month rose to the highest level in a year in the second quarter. Masco Corp (MAS -1.32%), which sells home improvement and building products, declined. Lowe's Companies Inc (LOW +1.14%) gained ground after the retailer authorized a $5 billion share repurchase program. Hewlett Packard Co (HPQ +3.60%) helped lead the technology group in a bounce-back after slumping -27% last week.
Newmont Mining Corp (NEM +4.63%) rallied near multi-year highs as gold prices climbed to a new record just below $1,900 per ounce. In the Mid-Day BreakOuts Report published earlier, 10 of the 20 high-ranked stocks that met the screening criteria hailed from the Mining - Gold/Silver/Gems industry group. Meanwhile, a pullback in the price of crude impacted shares of oil refiners. Oil prices may fall if the Libyan civil war ends and production comes back on line.
Bank of America Corp (BAC -7.89%) tallied the biggest loss of the S&P 500 stocks and other bank stocks weakened after Germany rejected the idea of a common euro-area bond to address the debt crisis. The cost of insuring European bank debt surged. Shares of The Goldman Sachs Group, Inc (GS -4.70%) sank late in the session after CEO Lloyd Blankfein hired a high-profile Washington defense lawyer. The news he had hired separate legal counsel immediately raised questions across Wall Street as to whether Mr. Blankfein himself had received a subpoena in connection to outstanding inquiries.
For now, the market environment (M criteria) still argues for investors to remain cautious and preserve cash on the safe sidelines, staying away from potential harm! Any FTD that comes later may still be sufficient confirmation for a new rally, but it may indicate a weaker rally. Meanwhile, any losses undercutting the major averages' Day 1 lows (8/09/11 lows) would end the current rally attempt which may lead to a longer and deeper market correction.
The August 2011 issue of CANSLIM.net News is now available (click here). Links to all prior reports are available on the Premium Member Homepage.
PICTURED: The S&P 500 Index has completed Day 10 of its rally attempt with no follow-through day.
|
 Kenneth J. Gruneisen started out as a licensed stockbroker in August 1987, a couple of months prior to the historic stock market crash that took the Dow Jones Industrial Average down -22.6% in a single day. He has published daily fact-based fundamental and technical analysis on high-ranked stocks online for two decades. Through FACTBASEDINVESTING.COM, Kenneth provides educational articles, news, market commentary, and other information regarding proven investment systems that work in good times and bad.
Comments contained in the body of this report are technical opinions only and are not necessarily those of Gruneisen Growth Corp. The material herein has been obtained from sources believed to be reliable and accurate, however, its accuracy and completeness cannot be guaranteed. Our firm, employees, and customers may effect transactions, including transactions contrary to any recommendation herein, or have positions in the securities mentioned herein or options with respect thereto. Any recommendation contained in this report may not be suitable for all investors and it is not to be deemed an offer or solicitation on our part with respect to the purchase or sale of any securities. |
|
 |
Gold & Silver Index Posts Standout Gain
Kenneth J. Gruneisen - Passed the CAN SLIM® Master's Exam
The Bank Index ($BKX -1.10%) and Broker/Dealer Index ($XBD -0.29%) suffered losses, starting the week in the same direction they were headed last Friday as they werer shown sinking to new 2011 lows. The Healthcare Index ($HMO -0.96%) and Biotechnology Index ($BTK -0.94%) both had a negative bias. The Oil Services Index ($OSX -1.08%) also fell while the Integrated Oil Index ($XOI +0.17%) fought for a tiny gain. Small gains for the Internet Index ($IIX +0.13%) and Networking Index ($NWX +0.42%) were slightly outpaced by the Semiconductor Index ($SOX +0.80%), and the Retail Index ($RLX +0.69%) also posted a gain.
Charts courtesy www.stockcharts.com
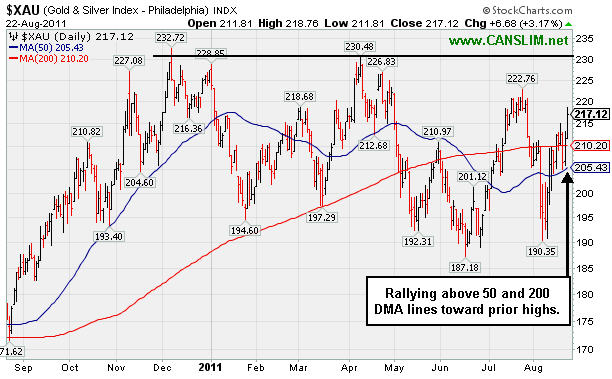
PICTURED: The Gold & Silver Index ($XAU +3.17%) was a standout gainer, rallying above its 50 and 200 DMA lines toward prior highs.
| Oil Services |
$OSX |
211.72 |
-2.32 |
-1.08% |
-13.63% |
| Healthcare |
$HMO |
1,850.41 |
-17.90 |
-0.96% |
+9.36% |
| Integrated Oil |
$XOI |
1,080.15 |
+1.83 |
+0.17% |
-10.96% |
| Semiconductor |
$SOX |
328.94 |
+2.62 |
+0.80% |
-20.13% |
| Networking |
$NWX |
217.31 |
+0.89 |
+0.41% |
-22.54% |
| Internet |
$IIX |
255.52 |
+0.30 |
+0.12% |
-16.97% |
| Broker/Dealer |
$XBD |
83.82 |
-0.25 |
-0.30% |
-31.02% |
| Retail |
$RLX |
469.44 |
+3.22 |
+0.69% |
-7.66% |
| Gold & Silver |
$XAU |
217.12 |
+6.68 |
+3.17% |
-4.18% |
| Bank |
$BKX |
35.10 |
-0.39 |
-1.10% |
-32.77% |
| Biotech |
$BTK |
1,092.19 |
-10.71 |
-0.97% |
-15.83% |
|
|
|
 |
Consolidating Near 50-Day Average Following Reversal at New High
Kenneth J. Gruneisen - Passed the CAN SLIM® Master's Exam
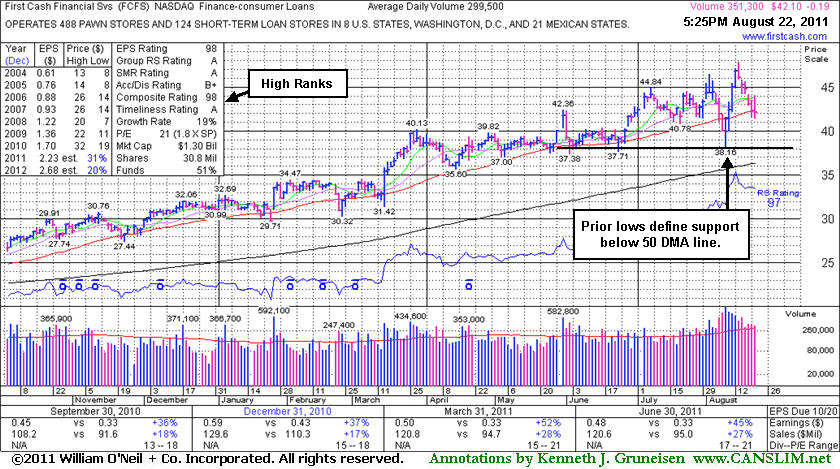
First Cash Financial Services Inc. (FCFS +$1.46 or +3.65% to $41.44) slumped just under its 50-day moving average (DMA) line today with its 6th consecutive loss since its 52-week high marked by a negative reversal. Prior chart lows near $37-38 define support to watch above its 200 DMA line. After its last appearance in this FSU section on 8/09/11 with an annotated graph under the headline, "Rallying Back Near Important Support at 50-Day Average", it managed to impressively sprint to another new high with a streak of volume-driven gains, but the broader market environment (M criteria) has weighed on it of late.
FCFS reported earnings +47% on +27% sales revenues for the quarter ended June 30, 2011 versus the year ago period. Its annual earnings (A criteria) history has been steady and strong. The number of top-rated funds owning its shares rose from 340 in Sep '10 to 351 in Jun '11, and the ownership from institutional investors (I criteria) had been fairly reassuring. The M criteria (market direction) is an overriding concern arguing against all buying efforts until the latest rally attempt is confirmed with a follow-through day of solid gains from one or more of the major averages on higher volume coupled with an expansion in leadership (new 52-week highs). Remember that 3 out of 4 stocks tend to follow along with the broader market averages' direction, so even if a stock has solid fundamentals there is no excuse to hold it if it falls more than -7% from your buy point.
|
|
|
Color Codes Explained :
Y - Better candidates highlighted by our
staff of experts.
G - Previously featured
in past reports as yellow but may no longer be buyable under the
guidelines.
***Last / Change / Volume data in this table is the closing quote data***
Symbol/Exchange
Company Name
Industry Group |
PRICE |
CHANGE
(%Change) |
Day High |
Volume
(% DAV)
(% 50 day avg vol) |
52 Wk Hi
% From Hi |
Featured
Date |
Price
Featured |
Pivot Featured |
|
Max Buy |
EXLS
-
NASDAQ
Exlservice Holdings Inc
DIVERSIFIED SERVICES - Business/Management Services
|
$23.65
|
+0.03
0.13% |
$24.06
|
65,488
75.27% of 50 DAV
50 DAV is 87,000
|
$26.46
-10.62%
|
8/2/2011
|
$24.85
|
PP = $24.85
|
|
MB = $26.09
|
 Most Recent Note - 8/22/2011 5:42:15 PM
Y - Consolidating quietly just above its 50 DMA line today. Technically it negated its recent breakout, raising concerns while slumping under its pivot point and sinking back into its prior base. Its 200 DMA line defines the next important support level to watch
>>> The latest Featured Stock Update with an annotated graph appeared on 8/15/2011. Click here.
View all notes |
Alert me of new notes |
CANSLIM.net Company Profile |
SEC |
Zacks Reports |
StockTalk |
News |
Chart |
Request a new note
C
A N
S L
I M


|
FCFS
-
NASDAQ
First Cash Financial Svs
SPECIALTY RETAIL - Specialty Retail, Other
|
$42.10
|
-0.19
-0.45% |
$44.07
|
351,252
117.28% of 50 DAV
50 DAV is 299,500
|
$47.80
-11.92%
|
5/31/2011
|
$42.00
|
PP = $40.23
|
|
MB = $42.24
|
Most Recent Note - 8/22/2011 5:44:20 PM
G - Closed just under its 50 DMA line today with its 6th consecutive loss since its 52-week high marked by a negative reversal. Prior chart lows near $37-38 define support to watch. See the latest FSU analysis for more details and a new annotated graph.
>>> The latest Featured Stock Update with an annotated graph appeared on 8/22/2011. Click here.
View all notes |
Alert me of new notes |
CANSLIM.net Company Profile |
SEC |
Zacks Reports |
StockTalk |
News |
Chart |
Request a new note
C
A N
S L
I M
|
JCOM
-
NASDAQ
J 2 Global Communication
INTERNET - Internet Software and Services
|
$27.94
|
+0.46
1.67% |
$28.62
|
360,908
111.32% of 50 DAV
50 DAV is 324,200
|
$31.72
-11.92%
|
8/8/2011
|
$30.38
|
PP = $29.31
|
|
MB = $30.78
|
Most Recent Note - 8/22/2011 5:46:00 PM
G - Posted a gain today but it is still sputtering under its 50 and 200 DMA lines following volume-driven losses. Only a prompt rebound above those important moving averages would help its outlook. It made no progress since its 8/03/11 gap up.
>>> The latest Featured Stock Update with an annotated graph appeared on 8/19/2011. Click here.
View all notes |
Alert me of new notes |
CANSLIM.net Company Profile |
SEC |
Zacks Reports |
StockTalk |
News |
Chart |
Request a new note
C
A N
S L
I M
|
MA
-
NYSE
Mastercard Inc Cl A
DIVERSIFIED SERVICES - Business/Management Services
|
$306.00
|
+5.84
1.95% |
$308.70
|
1,029,445
69.27% of 50 DAV
50 DAV is 1,486,200
|
$340.42
-10.11%
|
8/3/2011
|
$324.82
|
PP = $322.38
|
|
MB = $338.50
|
Most Recent Note - 8/22/2011 5:50:02 PM
Y - Posted a small gain on lighter volume today and finished -10.1% off its 8/03/11 all-time high while consolidating near its 50 DMA line.
>>> The latest Featured Stock Update with an annotated graph appeared on 8/16/2011. Click here.
View all notes |
Alert me of new notes |
CANSLIM.net Company Profile |
SEC |
Zacks Reports |
StockTalk |
News |
Chart |
Request a new note
C
A N
S L
I M
|
MG
-
NYSE
Mistras Group Inc
DIVERSIFIED SERVICES - Bulding and Faci;ity Management Services
|
$17.84
|
+0.10
0.56% |
$18.16
|
115,571
83.51% of 50 DAV
50 DAV is 138,400
|
$19.85
-10.13%
|
8/10/2011
|
$17.89
|
PP = $17.58
|
|
MB = $18.46
|
Most Recent Note - 8/22/2011 5:51:57 PM
G - Consolidating near previous resistance in the $17-18 area that defines important chart support after encountering mild distributional pressure.
>>> The latest Featured Stock Update with an annotated graph appeared on 8/11/2011. Click here.
View all notes |
Alert me of new notes |
CANSLIM.net Company Profile |
SEC |
Zacks Reports |
StockTalk |
News |
Chart |
Request a new note
C
A N
S L
I M
|
Symbol/Exchange
Company Name
Industry Group |
PRICE |
CHANGE
(%Change) |
Day High |
Volume
(% DAV)
(% 50 day avg vol) |
52 Wk Hi
% From Hi |
Featured
Date |
Price
Featured |
Pivot Featured |
|
Max Buy |
MKTX
-
NASDAQ
Marketaxess Holdings Inc
FINANCIAL SERVICES - Investment Brokerage - Nationa
|
$26.55
|
-0.30
-1.12% |
$27.49
|
547,305
240.79% of 50 DAV
50 DAV is 227,300
|
$30.25
-12.23%
|
7/29/2011
|
$25.87
|
PP = $26.35
|
|
MB = $27.67
|
Most Recent Note - 8/22/2011 5:53:56 PM
G - Third consecutive small loss today with above average volume. Consolidating since a considerable gain with heavy volume on 8/17/11 for a new 52-week high on news this operator of an electronic trading system for fixed-income securities is exploring a sale of the company.
>>> The latest Featured Stock Update with an annotated graph appeared on 8/10/2011. Click here.
View all notes |
Alert me of new notes |
CANSLIM.net Company Profile |
SEC |
Zacks Reports |
StockTalk |
News |
Chart |
Request a new note
C
A N
S L
I M
|
|
|
|
THESE ARE NOT BUY RECOMMENDATIONS!
Comments contained in the body of this report are technical
opinions only. The material herein has been obtained
from sources believed to be reliable and accurate, however,
its accuracy and completeness cannot be guaranteed.
This site is not an investment advisor, hence it does
not endorse or recommend any securities or other investments.
Any recommendation contained in this report may not
be suitable for all investors and it is not to be deemed
an offer or solicitation on our part with respect to
the purchase or sale of any securities. All trademarks,
service marks and trade names appearing in this report
are the property of their respective owners, and are
likewise used for identification purposes only.
This report is a service available
only to active Paid Premium Members.
You may opt-out of receiving report notifications
at any time. Questions or comments may be submitted
by writing to Premium Membership Services 665 S.E. 10 Street, Suite 201 Deerfield Beach, FL 33441-5634 or by calling 1-800-965-8307
or 954-785-1121.
|
|
|

