You are not logged in.
This means you
CAN ONLY VIEW reports that were published prior to Monday, April 14, 2025.
You
MUST UPGRADE YOUR MEMBERSHIP if you want to see any current reports.
AFTER MARKET UPDATE - FRIDAY, AUGUST 19TH, 2011
Previous After Market Report Next After Market Report >>>
|
|
|
|
DOW |
-172.93 |
10,817.65 |
-1.57% |
|
Volume |
1,508,906,150 |
-7% |
|
Volume |
2,333,635,560 |
-14% |
|
NASDAQ |
-38.59 |
2,341.84 |
-1.62% |
|
Advancers |
733 |
24% |
|
Advancers |
722 |
27% |
|
S&P 500 |
-17.12 |
1,123.53 |
-1.50% |
|
Decliners |
2,308 |
74% |
|
Decliners |
1,868 |
69% |
|
Russell 2000 |
-10.82 |
651.69 |
-1.63% |
|
52 Wk Highs |
7 |
|
|
52 Wk Highs |
5 |
|
|
S&P 600 |
-5.66 |
356.33 |
-1.56% |
|
52 Wk Lows |
279 |
|
|
52 Wk Lows |
316 |
|
|
 |
After More Losses Rally Effort Barely Remains Intact
Kenneth J. Gruneisen - Passed the CAN SLIM® Master's Exam
For the week, the Dow Jones Industrial Average declined -4.0%, S&P 500 Index lost -4.7%, and the Nasdaq Composite Index suffered big -6.6% loss. Volume totals were reported slightly lower on the NYSE and on the Nasdaq exchange on Friday versus the prior session despite it being an options expiration day which typically inflates volume totals. Declining issues beat advancers by more than 3-1 on the NYSE and by 5-2 on the Nasdaq exchange. On the NYSE and on the Nasdaq exchange new 52-week lows totals swelled again and solidly outnumbered the new 52-week highs totals which remained in the single digits. Only 3 high-ranked companies from the CANSLIM.net Leaders List made new 52-week highs and appeared on the CANSLIM.net BreakOuts Page, matching the prior session total. Any sustainable rally requires a healthy crop of strong leaders hitting new 52-week highs, so it is of concern again that leadership has evaporated! There were no gainers out of the 6 high-ranked leaders currently included on the Featured Stocks Page.
Gold settled in New York above $1,850, a record high for the fourth straight day. Investors rotated toward bonds, precious metals, and cash over equities to close out another rough week on Wall Street. The S&P 500 Index posted its fourth straight weekly decline as the attraction of lower stock valuations failed to offset fears of a slowing global economy. Hewlett Packard (HPQ -20%) sank to a six-year low and subtracted 44 points from the Dow Industrials as the market turned thumbs down on the company's new strategy and a disappointing sales forecast. International Business Machines Inc (IBM -3.84%) subtracted 45 points from the Dow.
Consumer discretionary and health care stocks held up the best. The Gap Inc (GPS +1.1%) rose as cost-cutting allowed the retailer to beat analysts' earnings estimates. McDonald's Corp (MCD +1.9%) was the top performer in the Dow Industrials. Bank of America Corp (BAC -1.1%) sank after announcing plans to cut 3,500 jobs this quarter.
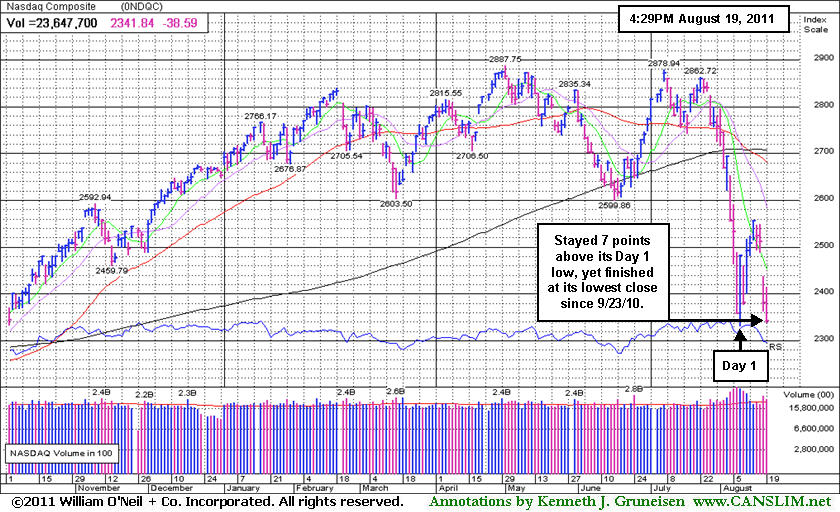
For now, the market environment (M criteria) still argues for investors to remain cautious and preserve cash on the safe sidelines, staying away from potential harm! Any FTD that comes later may still be sufficient confirmation for a new rally, but it may indicate a weaker rally. Meanwhile, any losses undercutting the major averages' Day 1 lows (8/09/11 lows) would end the current rally attempt which may lead to a longer and deeper market correction.
The August 2011 issue of CANSLIM.net News will be published soon! Links to all prior reports are available on the Premium Member Homepage.
PICTURED: The Nasdaq Composite Index finished at its lowest close since 9/23/10, yet it avoided undercutting its Day 1 (8/09/11) low by 7 points, barely keeping its sputtering rally attempt alive.
|
 Kenneth J. Gruneisen started out as a licensed stockbroker in August 1987, a couple of months prior to the historic stock market crash that took the Dow Jones Industrial Average down -22.6% in a single day. He has published daily fact-based fundamental and technical analysis on high-ranked stocks online for two decades. Through FACTBASEDINVESTING.COM, Kenneth provides educational articles, news, market commentary, and other information regarding proven investment systems that work in good times and bad.
Comments contained in the body of this report are technical opinions only and are not necessarily those of Gruneisen Growth Corp. The material herein has been obtained from sources believed to be reliable and accurate, however, its accuracy and completeness cannot be guaranteed. Our firm, employees, and customers may effect transactions, including transactions contrary to any recommendation herein, or have positions in the securities mentioned herein or options with respect thereto. Any recommendation contained in this report may not be suitable for all investors and it is not to be deemed an offer or solicitation on our part with respect to the purchase or sale of any securities. |
|
 |
Financial Stocks "Leading Indicators" to Weaker Market
Kenneth J. Gruneisen - Passed the CAN SLIM® Master's Exam
The Gold & Silver Index ($XAU +1.90%) tallied a gain on Friday while losses abounded. The Semiconductor Index ($SOX -1.78%), Internet Index ($IIX -1.78%), and Networking Index ($NWX -1.34%) led the tech sector lower while the Biotechnology Index ($BTK +0.03%) finished flat. There were losses for the Retail Index ($RLX -1.22%) and Healthcare Index ($HMO -1.77%), and the energy-related Integrated Oil Index ($XOI -1.45%) and Oil Services Index ($OSX -3.22%) fell.
The Broker/Dealer Index ($XBD -3.15%) and Bank Index ($BKX -2.93%) weak among Friday's weakest groups as financial stocks continued to lead the major averages lower. Long-time readers know the emphasis we have repeatedly given in this commentary to the financial groups recognizing them as a "leading indicator". We can certainly see and respect the historic role financial stocks have fulfilled once again in the current market correction. Although the major averages avoided such a weak finish, the charts of the financial indexes, shown below sinking to new 2011 lows, may be considered an ominous warning sign.
Charts courtesy www.stockcharts.com
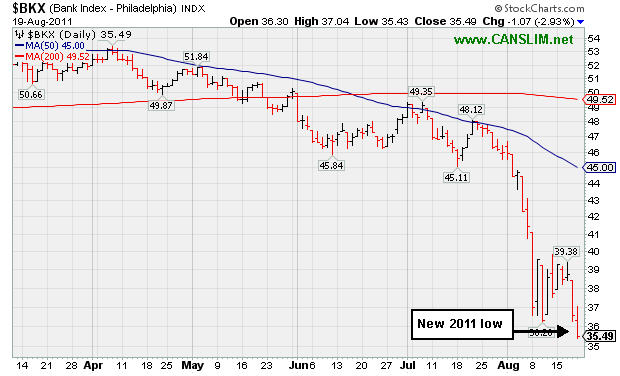
PICTURED 1: The Bank Index ($BKX -2.93%) slumped to a new 2011 low.
Charts courtesy www.stockcharts.com
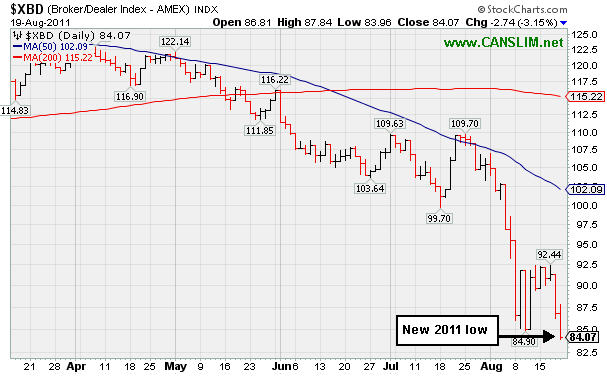
PICTURED 2: The Broker/Dealer Index ($XBD -3.15%) slumped to a new 2011 low.
| Oil Services |
$OSX |
214.04 |
-7.13 |
-3.22% |
-12.68% |
| Healthcare |
$HMO |
1,868.31 |
-33.68 |
-1.77% |
+10.42% |
| Integrated Oil |
$XOI |
1,078.32 |
-15.85 |
-1.45% |
-11.12% |
| Semiconductor |
$SOX |
326.32 |
-5.91 |
-1.78% |
-20.76% |
| Networking |
$NWX |
216.42 |
-2.95 |
-1.34% |
-22.86% |
| Internet |
$IIX |
255.22 |
-4.62 |
-1.78% |
-17.06% |
| Broker/Dealer |
$XBD |
84.07 |
-2.74 |
-3.15% |
-30.81% |
| Retail |
$RLX |
466.22 |
-5.77 |
-1.22% |
-8.29% |
| Gold & Silver |
$XAU |
210.44 |
+3.92 |
+1.90% |
-7.12% |
| Bank |
$BKX |
35.49 |
-1.07 |
-2.93% |
-32.02% |
| Biotech |
$BTK |
1,102.90 |
+0.29 |
+0.03% |
-15.01% |
|
|
|
 |
Overhead Supply Acting as Source of Resistance
Kenneth J. Gruneisen - Passed the CAN SLIM® Master's Exam
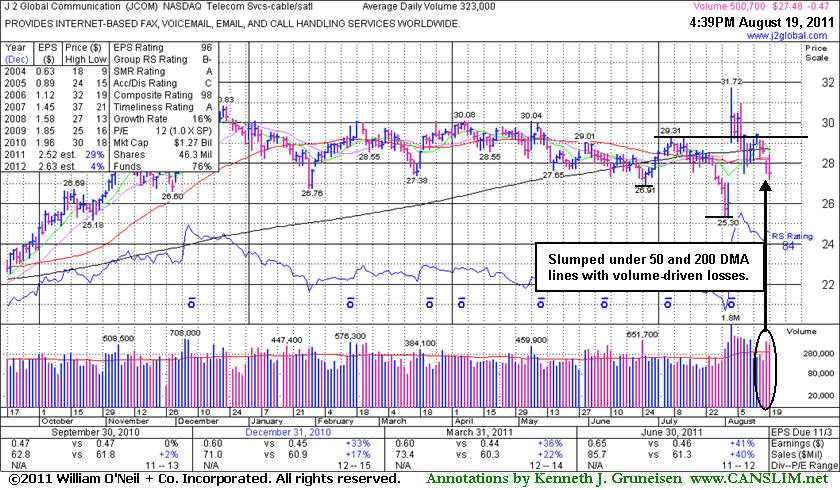
J 2 Global Communication (JCOM -$0.47 or -1.68% to $27.48) slumped under its 50-day and 200-day moving average (DMA) lines with volume-driven losses. Only a prompt rebound above those important moving averages would help its outlook. It has made no progress since its 8/03/11 gap up. Its last appearance in this FSU section was on 8/08/11 and included an annotated weekly graph under the headline, "Negative Reversal to a Close Below its Pivot Point". On that session it finished with a loss after a worrisome "negative reversal" leading to a close back below its pivot point. Members were also cautioned at that time - "The negative backdrop of the broader market (M criteria) bodes poorly for most stocks."
Its color code was changed to yellow in the 8/08/11 mid-day report with an annotated daily graph (read here) showing a pivot point based on its 7/07/11 high after a "double bottom" type base. Although it had rallied to a new high and showed explosive potential, the subsequent slump is an indication that many anxious sellers immediately wanted to head for the exit, rather than adding to the buying momentum and driving it even higher as it was breaking out. Technically, it has endured damaging distributional pressure after rising to challenge previously stubborn resistance in the $30 area. The many months it spent trading at higher levels is a source of resistance called "overhead supply" which may hinder its ability to rally for meaningful gains.
The 3 latest quarterly comparisons through June '11 show sales revenues and earnings acceleration and the high-ranked Telecom Services - Cable/Satellite firm has a strong annual earnings history, satisfying the C and A criteria. The weekly graph below is packed with a lot of additional data. One concern we have highlighted is the waning ownership by top-rated funds, falling from 421 in Mar '11 to 398 in June '11. Normally, increasing interest from top-rated funds is preferred with respect to the I criteria.
|
|
|
Color Codes Explained :
Y - Better candidates highlighted by our
staff of experts.
G - Previously featured
in past reports as yellow but may no longer be buyable under the
guidelines.
***Last / Change / Volume data in this table is the closing quote data***
Symbol/Exchange
Company Name
Industry Group |
PRICE |
CHANGE
(%Change) |
Day High |
Volume
(% DAV)
(% 50 day avg vol) |
52 Wk Hi
% From Hi |
Featured
Date |
Price
Featured |
Pivot Featured |
|
Max Buy |
EXLS
-
NASDAQ
Exlservice Holdings Inc
DIVERSIFIED SERVICES - Business/Management Services
|
$23.62
|
-0.14
-0.59% |
$23.80
|
97,212
113.57% of 50 DAV
50 DAV is 85,600
|
$26.46
-10.73%
|
8/2/2011
|
$24.85
|
PP = $24.85
|
|
MB = $26.09
|
 Most Recent Note - 8/19/2011 4:08:24 PM
Y - Closed near the session high today after gapping down and trading under its 50 DMA line. Technically it negated its recent breakout, raising concerns while slumping under its pivot point and sinking back into its prior base. Its 200 DMA line defines the next important support level to watch
>>> The latest Featured Stock Update with an annotated graph appeared on 8/15/2011. Click here.
View all notes |
Alert me of new notes |
CANSLIM.net Company Profile |
SEC |
Zacks Reports |
StockTalk |
News |
Chart |
Request a new note
C
A N
S L
I M


|
FCFS
-
NASDAQ
First Cash Financial Svs
SPECIALTY RETAIL - Specialty Retail, Other
|
$42.29
|
-0.76
-1.77% |
$43.46
|
394,418
134.06% of 50 DAV
50 DAV is 294,200
|
$47.80
-11.53%
|
5/31/2011
|
$42.00
|
PP = $40.23
|
|
MB = $42.24
|
Most Recent Note - 8/19/2011 4:11:40 PM
G - Closed near its 50 DMA line today with its 5th consecutive loss since its 52-week high marked by a negative reversal. Prior chart lows near $37-38 define support to watch above its 200 DMA line.
>>> The latest Featured Stock Update with an annotated graph appeared on 8/9/2011. Click here.
View all notes |
Alert me of new notes |
CANSLIM.net Company Profile |
SEC |
Zacks Reports |
StockTalk |
News |
Chart |
Request a new note
C
A N
S L
I M
|
JCOM
-
NASDAQ
J 2 Global Communication
INTERNET - Internet Software and Services
|
$27.48
|
-0.47
-1.68% |
$28.44
|
537,297
166.35% of 50 DAV
50 DAV is 323,000
|
$31.72
-13.37%
|
8/8/2011
|
$30.38
|
PP = $29.31
|
|
MB = $30.78
|
Most Recent Note - 8/19/2011 4:17:22 PM
G - Slumped under its 50 and 200 DMA lines with volume-driven losses, making no progress since its 8/03/11 gap up. Only a prompt rebound above those important moving averages would help its outlook.
>>> The latest Featured Stock Update with an annotated graph appeared on 8/19/2011. Click here.
View all notes |
Alert me of new notes |
CANSLIM.net Company Profile |
SEC |
Zacks Reports |
StockTalk |
News |
Chart |
Request a new note
C
A N
S L
I M
|
MA
-
NYSE
Mastercard Inc Cl A
DIVERSIFIED SERVICES - Business/Management Services
|
$300.16
|
-4.75
-1.56% |
$310.30
|
1,561,157
106.09% of 50 DAV
50 DAV is 1,471,600
|
$340.42
-11.83%
|
8/3/2011
|
$324.82
|
PP = $322.38
|
|
MB = $338.50
|
Most Recent Note - 8/19/2011 4:22:14 PM
Y - Amid widespread market weakness it finished -11.6% off its 8/03/11 all-time high while slumping below the previously cited pivot point, also closing below its 50 DMA line.
>>> The latest Featured Stock Update with an annotated graph appeared on 8/16/2011. Click here.
View all notes |
Alert me of new notes |
CANSLIM.net Company Profile |
SEC |
Zacks Reports |
StockTalk |
News |
Chart |
Request a new note
C
A N
S L
I M
|
MG
-
NYSE
Mistras Group Inc
DIVERSIFIED SERVICES - Bulding and Faci;ity Management Services
|
$17.74
|
-0.17
-0.95% |
$18.13
|
200,651
148.63% of 50 DAV
50 DAV is 135,000
|
$19.85
-10.63%
|
8/10/2011
|
$17.89
|
PP = $17.58
|
|
MB = $18.46
|
Most Recent Note - 8/19/2011 4:24:14 PM
G - Encountered mild distributional pressure while retreating from its 52-week high amid widespread market (M criteria) weakness. It slumped near previous resistance in the $17-18 area that defines important chart support.
>>> The latest Featured Stock Update with an annotated graph appeared on 8/11/2011. Click here.
View all notes |
Alert me of new notes |
CANSLIM.net Company Profile |
SEC |
Zacks Reports |
StockTalk |
News |
Chart |
Request a new note
C
A N
S L
I M
|
Symbol/Exchange
Company Name
Industry Group |
PRICE |
CHANGE
(%Change) |
Day High |
Volume
(% DAV)
(% 50 day avg vol) |
52 Wk Hi
% From Hi |
Featured
Date |
Price
Featured |
Pivot Featured |
|
Max Buy |
MKTX
-
NASDAQ
Marketaxess Holdings Inc
FINANCIAL SERVICES - Investment Brokerage - Nationa
|
$26.85
|
-0.50
-1.83% |
$27.60
|
581,377
267.18% of 50 DAV
50 DAV is 217,600
|
$30.25
-11.24%
|
7/29/2011
|
$25.87
|
PP = $26.35
|
|
MB = $27.67
|
Most Recent Note - 8/19/2011 4:25:21 PM
G - Holding its ground since a considerable gain with heavy volume on 8/17/11, hitting a new 52-week high on news this operator of an electronic trading system for fixed-income securities is exploring a sale of the company.
>>> The latest Featured Stock Update with an annotated graph appeared on 8/10/2011. Click here.
View all notes |
Alert me of new notes |
CANSLIM.net Company Profile |
SEC |
Zacks Reports |
StockTalk |
News |
Chart |
Request a new note
C
A N
S L
I M
|
|
|
|
THESE ARE NOT BUY RECOMMENDATIONS!
Comments contained in the body of this report are technical
opinions only. The material herein has been obtained
from sources believed to be reliable and accurate, however,
its accuracy and completeness cannot be guaranteed.
This site is not an investment advisor, hence it does
not endorse or recommend any securities or other investments.
Any recommendation contained in this report may not
be suitable for all investors and it is not to be deemed
an offer or solicitation on our part with respect to
the purchase or sale of any securities. All trademarks,
service marks and trade names appearing in this report
are the property of their respective owners, and are
likewise used for identification purposes only.
This report is a service available
only to active Paid Premium Members.
You may opt-out of receiving report notifications
at any time. Questions or comments may be submitted
by writing to Premium Membership Services 665 S.E. 10 Street, Suite 201 Deerfield Beach, FL 33441-5634 or by calling 1-800-965-8307
or 954-785-1121.
|
|
|

