You are not logged in.
This means you
CAN ONLY VIEW reports that were published prior to Tuesday, April 15, 2025.
You
MUST UPGRADE YOUR MEMBERSHIP if you want to see any current reports.
AFTER MARKET UPDATE - THURSDAY, AUGUST 18TH, 2011
Previous After Market Report Next After Market Report >>>
|
|
|
|
DOW |
-419.63 |
10,990.58 |
-3.68% |
|
Volume |
1,619,891,580 |
+67% |
|
Volume |
2,723,289,600 |
+45% |
|
NASDAQ |
-131.05 |
2,380.43 |
-5.22% |
|
Advancers |
176 |
6% |
|
Advancers |
239 |
9% |
|
S&P 500 |
-53.24 |
1,140.65 |
-4.46% |
|
Decliners |
2,918 |
93% |
|
Decliners |
2,401 |
89% |
|
Russell 2000 |
-41.52 |
662.51 |
-5.90% |
|
52 Wk Highs |
2 |
|
|
52 Wk Highs |
2 |
|
|
S&P 600 |
-21.63 |
361.99 |
-5.64% |
|
52 Wk Lows |
208 |
|
|
52 Wk Lows |
253 |
|
|
 |
Volume Swells As Indices Suffer Big Losses Again
Kenneth J. Gruneisen - Passed the CAN SLIM® Master's Exam
Thursday was a clearly negative session as the Dow Jones Industrial Average, S&P 500 Index, and the Nasdaq Composite Index suffered big losses. Volume totals were reported substantially higher on the NYSE and on the Nasdaq exchange versus the prior session, proof that heavy selling by institutional investors was continuing. Decliners led advancers by 16-1 on the NYSE and by 10-1 on the Nasdaq exchange. On the NYSE and on the Nasdaq exchange new 52-week lows swelled and solidly outnumbered new 52-week highs which were in the single digits on both exchanges. Only 3 high-ranked companies from the CANSLIM.net Leaders List made new 52-week highs and appeared on the CANSLIM.net BreakOuts Page, down from the prior session's total of 9 stocks. There were no gainers out of the 7 high-ranked leaders currently included on the Featured Stocks Page.
Reports raised concerns about the global economy and European sovereign debt contagion. Morgan Stanley (MS -4.76%) said the U.S. is "dangerously close to recession." The firm criticized policymakers in Washington and Europe for not acting more decisively to contain the sovereign debt crisis. The Wall Street Journal said regulators are stepping up scrutiny of European banks' U.S. operations on concerns about possible funding problems. Shares of Deutsche Bank AG (DB -6.99%) took a beating.
As investors moved away from equities, bonds and gold prices were sharply higher. Gold rallied +2% to a new high above $1,820 an ounce. The yield on the 10-year Treasury briefly dipped below 2%. When the stock market closed, the 10-year Treasury note was up 24/32 to yield 2.08%.
A steady stream of bad news drove stocks sharply lower. Economic reports deepened the pain, with the real shocker coming from the mid-Atlantic region. Manufacturing in the Philadelphia region contracted in August by the most in more than two years as orders plunged and factories shed workers. July existing home sales slumped 3.5%, a bigger drop than expected. Initial jobless claims increased to the highest total in a month. Only July leading economic indicators provided relief. The Conference Board said its index of leading indicators rose 0.5%.
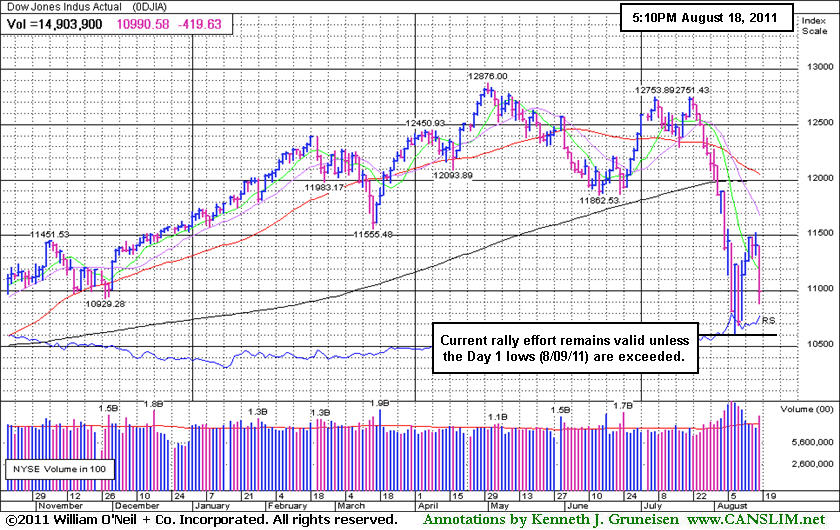
For now, the market environment (M criteria) still argues for investors to remain cautious and preserve cash on the safe sidelines, staying away from potential harm! Any FTD that comes later may still be sufficient confirmation for a new rally, but it may indicate a weaker rally. Meanwhile, any losses undercutting the major averages' Day 1 lows (8/09/11 lows) would end the current rally attempt which may lead to a longer and deeper market correction.
The August 2011 issue of CANSLIM.net News will be published soon! Links to all prior reports are available on the Premium Member Homepage.
PICTURED: The Dow Jones Industrial Average fell less severely than the other major averages on Thursday. As long as the Day 1 lows (8/09/11) are not exceeded the current rally effort remains valid.
|
 Kenneth J. Gruneisen started out as a licensed stockbroker in August 1987, a couple of months prior to the historic stock market crash that took the Dow Jones Industrial Average down -22.6% in a single day. He has published daily fact-based fundamental and technical analysis on high-ranked stocks online for two decades. Through FACTBASEDINVESTING.COM, Kenneth provides educational articles, news, market commentary, and other information regarding proven investment systems that work in good times and bad.
Comments contained in the body of this report are technical opinions only and are not necessarily those of Gruneisen Growth Corp. The material herein has been obtained from sources believed to be reliable and accurate, however, its accuracy and completeness cannot be guaranteed. Our firm, employees, and customers may effect transactions, including transactions contrary to any recommendation herein, or have positions in the securities mentioned herein or options with respect thereto. Any recommendation contained in this report may not be suitable for all investors and it is not to be deemed an offer or solicitation on our part with respect to the purchase or sale of any securities. |
|
 |
Widespread Losses Spare No Industry Groups
Kenneth J. Gruneisen - Passed the CAN SLIM® Master's Exam
The Bank Index ($BKX -6.01%) and Broker/Dealer Index ($XBD -4.67%) slumped near 2011 lows and were a negative influence on the major averages, yet losses were widespread across all industry groups on Thursday. The Retail Index ($RLX -4.77%) sank, and the tech sector saw unanimous losses from the Networking Index ($NWX -7.74%), Internet Index ($IIX -6.20%), Biotechnology Index ($BTK -4.80%), and Semiconductor Index ($SOX -5.79%). energy-related shares also faced pressure as the Oil Services Index ($OSX -6.90%) and Integrated Oil Index ($XOI -5.27%) fell. Defensive groups including the Healthcare Index ($HMO -4.10%) and Gold & Silver Index ($XAU -2.80%) gave no reward to "safe haven" investors.
Charts courtesy www.stockcharts.com
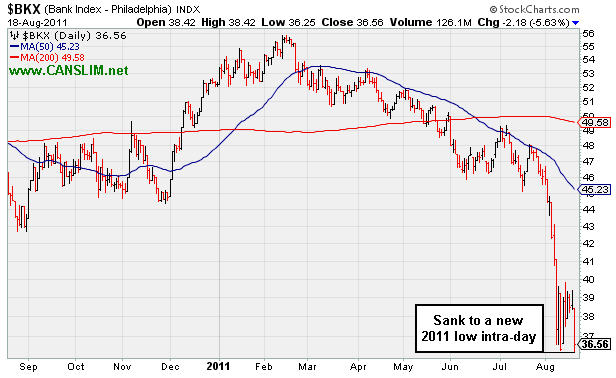
PICTURED: The Bank Index ($BKX -6.01%) sank to a new 2011 low intra-day.
| Oil Services |
$OSX |
221.41 |
-16.40 |
-6.90% |
-9.67% |
| Healthcare |
$HMO |
1,904.40 |
-81.38 |
-4.10% |
+12.55% |
| Integrated Oil |
$XOI |
1,094.41 |
-60.89 |
-5.27% |
-9.79% |
| Semiconductor |
$SOX |
332.66 |
-20.44 |
-5.79% |
-19.22% |
| Networking |
$NWX |
219.56 |
-18.43 |
-7.74% |
-21.74% |
| Internet |
$IIX |
260.28 |
-17.21 |
-6.20% |
-15.42% |
| Broker/Dealer |
$XBD |
87.02 |
-4.26 |
-4.67% |
-28.38% |
| Retail |
$RLX |
469.20 |
-23.52 |
-4.77% |
-7.71% |
| Gold & Silver |
$XAU |
206.56 |
-5.96 |
-2.80% |
-8.84% |
| Bank |
$BKX |
36.41 |
-2.33 |
-6.01% |
-30.26% |
| Biotech |
$BTK |
1,104.25 |
-55.69 |
-4.80% |
-14.90% |
|
|
|
 |
Fossil Fell Fast Following Noted Sell Signal
Kenneth J. Gruneisen - Passed the CAN SLIM® Master's Exam
When the number of stocks included on the Featured Stocks page is low, and those currently listed have all received recent analysis in this FSU section, we occasionally go back to revisit a previously featured stock that was dropped. Today we will have another look at a stock that was dropped from the Featured Stocks list on August 5, 2011.
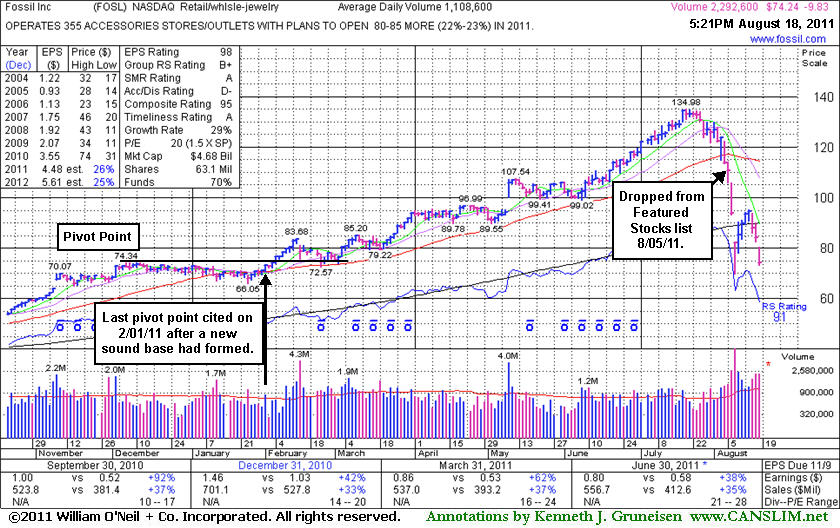
Fossil Inc (FOSL) was last noted 8/5/2011 6:23:44 PM - "Down again today with above average volume, finishing in the middle of its intra-day range after slumping near the $107 area previously noted as the next important support level to watch. Damaging losses this week with above average volume violated its 50 DMA line and triggered a technical sell signal. It will be dropped from the Featured Stocks list tonight." It also was included in the FSU section that evening with an annotated graph under the headline, "Sell Signals Prompt Profit Taking."
After months of trading at higher levels there is now a large amount of overhead supply that will act as resistance whenever it tries to rebound. Its apparently strong fundamentals failed to prevent a slide from $110.56 to today's close at $74.24, a -32.8% decline from when it was dropped less than 2 weeks ago! This serves as a vivid reminder to all members that recognizing technical sell signals is very important and can prevent large gains from slipping away and becoming damaging losses!
From the stock's Company Profile page members can review all prior notes and analysis, in this case going back to when this Retail/Wholesale - Jewelry firm was first featured at $45.54 highlighted in yellow in the 8/10/10 mid-day report (read here). On 2/01/11 the last pivot point was cited after a sound base. Following a subsequent breakout it later re-tested prior resistance and found support near prior highs and its 50 DMA line. Approximately 40% of successful breakouts pull back and test support like FOSL did before continuing higher for substantial gains.
|
|
|
Color Codes Explained :
Y - Better candidates highlighted by our
staff of experts.
G - Previously featured
in past reports as yellow but may no longer be buyable under the
guidelines.
***Last / Change / Volume data in this table is the closing quote data***
Symbol/Exchange
Company Name
Industry Group |
PRICE |
CHANGE
(%Change) |
Day High |
Volume
(% DAV)
(% 50 day avg vol) |
52 Wk Hi
% From Hi |
Featured
Date |
Price
Featured |
Pivot Featured |
|
Max Buy |
EXLS
-
NASDAQ
Exlservice Holdings Inc
DIVERSIFIED SERVICES - Business/Management Services
|
$23.76
|
-0.68
-2.78% |
$24.13
|
111,027
132.49% of 50 DAV
50 DAV is 83,800
|
$26.46
-10.20%
|
8/2/2011
|
$24.85
|
PP = $24.85
|
|
MB = $26.09
|
 Most Recent Note - 8/18/2011 3:32:52 PM
Y - Small gap down today. Technically, several closes below its old high close negated the recent breakout as it sank into the prior base while consolidating above its 50 DMA line (now $23.39). Deterioration leading to a violation of that important short-term average would raise greater concerns and trigger a technical sell signal.
>>> The latest Featured Stock Update with an annotated graph appeared on 8/15/2011. Click here.
View all notes |
Alert me of new notes |
CANSLIM.net Company Profile |
SEC |
Zacks Reports |
StockTalk |
News |
Chart |
Request a new note
C
A N
S L
I M


|
FCFS
-
NASDAQ
First Cash Financial Svs
SPECIALTY RETAIL - Specialty Retail, Other
|
$43.05
|
-1.71
-3.82% |
$44.13
|
374,485
128.95% of 50 DAV
50 DAV is 290,400
|
$47.80
-9.94%
|
5/31/2011
|
$42.00
|
PP = $40.23
|
|
MB = $42.24
|
Most Recent Note - 8/18/2011 3:29:39 PM
G - Pulling back today for a 4th consecutive loss since its 52-week high and a negative reversal on Monday. Prior chart lows near $37-38 define support to watch above its 200 DMA line.
>>> The latest Featured Stock Update with an annotated graph appeared on 8/9/2011. Click here.
View all notes |
Alert me of new notes |
CANSLIM.net Company Profile |
SEC |
Zacks Reports |
StockTalk |
News |
Chart |
Request a new note
C
A N
S L
I M
|
JCOM
-
NASDAQ
J 2 Global Communication
INTERNET - Internet Software and Services
|
$27.95
|
-0.66
-2.31% |
$28.12
|
584,398
184.47% of 50 DAV
50 DAV is 316,800
|
$31.72
-11.89%
|
8/8/2011
|
$30.38
|
PP = $29.31
|
|
MB = $30.78
|
Most Recent Note - 8/18/2011 3:30:34 PM
G - Gapped down today, slumping under its 50 and 200 DMA lines and again struggling amid a widely negative market (M criteria). Last week it churned a lot of volume without making progress since its 8/03/11 gap up.
>>> The latest Featured Stock Update with an annotated graph appeared on 8/8/2011. Click here.
View all notes |
Alert me of new notes |
CANSLIM.net Company Profile |
SEC |
Zacks Reports |
StockTalk |
News |
Chart |
Request a new note
C
A N
S L
I M
|
MA
-
NYSE
Mastercard Inc Cl A
DIVERSIFIED SERVICES - Business/Management Services
|
$304.91
|
-21.31
-6.53% |
$320.00
|
2,109,910
141.54% of 50 DAV
50 DAV is 1,490,700
|
$340.42
-10.43%
|
8/3/2011
|
$324.82
|
PP = $322.38
|
|
MB = $338.50
|
Most Recent Note - 8/18/2011 11:09:35 AM
Y - Gapped down today amid widespread market weakness, slumping -9.2% off its 8/03/11 all-time high and sinking below the previously cited pivot point again, raising concerns. Its 50 DMA line defines important support to watch.
>>> The latest Featured Stock Update with an annotated graph appeared on 8/16/2011. Click here.
View all notes |
Alert me of new notes |
CANSLIM.net Company Profile |
SEC |
Zacks Reports |
StockTalk |
News |
Chart |
Request a new note
C
A N
S L
I M
|
MG
-
NYSE
Mistras Group Inc
DIVERSIFIED SERVICES - Bulding and Faci;ity Management Services
|
$17.91
|
-1.53
-7.87% |
$18.98
|
175,365
130.58% of 50 DAV
50 DAV is 134,300
|
$19.85
-9.77%
|
8/10/2011
|
$17.89
|
PP = $17.58
|
|
MB = $18.46
|
Most Recent Note - 8/18/2011 11:11:25 AM
G - Gapped down today, retreating from its 52-week high amid widespread market (M criteria) weakness. Previous resistance in the $17-18 area defines important chart support to watch on pullbacks.
>>> The latest Featured Stock Update with an annotated graph appeared on 8/11/2011. Click here.
View all notes |
Alert me of new notes |
CANSLIM.net Company Profile |
SEC |
Zacks Reports |
StockTalk |
News |
Chart |
Request a new note
C
A N
S L
I M
|
Symbol/Exchange
Company Name
Industry Group |
PRICE |
CHANGE
(%Change) |
Day High |
Volume
(% DAV)
(% 50 day avg vol) |
52 Wk Hi
% From Hi |
Featured
Date |
Price
Featured |
Pivot Featured |
|
Max Buy |
MKTX
-
NASDAQ
Marketaxess Holdings Inc
FINANCIAL SERVICES - Investment Brokerage - Nationa
|
$27.35
|
-0.10
-0.36% |
$27.60
|
834,648
411.77% of 50 DAV
50 DAV is 202,700
|
$30.25
-9.59%
|
7/29/2011
|
$25.87
|
PP = $26.35
|
|
MB = $27.67
|
Most Recent Note - 8/17/2011 12:16:41 PM
G - Gapped up today for a considerable gain with heavy volume, hitting a new 52-week high on news this operator of an electronic trading system for fixed-income securities is exploring a sale of the company.
>>> The latest Featured Stock Update with an annotated graph appeared on 8/10/2011. Click here.
View all notes |
Alert me of new notes |
CANSLIM.net Company Profile |
SEC |
Zacks Reports |
StockTalk |
News |
Chart |
Request a new note
C
A N
S L
I M
|
PCLN
-
NASDAQ
Priceline.Com Inc
INTERNET - Internet Software and Services
|
$458.80
|
-33.05
-6.72% |
$476.85
|
2,011,513
168.09% of 50 DAV
50 DAV is 1,196,700
|
$561.88
-18.35%
|
7/29/2011
|
$539.46
|
PP = $552.15
|
|
MB = $579.76
|
Most Recent Note - 8/18/2011 11:03:54 AM
Gapped down today, violating its 200 DMA line and recent chart low, raising concerns with its technical deterioration. Based on recent weakness it has slumped -17% off its 52-week high, and it will be dropped from the Featured Stocks list tonight. Its June low ($451.75) defines the next important chart support level to watch.
>>> The latest Featured Stock Update with an annotated graph appeared on 8/12/2011. Click here.
View all notes |
Alert me of new notes |
CANSLIM.net Company Profile |
SEC |
Zacks Reports |
StockTalk |
News |
Chart |
Request a new note
C
A N
S L
I M
|
|
|
|
THESE ARE NOT BUY RECOMMENDATIONS!
Comments contained in the body of this report are technical
opinions only. The material herein has been obtained
from sources believed to be reliable and accurate, however,
its accuracy and completeness cannot be guaranteed.
This site is not an investment advisor, hence it does
not endorse or recommend any securities or other investments.
Any recommendation contained in this report may not
be suitable for all investors and it is not to be deemed
an offer or solicitation on our part with respect to
the purchase or sale of any securities. All trademarks,
service marks and trade names appearing in this report
are the property of their respective owners, and are
likewise used for identification purposes only.
This report is a service available
only to active Paid Premium Members.
You may opt-out of receiving report notifications
at any time. Questions or comments may be submitted
by writing to Premium Membership Services 665 S.E. 10 Street, Suite 201 Deerfield Beach, FL 33441-5634 or by calling 1-800-965-8307
or 954-785-1121.
|
|
|

