You are not logged in.
This means you
CAN ONLY VIEW reports that were published prior to Monday, February 26, 2024.
You
MUST UPGRADE YOUR MEMBERSHIP if you want to see any current reports.
AFTER MARKET UPDATE - MONDAY, AUGUST 17TH, 2020
Previous After Market Report Next After Market Report >>>
|
|
|
|
DOW |
-86.11 |
27,844.91 |
-0.31% |
|
Volume |
744,583,107 |
+4% |
|
Volume |
3,191,714,800 |
-8% |
|
NASDAQ |
+110.43 |
11,129.73 |
+1.00% |
|
Advancers |
1,513 |
51% |
|
Advancers |
1,866 |
56% |
|
S&P 500 |
+9.14 |
3,381.99 |
+0.27% |
|
Decliners |
1,448 |
49% |
|
Decliners |
1,480 |
44% |
|
Russell 2000 |
+7.59 |
1,585.47 |
+0.48% |
|
52 Wk Highs |
91 |
|
|
52 Wk Highs |
136 |
|
|
S&P 600 |
+1.19 |
919.09 |
+0.13% |
|
52 Wk Lows |
11 |
|
|
52 Wk Lows |
14 |
|
|
 |
Leadership Improved While Major Indices Ended Mixed
Kenneth J. Gruneisen - Passed the CAN SLIM® Master's Exam
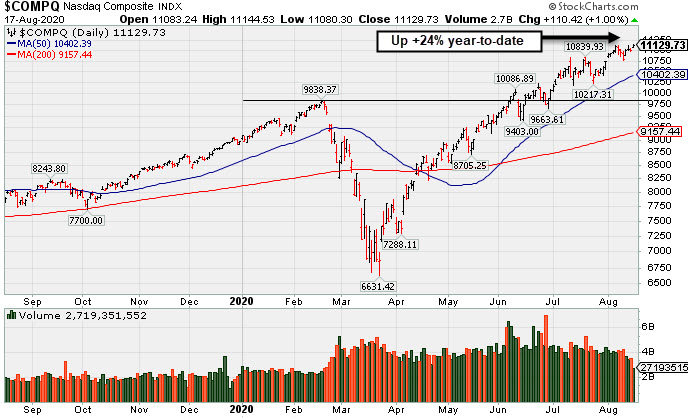
The S&P 500 rose 0.3%, closing just short of its February 19th all-time high. The Dow lost 86 points, while the Nasdaq Composite advanced 1.0% to a record high. The reported volume totals were mixed, higher than the prior session total on the NYSE and lighter on the Nasdaq exchange. Advancers led decliners by a narrow margin on the NYSE and by a 9-7 margin on the Nasdaq exchange. There were 56 high-ranked companies from the Leaders List that hit new 52-week highs and were listed on the BreakOuts Page, versus the total of 22 on the prior session. New 52-week highs totals expanded and solidly outnumbered new 52-week lows totals on both the NYSE and the Nasdaq exchange. The major indices are in a confirmed uptrend (M criteria). Any sustainable rally requires a healthy crop of new leaders, so it remains ever-important to see substantial new highs totals. Charts used courtesy of www.stockcharts.com
PICTURED: The Nasdaq Composite Index is +24% year-to-date. Stocks finished mixed Monday, as investors digested fresh stimulus from the Chinese central bank. Overnight, the People’s Bank of China injected 700 billion yuan ($101 billion) into its medium-term lending facility boosting sentiment.
Seven of 11 S&P 500 sectors ended the day in positive territory, with Tech and Consumer Discretionary shares pacing gains. Financials lagged amid news that Warren Buffett’s Berkshire Hathaway reduced its stake in some of Wall Street’s biggest banks. In earnings, JD.com (JD +7.93%) rose after China’s second largest online retailer exceeded estimates on the top and bottom line, benefiting from an increase in online spending. In corporate news, Home Depot (HD +2.74%) rose a day ahead of its earnings release after a report cited higher in-store foot traffic for June and July. Elsewhere, NVidia (NVDA +6.68%) rose after being subject to a price target increase on Wall Street. In M&A activity, Principia Biopharma (PRNB +9.38%) rose after agreeing to be bought by French drugmaker Sanofi (SNY +2.03%) for roughly $3.7 billion.
On the data front, a report from the NAHB showed homebuilder sentiment spiked to its best level since 1998. Separately, manufacturing activity in the New York State region worsened more than anticipated this month. Treasuries strengthened, with the yield on the 10-year note falling two basis points to 0.69%, drifting from an eight-week high. In commodities, COMEX gold rebounded 2.0% to $1,975.90/ounce after snapping a nine-week winning streak. WTI crude advanced 1.9% to $42.81/barrel following a second-straight weekly gain.
|
 Kenneth J. Gruneisen started out as a licensed stockbroker in August 1987, a couple of months prior to the historic stock market crash that took the Dow Jones Industrial Average down -22.6% in a single day. He has published daily fact-based fundamental and technical analysis on high-ranked stocks online for two decades. Through FACTBASEDINVESTING.COM, Kenneth provides educational articles, news, market commentary, and other information regarding proven investment systems that work in good times and bad.
Comments contained in the body of this report are technical opinions only and are not necessarily those of Gruneisen Growth Corp. The material herein has been obtained from sources believed to be reliable and accurate, however, its accuracy and completeness cannot be guaranteed. Our firm, employees, and customers may effect transactions, including transactions contrary to any recommendation herein, or have positions in the securities mentioned herein or options with respect thereto. Any recommendation contained in this report may not be suitable for all investors and it is not to be deemed an offer or solicitation on our part with respect to the purchase or sale of any securities. |
|
 |
Gold & Silver Index Posts Standout Gain; Retail and Tech Rose
Kenneth J. Gruneisen - Passed the CAN SLIM® Master's Exam
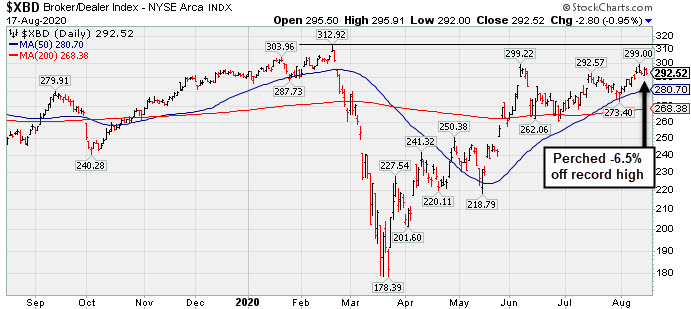
The Retail Index ($RLX +1.43%) posted a solid gain while weakness in the Broker/Dealer Index ($XBD -0.95%) and the Bank Index ($BKX -2.12%) created a drag on the major indices. The Biotech Index ($BTK +1.62%) and Semiconductor Index ($SOX +1.22%) led the tech sector higher while the Networking Index ($NWX -0.44%) edged lower. The Gold & Silver Index ($XAU +5.83%) posted a standout gain, but the Oil Services Index ($OSX -1.14%) and Integrated Oil Index ($XOI -0.58%) both lost ground.
PICTURED: The Broker/Dealer Index ($XBD -0.95%) recently found support near its 50-day moving average (DMA) line and is perched -6.5% off its record high hit in February.
| Oil Services |
$OSX |
39.14 |
-0.45 |
-1.14% |
-50.01% |
| Integrated Oil |
$XOI |
770.14 |
-4.51 |
-0.58% |
-39.38% |
| Semiconductor |
$SOX |
2,227.61 |
+26.80 |
+1.22% |
+20.44% |
| Networking |
$NWX |
599.90 |
-2.63 |
-0.44% |
+2.83% |
| Broker/Dealer |
$XBD |
292.52 |
-2.80 |
-0.95% |
+0.74% |
| Retail |
$RLX |
3,442.17 |
+48.39 |
+1.43% |
+40.54% |
| Gold & Silver |
$XAU |
154.47 |
+8.51 |
+5.83% |
+44.47% |
| Bank |
$BKX |
77.27 |
-1.67 |
-2.12% |
-31.84% |
| Biotech |
$BTK |
5,645.63 |
+90.05 |
+1.62% |
+11.41% |
|
|
|
 |
Consolidating Above 50-Day Moving Average Line and Recent Low
Kenneth J. Gruneisen - Passed the CAN SLIM® Master's Exam
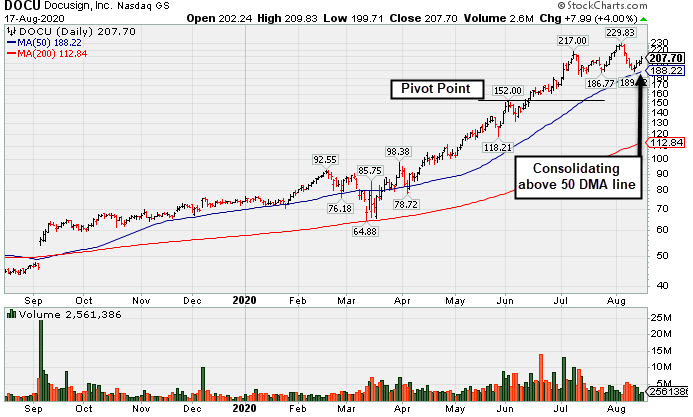
Docusign Inc (DOCU +$7.99 or +4.00% to $207.70) has not formed a sound base of sufficient length and it is consolidating above Its 50-day moving average (DMA) line ($188.22) and the recent low ($189.12 on 8/12/20) which define important near-term support to watch. Subsequent losses leading to violations may trigger technical sell signals. Keep in mind it is scheduled to report July '20 quarterly results on 9/03/20.
DOCU is now priced +84% above its 200 DMA price, and it is taught in the Certification that a stock trading +70-100% or more above the 200 DMA is to be recognized as a "sell signal". It was last shown in this FSU section on 7/28/20 with an annotated graph under the headline, "E-Signature Firm is Extended From Any Sound Base". It was highlighted in yellow in the 6/01/20 mid-day report (read here) with pivot point cited based on its 5/02/20 high plus 10 cents after forming an advanced "ascending base" marked by 3 pullbacks of 10-20% during its ongoing ascent.
It has an Earnings Per Share Rating of 84, above the 80+ minimum for buy candidates. Recently it reported earnings +71% on +39% sales revenues for the Apr '20 quarter versus the year ago period. Three of the past 4 quarterly comparisons versus the year ago period were above the +25% minimum guideline with solid underlying sales revenues growth. After years of losses it had solid earnings in FY '19 and '20.
The number of top-rated funds owning its shares rose from 558 on Jun '19 to 1,159 in Jun '20, a reassuring sign concerning the I criteria. Its current Up/Down Volume Ratio of 1.3 also is an unbiased indication its shares have been under accumulation over the past 50 days. The Computer Software-Enterprise industry group is currently ranked 7th of the 197 Industry Groups (L criteria).
|
|
|
Color Codes Explained :
Y - Better candidates highlighted by our
staff of experts.
G - Previously featured
in past reports as yellow but may no longer be buyable under the
guidelines.
***Last / Change / Volume data in this table is the closing quote data***
Symbol/Exchange
Company Name
Industry Group |
PRICE |
CHANGE
(%Change) |
Day High |
Volume
(% DAV)
(% 50 day avg vol) |
52 Wk Hi
% From Hi |
Featured
Date |
Price
Featured |
Pivot Featured |
|
Max Buy |
 CRL
-
NYSE
CRL
-
NYSE
Charles River Labs Intl
DRUGS - Biotechnology
|
$218.45
|
+3.96
1.85% |
$219.58
|
182,683
47.45% of 50 DAV
50 DAV is 385,000
|
$221.97
-1.59%
|
7/15/2020
|
$192.66
|
PP = $189.95
|
|
MB = $199.45
|
 Most Recent Note - 8/17/2020 6:10:53 PM
G - Volume totals have been cooling while hovering near its all-time high. Bullish action last week came after it reported Jun '20 quarterly earnings -3% on +4% sales revenues, below the +25% minimum guideline (C criteria) but better than expected while the company also raised its guidance. The prior high ($189.85 on 6/03/20) defines initial support to watch above its 50 DMA line ($191.37).
>>> FEATURED STOCK ARTICLE : Hit New Highs Again; EPS Rating Dropped Yet Remains High at 92 - 8/7/2020 |
View all notes |
Set NEW NOTE alert |
Company Profile |
SEC
News |
Chart |
Request a new note
C
A
S
I |
EBS
-
NYSE
Emergent Biosolutions
DRUGS - Biotechnology
|
$133.39
|
-0.03
-0.02% |
$135.63
|
541,049
51.33% of 50 DAV
50 DAV is 1,054,000
|
$137.61
-3.07%
|
7/7/2020
|
$89.47
|
PP = $93.68
|
|
MB = $98.36
|
Most Recent Note - 8/13/2020 7:57:34 PM
G - Rebounded near its all-time high with average volume behind today's big gain. Very extended from any sound base. Bullish action came after it reported Jun '20 quarterly earnings +890% on +62% sales revenue for the Jun '20 quarter versus the year ago period. Prior highs in the $93 area define initial support above its 50 DMA line ($92.41).
>>> FEATURED STOCK ARTICLE : Rally Continues Into Record High Territory - 8/4/2020 |
View all notes |
Set NEW NOTE alert |
Company Profile |
SEC
News |
Chart |
Request a new note
C
A
S
I |
BMRN
-
NASDAQ
Biomarin Pharmaceutical
DRUGS - Drug Manufacturers - Other
|
$119.49
|
+1.33
1.13% |
$121.23
|
635,534
48.77% of 50 DAV
50 DAV is 1,303,000
|
$131.95
-9.44%
|
6/17/2020
|
$110.95
|
PP = $112.67
|
|
MB = $118.30
|
Most Recent Note - 8/13/2020 7:44:44 PM
G - Still sputtering below its 50 DMA line ($120). A prompt rebound above the 50 DMA line is needed for its outlook to improve. Recently reported Jun '20 quarterly earnings +220% on +11% sales revenues versus the year ago period, continuing its strong earnings track record.
>>> FEATURED STOCK ARTICLE : Hovering Above 50-Day Average After Another Strong Earnings Report - 8/5/2020 |
View all notes |
Set NEW NOTE alert |
Company Profile |
SEC
News |
Chart |
Request a new note
C
A
S
I |
AMD
-
NASDAQ
Advanced Micro Devices
ELECTRONICS - Semiconductor - Broad Line
|
$82.42
|
+1.12
1.38% |
$83.06
|
31,316,277
47.62% of 50 DAV
50 DAV is 65,768,000
|
$87.29
-5.58%
|
7/22/2020
|
$61.73
|
PP = $59.10
|
|
MB = $62.06
|
Most Recent Note - 8/14/2020 5:26:27 PM
G - Volume totals have been cooling while perched near its all-time high, very extended from the previously noted base. The recent low ($76.10 on 8/11/20) defines near-term support above its 50 DMA line ($62.27). Fundamentals remain strong. See the latest FSU analysis for more details and a new annotated graph.
>>> FEATURED STOCK ARTICLE : AMD Rose +46% Since First Featured on June 9th - 8/14/2020 |
View all notes |
Set NEW NOTE alert |
Company Profile |
SEC
News |
Chart |
Request a new note
C
A
S
I |
TREX
-
NYSE
Trex Company Inc
MATERIALS and CONSTRUCTION - General Building Materials
|
$144.44
|
+2.48
1.75% |
$147.50
|
426,522
48.36% of 50 DAV
50 DAV is 882,000
|
$144.96
-0.36%
|
6/26/2020
|
$109.05
|
PP = $132.94
|
|
MB = $139.59
|
Most Recent Note - 8/17/2020 6:12:50 PM
G - Touched a new all-time high today but ended near the session low with a small gain backed by light volume. It has been wedging above its "max buy" level with volume totals cooling. Reported Jun '20 quarterly earnings +27% on +7% sales revenues versus the year ago period. Important near-term support is at its 50 DMA line ($130).
>>> FEATURED STOCK ARTICLE : Perched Near All Time High With Earnings News Due Monday - 7/30/2020 |
View all notes |
Set NEW NOTE alert |
Company Profile |
SEC
News |
Chart |
Request a new note
C
A
S
I |
Symbol/Exchange
Company Name
Industry Group |
PRICE |
CHANGE
(%Change) |
Day High |
Volume
(% DAV)
(% 50 day avg vol) |
52 Wk Hi
% From Hi |
Featured
Date |
Price
Featured |
Pivot Featured |
|
Max Buy |
NFLX
-
NASDAQ
Netflix Inc
SPECIALTY RETAIL - Music and Video Stores
|
$482.35
|
-0.33
-0.07% |
$486.24
|
2,414,131
31.65% of 50 DAV
50 DAV is 7,627,000
|
$575.37
-16.17%
|
5/14/2020
|
$441.95
|
PP = $449.62
|
|
MB = $472.10
|
Most Recent Note - 8/14/2020 5:21:57 PM
G - Found prompt support this week after briefly undercutting both its 50 DMA line ($477) and prior low ($467.54). The rebound above the 50 DMA line helped its outlook improve, however, the volume behind recent gains has been very light. Fundamentals remain strong.
>>> FEATURED STOCK ARTICLE : Consolidating After Getting Extended From Prior Base - 7/29/2020 |
View all notes |
Set NEW NOTE alert |
Company Profile |
SEC
News |
Chart |
Request a new note
C
A
S
I |
CHGG
-
NYSE
Chegg Inc
Consumer Svcs-Education
|
$79.71
|
+2.57
3.33% |
$79.94
|
2,169,467
60.01% of 50 DAV
50 DAV is 3,615,000
|
$89.82
-11.26%
|
6/17/2020
|
$63.71
|
PP = $68.08
|
|
MB = $71.48
|
Most Recent Note - 8/17/2020 6:17:25 PM
G - Posted a 3rd consecutive gain with below average volume, consolidating after getting very extended from any sound base. Reported Jun '20 quarterly earnings +61% on +63% sales revenues versus the year ago period. Its 50 DMA line ($71.53) defines support to watch above its prior high in the $68 area. Any losses leading to violations would raise concerns and trigger technical sell signals.
>>> FEATURED STOCK ARTICLE : Bullish Action Continued After Latest Strong Earnings Report - 8/6/2020 |
View all notes |
Set NEW NOTE alert |
Company Profile |
SEC
News |
Chart |
Request a new note
C
A
S
I |
LGIH
-
NASDAQ
L G I Homes Inc
Bldg-Resident/Comml
|
$114.52
|
+5.58
5.12% |
$115.10
|
240,133
72.33% of 50 DAV
50 DAV is 332,000
|
$123.94
-7.60%
|
7/7/2020
|
$99.19
|
PP = $95.82
|
|
MB = $100.61
|
Most Recent Note - 8/17/2020 6:16:17 PM
G - Posted a big gain today with light volume, rebounding toward its 52-week high. It is extended from the previously noted base. Its 50 DMA line ($101.27) defines near-term support to watch above prior highs in the $95 area.
>>> FEATURED STOCK ARTICLE : Earning News Due Next Week for Homebuilder - 7/31/2020 |
View all notes |
Set NEW NOTE alert |
Company Profile |
SEC
News |
Chart |
Request a new note
C
A
S
I |
NOW
-
NYSE
Servicenow Inc
Computer Sftwr-Enterprse
|
$442.37
|
+6.64
1.52% |
$445.15
|
1,966,902
115.63% of 50 DAV
50 DAV is 1,701,000
|
$454.70
-2.71%
|
4/30/2020
|
$343.05
|
PP = $363.05
|
|
MB = $381.20
|
Most Recent Note - 8/13/2020 7:42:23 PM
G - Consolidating above its 50 DMA line ($415.47) which defines important near-term support to watch. Subsequent losses leading to a violation may trigger a technical sell signal. Reported Jun '20 quarterly earnings +73% on +28% sales revenues versus the year ago period. See the latest FSU analysis for more details and a new annotated graph.
>>> FEATURED STOCK ARTICLE : Consolidating Above 50-Day Average After Another Strong Quarter - 8/13/2020 |
View all notes |
Set NEW NOTE alert |
Company Profile |
SEC
News |
Chart |
Request a new note
C
A
S
I |
TTD
-
NASDAQ
The Trade Desk Inc Cl A
Comml Svcs-Advertising
|
$474.85
|
+9.25
1.99% |
$477.00
|
576,983
37.98% of 50 DAV
50 DAV is 1,519,000
|
$510.00
-6.89%
|
6/3/2020
|
$340.61
|
PP = $327.35
|
|
MB = $343.72
|
Most Recent Note - 8/17/2020 6:14:53 PM
G - Quietly holding its ground still perched near its all-time high. Recently reported Jun '20 quarterly earnings -3% on -13% sales revenues versus the year ago period, raising fundamental concerns. It is extended from any sound base of sufficient length. Its 50 DMA line ($428.60) defines near-term support above the prior low ($404 on 7/24/20) where violations may trigger technical sell signals.
>>> FEATURED STOCK ARTICLE : Hovering Near High After Latest Quarterly Report Raised Concerns - 8/12/2020 |
View all notes |
Set NEW NOTE alert |
Company Profile |
SEC
News |
Chart |
Request a new note
C
A
S
I |
Symbol/Exchange
Company Name
Industry Group |
PRICE |
CHANGE
(%Change) |
Day High |
Volume
(% DAV)
(% 50 day avg vol) |
52 Wk Hi
% From Hi |
Featured
Date |
Price
Featured |
Pivot Featured |
|
Max Buy |
DOCU
-
NASDAQ
Docusign Inc
Computer Sftwr-Enterprse
|
$207.70
|
+7.99
4.00% |
$209.83
|
2,563,762
48.80% of 50 DAV
50 DAV is 5,254,000
|
$229.83
-9.63%
|
6/10/2020
|
$149.73
|
PP = $152.10
|
|
MB = $159.71
|
Most Recent Note - 8/17/2020 6:09:27 PM
G - Posted a 4th consecutive gain with below average volume, consolidating above its 50 DMA line ($188.22) and prior low ($189.12 on 8/12/20) which define important near-term support to watch. See the latest FSU analysis for more details and a new annotated graph.
>>> FEATURED STOCK ARTICLE : Consolidating Above 50-Day Moving Average Line and Recent Low - 8/17/2020 |
View all notes |
Set NEW NOTE alert |
Company Profile |
SEC
News |
Chart |
Request a new note
C
A
S
I |
PING
-
NYSE
Ping Identity Holdings Corp
Computer Sftwr-Security
|
$33.22
|
+0.47
1.44% |
$33.50
|
781,912
59.28% of 50 DAV
50 DAV is 1,319,100
|
$37.80
-12.12%
|
6/1/2020
|
$29.24
|
PP = $29.90
|
|
MB = $31.40
|
Most Recent Note - 8/13/2020 12:51:23 PM
G - Reported Jun '20 quarterly earnings -27% on -6% sales revenues versus the year ago period, below the +25% minimum earnings guideline, raising fundamental concerns. Undercut its 50 DMA line ($32.62) with today's 5th consecutive volume-driven loss. The next important near-term support is the prior highs in the $29 area. It has not formed a sound base of sufficient length. Completed Secondary Offerings on 7/09/20 and 5/15/20.
>>> FEATURED STOCK ARTICLE : Perched Near High With Earnings News Due Wednesday Evening - 8/10/2020 |
View all notes |
Set NEW NOTE alert |
Company Profile |
SEC
News |
Chart |
Request a new note
C
A
S
I |
|
|
|
THESE ARE NOT BUY RECOMMENDATIONS!
Comments contained in the body of this report are technical
opinions only. The material herein has been obtained
from sources believed to be reliable and accurate, however,
its accuracy and completeness cannot be guaranteed.
This site is not an investment advisor, hence it does
not endorse or recommend any securities or other investments.
Any recommendation contained in this report may not
be suitable for all investors and it is not to be deemed
an offer or solicitation on our part with respect to
the purchase or sale of any securities. All trademarks,
service marks and trade names appearing in this report
are the property of their respective owners, and are
likewise used for identification purposes only.
This report is a service available
only to active Paid Premium Members.
You may opt-out of receiving report notifications
at any time. Questions or comments may be submitted
by writing to Premium Membership Services 665 S.E. 10 Street, Suite 201 Deerfield Beach, FL 33441-5634 or by calling 1-800-965-8307
or 954-785-1121.
|
|
|