You are not logged in.
This means you
CAN ONLY VIEW reports that were published prior to Monday, April 14, 2025.
You
MUST UPGRADE YOUR MEMBERSHIP if you want to see any current reports.
AFTER MARKET UPDATE - WEDNESDAY, AUGUST 17TH, 2011
Previous After Market Report Next After Market Report >>>
|
|
|
|
DOW |
+4.28 |
11,410.21 |
+0.04% |
|
Volume |
972,755,490 |
-14% |
|
Volume |
1,873,064,460 |
-8% |
|
NASDAQ |
-11.97 |
2,511.48 |
-0.47% |
|
Advancers |
1,779 |
57% |
|
Advancers |
1,182 |
44% |
|
S&P 500 |
+1.13 |
1,193.89 |
+0.09% |
|
Decliners |
1,252 |
40% |
|
Decliners |
1,366 |
51% |
|
Russell 2000 |
-0.73 |
704.03 |
-0.10% |
|
52 Wk Highs |
13 |
|
|
52 Wk Highs |
8 |
|
|
S&P 600 |
-1.09 |
383.62 |
-0.28% |
|
52 Wk Lows |
14 |
|
|
52 Wk Lows |
58 |
|
|
Due to a technical problem, members who may have viewed Tuesday evening's report may not have seen the usual FSU table with the latest notes on all currently Featured Stocks. Additionally, the detailed analysis and graph for Mastercard Inc (MA) may not have been complete when viewed by some members. This was corrected later last evening, and anyone who likes may go back now and review the corrected report - here. We apologize for any inconvenience or confusion this error may have caused. Tonight's FSU analysis revisits a previously dropped stock and demonstrates the importance of following strict sell rules! Be sure to read it. If you would like for us to consider any special stock for review in the FSU section, please write in and request it via the inquiry form. Thank you!
|
 |
Major Averages Finish Mixed With Quieter Volume
Kenneth J. Gruneisen - Passed the CAN SLIM® Master's Exam
Wednesday's seesaw session ended with tiny gains for the Dow Jones Industrial Average and benchmark S&P 500 Index as the market experienced a day of mood swings. Volume totals were reported lighter on the NYSE and on the Nasdaq exchange versus the prior session. Advancing issues beat decliners by 3-2 on the NYSE. Decliners beat advancers by 9-8 on the Nasdaq exchange. On the NYSE and on the Nasdaq exchange new 52-week lows outnumbered new 52-week highs. Only 9 high-ranked companies from the CANSLIM.net Leaders List made new 52-week highs and appeared on the CANSLIM.net BreakOuts Page, up slightly from the prior session's total of 7 stocks. There were 3 gainers out of the 7 high-ranked leaders currently included on the Featured Stocks Page.
The Dow lost an early gain of 123 points, but managed to close up 4 points. The Nasdaq Composite Index improved from its early-afternoon lows but finished with a modest loss after wiping out an opening gain of 25 points. The bumpy ride for stocks boosted bonds. The 10-year Treasury note was up 18/32 to yield 2.15%.
The technology sector faced pressure after Dell Inc (DELL -10.13%) cut its full-year profit forecast while PCs lost ground to tablets. Retail stocks ran into headwinds because of worries that higher costs will squeeze margins. Abercrombie & Fitch Co (ANF -8.7%) fell in spite of better-than-expected profits. Cost cuts helped Target Corp (TGT +2.39%) beat earnings projections. None of the above mentioned household names has the strong quarterly earnings and sales revenues growth history expected of valid buy candidates under the fact-based investment system's guidelines. High-ranked leaders currently included on the Featured Stocks Page are much better matches with the models of the greatest stock market winners.
A report on wholesale prices suggested inflation may be on the rise. The July producer price index increased 0.2% from June, higher than expected, led by tobacco, trucks and pharmaceuticals. Thursday's Consumer Price Index (CPI) for July may show a year-over-year increase of 3.7%. Gasoline futures rose as U.S. inventories fell to the lowest level in 12 weeks. The president of the Philadelphia Fed said the Federal Reserve may have to renege on a pledge to hold interest rates at record lows for another two years.
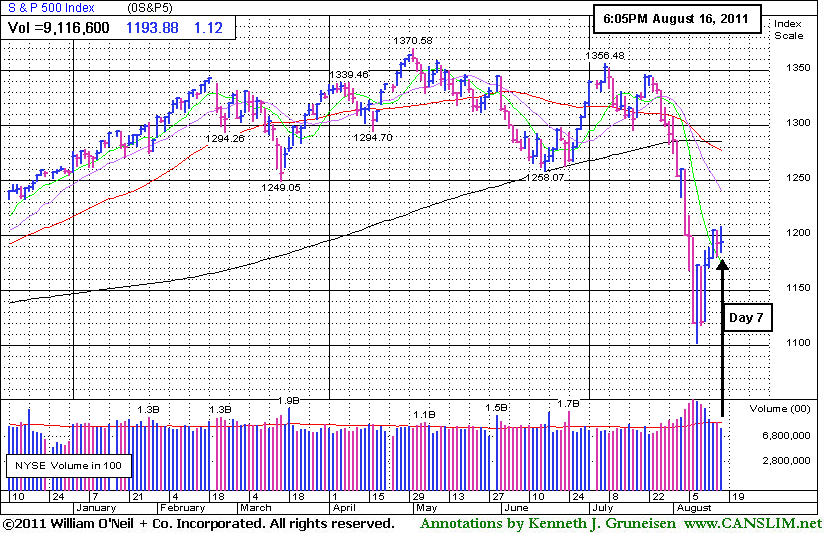
Disciplined investors are maintaining a watchlist and waiting for a new rally confirmed by a solid follow-through day (FTD) before any new buying efforts are considered. A considerable higher-volume gain between Day 4 and Day 7 from at least one of the major averages is the ideal FTD confirmation that institutional buying demand has returned in a meaningful way. A FTD that comes later may still be sufficient confirmation for a new rally, but it may indicate a weaker rally. Watch for an increase in the number of leaders reaching new 52-week highs as an important component of the FTD as well, for any sustained market advance requires a healthy crop of strong leaders hitting new highs. For now, the market environment (M criteria) still argues for investors to remain cautious and preserve cash on the safe sidelines, staying away from potential harm!
The August 2011 issue of CANSLIM.net News will be published soon! Links to all prior reports are available on the Premium Member Homepage.
PICTURED: The S&P 500 Index quietly concluded Day 7 of the current rally attempt, still awaiting a confirming FTD.
|
 Kenneth J. Gruneisen started out as a licensed stockbroker in August 1987, a couple of months prior to the historic stock market crash that took the Dow Jones Industrial Average down -22.6% in a single day. He has published daily fact-based fundamental and technical analysis on high-ranked stocks online for two decades. Through FACTBASEDINVESTING.COM, Kenneth provides educational articles, news, market commentary, and other information regarding proven investment systems that work in good times and bad.
Comments contained in the body of this report are technical opinions only and are not necessarily those of Gruneisen Growth Corp. The material herein has been obtained from sources believed to be reliable and accurate, however, its accuracy and completeness cannot be guaranteed. Our firm, employees, and customers may effect transactions, including transactions contrary to any recommendation herein, or have positions in the securities mentioned herein or options with respect thereto. Any recommendation contained in this report may not be suitable for all investors and it is not to be deemed an offer or solicitation on our part with respect to the purchase or sale of any securities. |
|
 |
Tech and Retail Indexes Fell; Financial and Commodity-Linked Indexes Rose
Kenneth J. Gruneisen - Passed the CAN SLIM® Master's Exam
The Broker/Dealer Index ($XBD +0.48%) and Bank Index ($BKX +0.75%) had a positive bias and the Gold & Silver Index ($XAU +1.07%) was a standout gainer. Energy-related shares also had a positive bias as the Integrated Oil Index ($XOI +0.57%) and Oil Services Index ($OSX +0.65%) finished with small gains. The tech sector was the clear weak sport on Wednesday as the Networking Index ($NWX -1.50%), Internet Index ($IIX -0.99%), Biotechnology Index ($BTK -0.68%), and Semiconductor Index ($SOX -0.65%) ended unanimously lower. The Retail Index ($RLX -0.63%) also suffered a modest loss, meanwhile, the Healthcare Index ($HMO +0.02%) finished flat.
Charts courtesy www.stockcharts.com
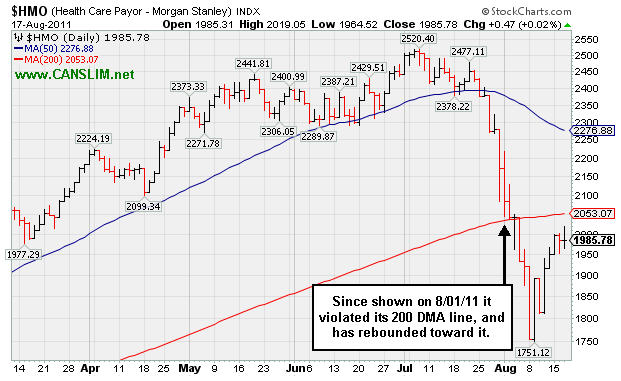
PICTURED: The Healthcare Index ($HMO +0.02%) violated its 200-day moving average (DMA) line since shown on 8/01/11 and slumped well below it. Now it has been rebounding toward that long-term average.
| Oil Services |
$OSX |
237.81 |
+1.54 |
+0.65% |
-2.98% |
| Healthcare |
$HMO |
1,985.78 |
+0.47 |
+0.02% |
+17.36% |
| Integrated Oil |
$XOI |
1,155.31 |
+6.53 |
+0.57% |
-4.77% |
| Semiconductor |
$SOX |
353.10 |
-2.31 |
-0.65% |
-14.26% |
| Networking |
$NWX |
237.99 |
-3.63 |
-1.50% |
-15.17% |
| Internet |
$IIX |
277.49 |
-2.79 |
-0.99% |
-9.83% |
| Broker/Dealer |
$XBD |
91.29 |
+0.44 |
+0.48% |
-24.88% |
| Retail |
$RLX |
492.72 |
-3.11 |
-0.63% |
-3.08% |
| Gold & Silver |
$XAU |
212.52 |
+2.24 |
+1.07% |
-6.21% |
| Bank |
$BKX |
38.74 |
+0.29 |
+0.75% |
-25.80% |
| Biotech |
$BTK |
1,159.94 |
-7.99 |
-0.68% |
-10.61% |
|
|
|
 |
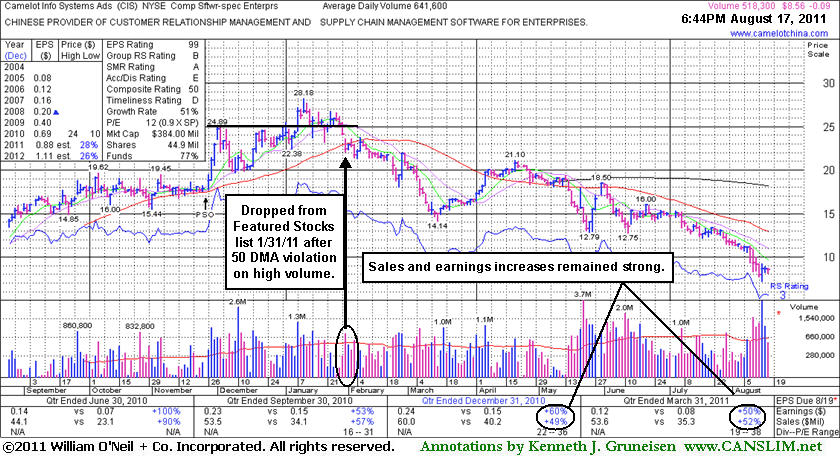
-68% Decline Since Noted When Dropped Less Than 7 Months Ago
Kenneth J. Gruneisen - Passed the CAN SLIM® Master's Exam
When the number of stocks included on the Featured Stocks page is low, and those currently listed have all received recent analysis in this FSU section, we occasionally go back to revisit a previously featured stock that was dropped. Today we will have another look at a stock that was dropped from the Featured Stocks list back on January 31, 2011.
Camelot Info Systems Ads (CIS) was last noted 1/31/2011 5:32 PM "Gapped down today and closed below its 50 DMA line in the lower half of its intra-day range with a considerable loss on above average volume, triggering a technical sell signal. Based on technical damage it will be dropped from the Featured Stocks list tonight." It subsequently reported strong earnings for the period ended March 31, 2011, and it is due to report earnings for the period ended June 30, 2011 in the morning. Disciplined investors know, however, that even if earnings are good, there is a large amount of overhead supply that will act as resistance. Its apparently strong fundamentals failed to prevent a slide from $22.40 to as low as $7.17 this week, a -68% decline from when it was dropped less than 7 months ago. This serves as a vivid reminder to all members that cutting losses whenever any stock falls 7-8% from your purchase price is the best way investors can prevent larger, more damaging losses!
From the stock's Company Profile page members can review all prior notes and analysis, in this case going back to when this Chinese Computer Software firm was first featured at $18.93 in the 11/26/10 mid-day report (read here).
|
|
|
Color Codes Explained :
Y - Better candidates highlighted by our
staff of experts.
G - Previously featured
in past reports as yellow but may no longer be buyable under the
guidelines.
***Last / Change / Volume data in this table is the closing quote data***
Symbol/Exchange
Company Name
Industry Group |
PRICE |
CHANGE
(%Change) |
Day High |
Volume
(% DAV)
(% 50 day avg vol) |
52 Wk Hi
% From Hi |
Featured
Date |
Price
Featured |
Pivot Featured |
|
Max Buy |
EXLS
-
NASDAQ
Exlservice Holdings Inc
DIVERSIFIED SERVICES - Business/Management Services
|
$24.44
|
+0.09
0.37% |
$24.50
|
57,803
69.31% of 50 DAV
50 DAV is 83,400
|
$26.46
-7.63%
|
8/2/2011
|
$24.85
|
PP = $24.85
|
|
MB = $26.09
|
 Most Recent Note - 8/17/2011 5:45:34 PM
Y - Today's quiet gain led to a close matching its May 12th close. Technically, several closes below that old high close negated the recent breakout as it sank into the prior base while consolidating above its 50 DMA line (now $23.36). Deterioration leading to a violation of that important short-term average would raise greater concerns and trigger a technical sell signal.
>>> The latest Featured Stock Update with an annotated graph appeared on 8/15/2011. Click here.
View all notes |
Alert me of new notes |
CANSLIM.net Company Profile |
SEC |
Zacks Reports |
StockTalk |
News |
Chart |
Request a new note
C
A N
S L
I M


|
FCFS
-
NASDAQ
First Cash Financial Svs
SPECIALTY RETAIL - Specialty Retail, Other
|
$44.76
|
-0.49
-1.08% |
$45.66
|
327,432
112.52% of 50 DAV
50 DAV is 291,000
|
$47.80
-6.36%
|
5/31/2011
|
$42.00
|
PP = $40.23
|
|
MB = $42.24
|
Most Recent Note - 8/16/2011 12:24:38 PM
G - Hovering near its 52-week high today after a negative reversal on the prior session broke a streak of 4 consecutive volume-driven gains. Prior chart lows near $37-38 define support to watch above its 200 DMA line.
>>> The latest Featured Stock Update with an annotated graph appeared on 8/9/2011. Click here.
View all notes |
Alert me of new notes |
CANSLIM.net Company Profile |
SEC |
Zacks Reports |
StockTalk |
News |
Chart |
Request a new note
C
A N
S L
I M
|
JCOM
-
NASDAQ
J 2 Global Communication
INTERNET - Internet Software and Services
|
$28.61
|
-0.14
-0.49% |
$29.09
|
185,525
58.47% of 50 DAV
50 DAV is 317,300
|
$31.72
-9.80%
|
8/8/2011
|
$30.38
|
PP = $29.31
|
|
MB = $30.78
|
Most Recent Note - 8/16/2011 1:26:50 PM
G - Quietly slumping near its 50 and 200 DMA lines today, struggling amid a widely negative market (M criteria). Last week it churned a lot of volume without making progress since its 8/03/11 gap up.
>>> The latest Featured Stock Update with an annotated graph appeared on 8/8/2011. Click here.
View all notes |
Alert me of new notes |
CANSLIM.net Company Profile |
SEC |
Zacks Reports |
StockTalk |
News |
Chart |
Request a new note
C
A N
S L
I M
|
MA
-
NYSE
Mastercard Inc Cl A
DIVERSIFIED SERVICES - Business/Management Services
|
$326.22
|
-8.78
-2.62% |
$337.54
|
1,469,124
99.10% of 50 DAV
50 DAV is 1,482,400
|
$340.42
-4.17%
|
8/3/2011
|
$324.82
|
PP = $322.38
|
|
MB = $338.50
|
Most Recent Note - 8/17/2011 3:32:07 PM
Y - Color code is changed to yellow, however the M criteria and recent volatility are a reminder to be cautious. Pulling back today, yet hovering -4.2% off its 8/03/11 all-time high, consolidating above the previously cited pivot point.
>>> The latest Featured Stock Update with an annotated graph appeared on 8/16/2011. Click here.
View all notes |
Alert me of new notes |
CANSLIM.net Company Profile |
SEC |
Zacks Reports |
StockTalk |
News |
Chart |
Request a new note
C
A N
S L
I M
|
MG
-
NYSE
Mistras Group Inc
DIVERSIFIED SERVICES - Bulding and Faci;ity Management Services
|
$19.44
|
+0.09
0.47% |
$19.71
|
135,016
101.82% of 50 DAV
50 DAV is 132,600
|
$19.85
-2.07%
|
8/10/2011
|
$17.89
|
PP = $17.58
|
|
MB = $18.46
|
Most Recent Note - 8/15/2011 12:16:00 PM
G - Hit another new 52-week high with today's 5th consecutive gain backed by above average volume. It is extended from its prior base, and previous resistance in the $17-18 area now defines important chart support to watch on pullbacks.
>>> The latest Featured Stock Update with an annotated graph appeared on 8/11/2011. Click here.
View all notes |
Alert me of new notes |
CANSLIM.net Company Profile |
SEC |
Zacks Reports |
StockTalk |
News |
Chart |
Request a new note
C
A N
S L
I M
|
Symbol/Exchange
Company Name
Industry Group |
PRICE |
CHANGE
(%Change) |
Day High |
Volume
(% DAV)
(% 50 day avg vol) |
52 Wk Hi
% From Hi |
Featured
Date |
Price
Featured |
Pivot Featured |
|
Max Buy |
MKTX
-
NASDAQ
Marketaxess Holdings Inc
FINANCIAL SERVICES - Investment Brokerage - Nationa
|
$27.45
|
+3.40
14.14% |
$30.25
|
2,213,687
1,384.42% of 50 DAV
50 DAV is 159,900
|
$27.21
0.88%
|
7/29/2011
|
$25.87
|
PP = $26.35
|
|
MB = $27.67
|
Most Recent Note - 8/17/2011 12:16:41 PM
G - Gapped up today for a considerable gain with heavy volume, hitting a new 52-week high on news this operator of an electronic trading system for fixed-income securities is exploring a sale of the company.
>>> The latest Featured Stock Update with an annotated graph appeared on 8/10/2011. Click here.
View all notes |
Alert me of new notes |
CANSLIM.net Company Profile |
SEC |
Zacks Reports |
StockTalk |
News |
Chart |
Request a new note
C
A N
S L
I M
|
PCLN
-
NASDAQ
Priceline.Com Inc
INTERNET - Internet Software and Services
|
$491.85
|
-5.47
-1.10% |
$505.51
|
1,017,878
85.54% of 50 DAV
50 DAV is 1,190,000
|
$561.88
-12.46%
|
7/29/2011
|
$539.46
|
PP = $552.15
|
|
MB = $579.76
|
Most Recent Note - 8/16/2011 1:21:40 PM
G - Down today with higher volume, slumping back under its 50 DMA line. The 200 DMA line and recent chart lows define the next important support to watch.
>>> The latest Featured Stock Update with an annotated graph appeared on 8/12/2011. Click here.
View all notes |
Alert me of new notes |
CANSLIM.net Company Profile |
SEC |
Zacks Reports |
StockTalk |
News |
Chart |
Request a new note
C
A N
S L
I M
|
|
|
|
THESE ARE NOT BUY RECOMMENDATIONS!
Comments contained in the body of this report are technical
opinions only. The material herein has been obtained
from sources believed to be reliable and accurate, however,
its accuracy and completeness cannot be guaranteed.
This site is not an investment advisor, hence it does
not endorse or recommend any securities or other investments.
Any recommendation contained in this report may not
be suitable for all investors and it is not to be deemed
an offer or solicitation on our part with respect to
the purchase or sale of any securities. All trademarks,
service marks and trade names appearing in this report
are the property of their respective owners, and are
likewise used for identification purposes only.
This report is a service available
only to active Paid Premium Members.
You may opt-out of receiving report notifications
at any time. Questions or comments may be submitted
by writing to Premium Membership Services 665 S.E. 10 Street, Suite 201 Deerfield Beach, FL 33441-5634 or by calling 1-800-965-8307
or 954-785-1121.
|
|
|

