You are not logged in.
This means you
CAN ONLY VIEW reports that were published prior to Monday, April 14, 2025.
You
MUST UPGRADE YOUR MEMBERSHIP if you want to see any current reports.
AFTER MARKET UPDATE - WEDNESDAY, AUGUST 10TH, 2011
Previous After Market Report Next After Market Report >>>
|
|
|
|
DOW |
-519.83 |
10,719.94 |
-4.62% |
|
Volume |
2,147,209,690 |
-11% |
|
Volume |
3,319,736,500 |
-11% |
|
NASDAQ |
-101.47 |
2,381.05 |
-4.09% |
|
Advancers |
803 |
26% |
|
Advancers |
507 |
19% |
|
S&P 500 |
-51.77 |
1,120.76 |
-4.42% |
|
Decliners |
2,303 |
73% |
|
Decliners |
2,128 |
79% |
|
Russell 2000 |
-35.95 |
660.21 |
-5.16% |
|
52 Wk Highs |
3 |
|
|
52 Wk Highs |
6 |
|
|
S&P 600 |
-18.75 |
360.43 |
-4.94% |
|
52 Wk Lows |
221 |
|
|
52 Wk Lows |
232 |
|
|
 |
Market's Poison Remains the Financial Group
Kenneth J. Gruneisen - Passed the CAN SLIM® Master's Exam
Volume totals remained well above average on both exchanges but cooled from the prior session totals on the NYSE and on the Nasdaq exchange. Declining issues led advancing issues by nearly 3-1 on the NYSE and by more than 4-1 on the Nasdaq exchange. New 52-week lows substantially outnumbered new 52-week highs on the NYSE and on the Nasdaq exchange, and the new highs totals were again in the single digits on both exchanges. There were only 3 high-ranked companies from the CANSLIM.net Leaders List that made new 52-week highs and appeared on the CANSLIM.net BreakOuts Page, up from the prior total of 2 stocks. Only 2 of the 7 high-ranked leaders currently included on the Featured Stocks Page posted gains, and the number of most ideal stocks included on that page has been cut considerably due to the poor market (M criteria) action noted of late.
On Tuesday the Federal Reserve Board acknowledged that economic growth has been considerably slower than anticipated, and promised to keep interest rates at a record low at least until mid-2013. Many noted that it was the first time we have seen any specific time-frame from the Fed concerning its rate policy.
With investor confidence fragile, fears about European debt took the spotlight, leading to a sharp sell-off that accelerated in the final hour. France's top credit rating was affirmed by the major credit agencies, but that was not enough to persuade the markets that the country might be next in line, after the United States, to lose the Triple-A designation. European banks took major hits, and major U.S. banks, including Citigroup Inc (C -10.5%), were punished as well. Bank of America Corp (BAC -10.9%) dove lower even though the chief executive said he is comfortable with the company's capital. The Walt Disney Co (DIS -9.1%) suffered its largest loss since 2009 after reporting that TV advertising sales declined in the last quarter.
Gold prices closed at a record high for a third straight day, and 4 gold-related companies from the Leaders List met the screening parameters to be noted in the Mid-Day Report, although shortcomings were noted in each. Oil closed up more than $3 per barrel following an unexpected decline in U.S. stockpiles. The 10-year Treasury note rose a full point to yield 2.08%. The 2.25% dividend yield of S&P 500 companies topped the yield of 10-year notes for the first time in two years.
The current market correction leaves disciplined investors in a defensive stance, looking toward protecting capital rather than adding more market exposure. A new rally confirmed by a solid follow-through day (FTD) would be an important reassurance worth waiting for before new buying efforts may be justified. Disciplined investors will watch for a considerable higher-volume gain between Day 4 and Day 7 to provide a confirmation that institutional buying demand has returned in a meaningful way concerning the market environment (M criteria). The August 2011 issue of CANSLIM.net News will be published soon! Links to all prior reports are available on the Premium Member Homepage.
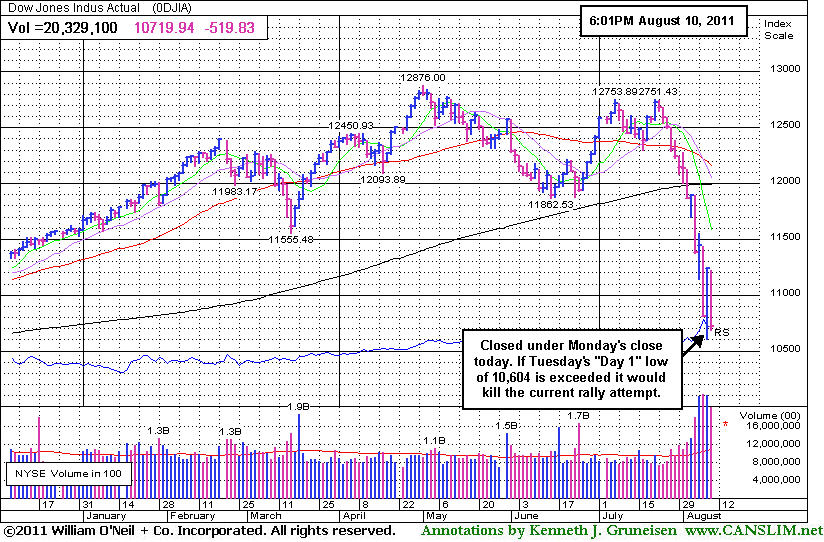
PICTURED: The Dow Jones Industrial Average finished below Monday's close on Wednesday's session, meanwhile the S&P 500 Index and Nasdaq Composite Index avoided doing the same. Provided that the Tuesday afternoon lows are not exceeded, that day can still be considered Day 1 of a nascent new rally attempt.
|
 Kenneth J. Gruneisen started out as a licensed stockbroker in August 1987, a couple of months prior to the historic stock market crash that took the Dow Jones Industrial Average down -22.6% in a single day. He has published daily fact-based fundamental and technical analysis on high-ranked stocks online for two decades. Through FACTBASEDINVESTING.COM, Kenneth provides educational articles, news, market commentary, and other information regarding proven investment systems that work in good times and bad.
Comments contained in the body of this report are technical opinions only and are not necessarily those of Gruneisen Growth Corp. The material herein has been obtained from sources believed to be reliable and accurate, however, its accuracy and completeness cannot be guaranteed. Our firm, employees, and customers may effect transactions, including transactions contrary to any recommendation herein, or have positions in the securities mentioned herein or options with respect thereto. Any recommendation contained in this report may not be suitable for all investors and it is not to be deemed an offer or solicitation on our part with respect to the purchase or sale of any securities. |
|
 |
Gold Gains Amid Widespread Weakness
Kenneth J. Gruneisen - Passed the CAN SLIM® Master's Exam
The Bank Index ($BKX -8.21%) and Broker/Dealer Index ($XBD -7.43%) dove to new 2011 lows, proving that the influential financial groups are lacking any backbone. The tech sector saw across the board losses from the Biotechnology Index ($BTK -5.27%), Networking Index ($NWX -5.19%), Internet Index ($IIX -4.11%), and Semiconductor Index ($SOX -2.06%). Energy-related stocks were also down hard as the Integrated Oil Index ($XOI -3.56%) and Oil Services Index ($OSX -3.47%) lost ground. The Retail Index ($RLX -4.44%) and the Healthcare Index ($HMO -4.06%) had a negative bias too.
Charts courtesy www.stockcharts.com
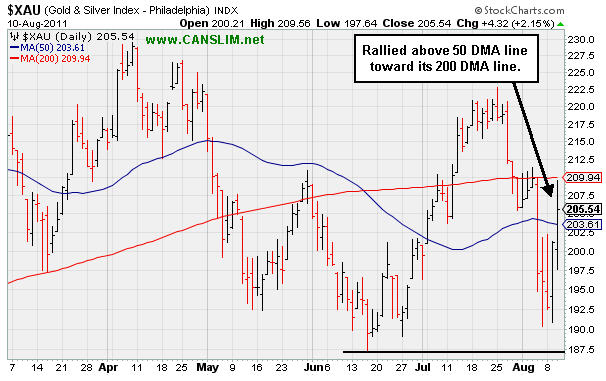
PICTURED: The Gold & Silver Index ($XAU +2.15%) was a standout gainer as it rose above its 50-day moving average (DMA) line but remained under its longer-term 200 DMA line and below prior highs.
| Oil Services |
$OSX |
219.13 |
-7.87 |
-3.47% |
-10.60% |
| Healthcare |
$HMO |
1,815.28 |
-76.80 |
-4.06% |
+7.29% |
| Integrated Oil |
$XOI |
1,062.76 |
-39.24 |
-3.56% |
-12.40% |
| Semiconductor |
$SOX |
339.54 |
-7.15 |
-2.06% |
-17.55% |
| Networking |
$NWX |
219.54 |
-12.01 |
-5.19% |
-21.75% |
| Internet |
$IIX |
264.50 |
-11.35 |
-4.11% |
-14.05% |
| Broker/Dealer |
$XBD |
84.97 |
-6.82 |
-7.43% |
-30.07% |
| Retail |
$RLX |
465.90 |
-21.65 |
-4.44% |
-8.36% |
| Gold & Silver |
$XAU |
205.54 |
+4.32 |
+2.15% |
-9.29% |
| Bank |
$BKX |
36.33 |
-3.25 |
-8.21% |
-30.42% |
| Biotech |
$BTK |
1,062.92 |
-59.15 |
-5.27% |
-18.09% |
|
|
|
 |
Distributional Action Followed Half-Hearted Breakout Attempt
Kenneth J. Gruneisen - Passed the CAN SLIM® Master's Exam
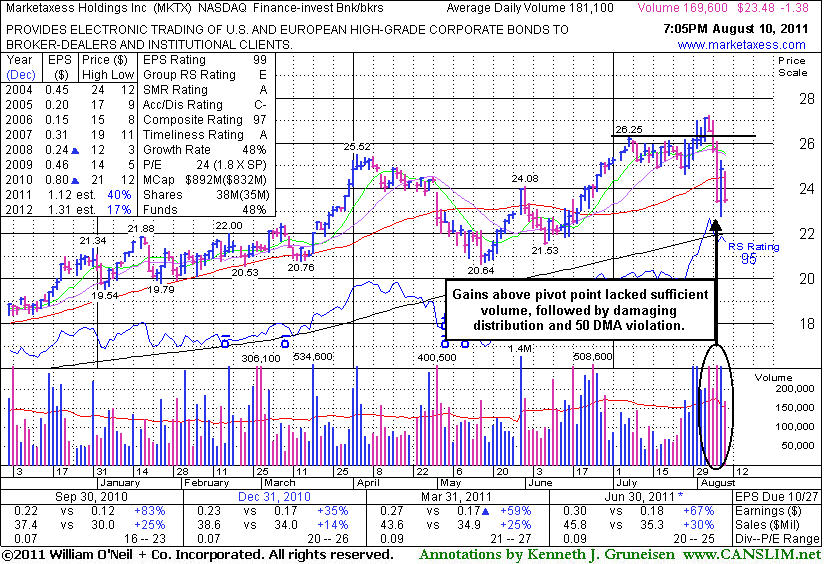
Marketaxess Holdings Inc (MKTX -$1.38 or -5.55% to $23.48) slumped under its 50-day moving average (DMA) line again today on lighter volume, and that short-term average may now act as resistance. Its color code was changed to green, and as previously noted, healthy stocks do not often dip -7% below their pivot point. No overhead supply was there to hinder its progress, but damaging distribution has been hurting its chances of making meaningful headway, meanwhile the M criteria has also been arguing against new buying efforts.
Its last appearance was in this FSU section on 7/29/11 with an annotated graph under the headline, "Potential Candidate in Tight Consolidation After Cup", and on 8/01/11 it posted a small gain after churning heavy volume and touching a new 52-week high, but didn't clear its pivot point. On 8/03/11 it posted a solid gain today for a new high with only +25% above average volume, below the volume threshold for a proper technical buy signal. Damaging distributional losses then followed and were noted. All prior notes can be reviewed on the Company Profile page under the "View All Notes" tab. The "Featured Articles and Daily Graphs" tab on the Company Profile page allows members to view all of the previous detailed analysis and annotated graphs published on any stocks we have covered.
MKTX has earned high ranks and reasonably satisfies the guidelines concerning quarterly and annual earnings (C and A criteria), however a downturn in FY '08 was previously noted as a flaw. Additionally, the Finance - Investment Bankers industry group currently has a Relative Strength rating of E which indicates the group has been a poor performer rather than a strong leader (L criteria).
The number of top-rated funds owning its shares rose from 195 in Dec '10 to 227 in Jun '11, a reassuring sign concerning the I criteria. Fresh proof of heavy buying demand would be no guarantee it can mount a sustained rally for meaningful gains, but for now this high-ranked leader would need to first rebound above its 50 DMA line and stay there for its outlook to improve as an ideal candidate.
 |
|
|
Color Codes Explained :
Y - Better candidates highlighted by our
staff of experts.
G - Previously featured
in past reports as yellow but may no longer be buyable under the
guidelines.
***Last / Change / Volume data in this table is the closing quote data***
Symbol/Exchange
Company Name
Industry Group |
PRICE |
CHANGE
(%Change) |
Day High |
Volume
(% DAV)
(% 50 day avg vol) |
52 Wk Hi
% From Hi |
Featured
Date |
Price
Featured |
Pivot Featured |
|
Max Buy |
EXLS
-
NASDAQ
Exlservice Holdings Inc
DIVERSIFIED SERVICES - Business/Management Services
|
$24.48
|
-1.27
-4.93% |
$25.97
|
137,783
176.42% of 50 DAV
50 DAV is 78,100
|
$26.46
-7.48%
|
8/2/2011
|
$24.85
|
PP = $24.85
|
|
MB = $26.09
|
 Most Recent Note - 8/10/2011 7:32:48 PM
Y - Damaging loss today with above average volume led to a close below its pivot point raising some concerns. Its 50 DMA line (now $23.22) defines important support to watch.
>>> The latest Featured Stock Update with an annotated graph appeared on 8/2/2011. Click here.
View all notes |
Alert me of new notes |
CANSLIM.net Company Profile |
SEC |
Zacks Reports |
StockTalk |
News |
Chart |
Request a new note
C
A N
S L
I M


|
FCFS
-
NASDAQ
First Cash Financial Svs
SPECIALTY RETAIL - Specialty Retail, Other
|
$42.38
|
+0.94
2.27% |
$43.32
|
802,047
305.43% of 50 DAV
50 DAV is 262,600
|
$46.42
-8.70%
|
5/31/2011
|
$42.00
|
PP = $40.23
|
|
MB = $42.24
|
Most Recent Note - 8/10/2011 7:34:37 PM
G - Posted a second consecutive volume-driven gain today as it rallied back promptly above its 50 DMA line after 2 damaging losses. The prior chart lows near $37-38 define support to watch now above its 200 DMA line.
>>> The latest Featured Stock Update with an annotated graph appeared on 8/9/2011. Click here.
View all notes |
Alert me of new notes |
CANSLIM.net Company Profile |
SEC |
Zacks Reports |
StockTalk |
News |
Chart |
Request a new note
C
A N
S L
I M
|
JCOM
-
NASDAQ
J 2 Global Communication
INTERNET - Internet Software and Services
|
$27.95
|
-1.39
-4.74% |
$28.95
|
499,567
160.53% of 50 DAV
50 DAV is 311,200
|
$31.72
-11.89%
|
8/8/2011
|
$30.38
|
PP = $29.31
|
|
MB = $30.78
|
Most Recent Note - 8/10/2011 7:41:08 PM
G - Slumped below its 50 and 200 DMA lines again today, raising concerns. Color code is changed to green.
>>> The latest Featured Stock Update with an annotated graph appeared on 8/8/2011. Click here.
View all notes |
Alert me of new notes |
CANSLIM.net Company Profile |
SEC |
Zacks Reports |
StockTalk |
News |
Chart |
Request a new note
C
A N
S L
I M
|
MA
-
NYSE
Mastercard Inc Cl A
DIVERSIFIED SERVICES - Business/Management Services
|
$303.71
|
-19.10
-5.92% |
$321.20
|
2,981,770
217.20% of 50 DAV
50 DAV is 1,372,800
|
$340.42
-10.78%
|
8/3/2011
|
$324.82
|
PP = $322.38
|
|
MB = $338.50
|
Most Recent Note - 8/10/2011 7:44:49 PM
G - Considerable loss today with volume conviction hurt its outlook again as it slumped below its pivot point. Color code is changed to green after negating the powerful technical breakout. Wider than usual intra-day price swings indicate uncertainty, plus the M criteria remains a concern until a new confirmed rally is noted.
>>> The latest Featured Stock Update with an annotated graph appeared on 8/3/2011. Click here.
View all notes |
Alert me of new notes |
CANSLIM.net Company Profile |
SEC |
Zacks Reports |
StockTalk |
News |
Chart |
Request a new note
C
A N
S L
I M
|
MG
-
NYSE
Mistras Group Inc
DIVERSIFIED SERVICES - Bulding and Faci;ity Management Services
|
$17.69
|
+1.56
9.67% |
$18.31
|
974,503
947.04% of 50 DAV
50 DAV is 102,900
|
$18.46
-4.17%
|
8/10/2011
|
$17.89
|
PP = $17.58
|
|
MB = $18.46
|
Most Recent Note - 8/10/2011 7:47:38 PM
Y - Finished the session above the pivot point cited in the mid-day report today as its color code was changed to yellow with new pivot point cited based on its 8/01/11 high plus 10 cents. Its considerable gain was driven by heavy volume, rallying from a base formed since the previously noted Public Offering on 5/05/11. It found support well above its 200 DMA line after it was dropped from the Featured Stocks list on 6/14/11. It faces very little resistance due to overhead supply up to its 52-week high. Its Accumulation/Distribution rating of E (see red circle) is a concern, however the number of top-rated funds owning its shares rose from 99 in Sep '10 to 147 in Jun '11, a reassuring sign concerning the I criteria. The M criteria still argues against new buying efforts, and disciplined investors know that.

>>> The latest Featured Stock Update with an annotated graph appeared on 5/12/2011. Click here.
View all notes |
Alert me of new notes |
CANSLIM.net Company Profile |
SEC |
Zacks Reports |
StockTalk |
News |
Chart |
Request a new note
C
A N
S L
I M
|
Symbol/Exchange
Company Name
Industry Group |
PRICE |
CHANGE
(%Change) |
Day High |
Volume
(% DAV)
(% 50 day avg vol) |
52 Wk Hi
% From Hi |
Featured
Date |
Price
Featured |
Pivot Featured |
|
Max Buy |
MKTX
-
NASDAQ
Marketaxess Holdings Inc
FINANCIAL SERVICES - Investment Brokerage - Nationa
|
$23.48
|
-1.38
-5.55% |
$24.74
|
176,570
97.50% of 50 DAV
50 DAV is 181,100
|
$27.21
-13.71%
|
7/29/2011
|
$25.87
|
PP = $26.35
|
|
MB = $27.67
|
Most Recent Note - 8/10/2011 7:48:41 PM
G - Slumped under its 50 DMA line again today on lighter volume, and that short-term average may now act as resistance. Color code was changed to green, and as previously noted, healthy stocks do not often dip -7% below their pivot point. The M criteria also argues against new buying efforts for now. See the latest FSU analysis for more details and a new annotated graph.
>>> The latest Featured Stock Update with an annotated graph appeared on 8/10/2011. Click here.
View all notes |
Alert me of new notes |
CANSLIM.net Company Profile |
SEC |
Zacks Reports |
StockTalk |
News |
Chart |
Request a new note
C
A N
S L
I M
|
PCLN
-
NASDAQ
Priceline.Com Inc
INTERNET - Internet Software and Services
|
$498.80
|
-18.62
-3.60% |
$512.95
|
2,170,105
194.07% of 50 DAV
50 DAV is 1,118,200
|
$561.88
-11.23%
|
7/29/2011
|
$539.46
|
PP = $552.15
|
|
MB = $579.76
|
Most Recent Note - 8/10/2011 7:50:07 PM
G - Down again today with above average volume, slumping under its 50 DMA line, raising concerns. The M criteria overrides all other promising criteria, since 3 out of 4 stocks follow the direction of the major averages.
>>> The latest Featured Stock Update with an annotated graph appeared on 8/1/2011. Click here.
View all notes |
Alert me of new notes |
CANSLIM.net Company Profile |
SEC |
Zacks Reports |
StockTalk |
News |
Chart |
Request a new note
C
A N
S L
I M
|
|
 |
| Subscriber Questions: |
August 7, 2011 |
Dear Ken,
A few years ago I read the book, subscribed to the paper, and flew to Denver to attend one of his seminars. While I am convinced that the approach would work, I did not have the time to screen the stocks, or develop the expertise to use it effectively, and after a while, gave up. I recently became interested again, and your service would seem to be just the kind of thing I would need. However, I have a question. It was my understanding that one of the main tenets of the approach is that you put your money on the sidelines in Bear markets. How is your internet service able to continue to make recommendations during these downturns if that is so? I just wanted to try to understand this before subscribing.
Thanks,
J. Davis |
| Ken's Response: |
August 8,2011
|
Dear Robert,
Thanks for the feedback concerning the service. I would like to hear more about how you have been doing, since you are familiar with the investment system through your exposure years ago. If you have a "hands on" approach to your investments with limited time, we can help you. The reports we publish are akin to the Cliff's Notes, as we condense the daily market action and narrow the wide spectrum of candidates down to the most actionable few while also calling attention to key criteria and pinpointing buy and sell signals.
To your point about downward trending markets and how we can be of help to you, our daily commentary discusses the M criteria to keep members who read it aware. We make BOLD announcements concerning key changes in overall direction per the fact-based analysis which is our specialty. When we highlight specific candidates in a favorable light, but an unfavorable market, we make reminders to all in the notes that even when they are considering the most favorable stocks - "The M criteria overrides all other promising criteria, since 3 out of 4 stocks follow the direction of the major averages."
Recommendations is a dirty word around here. The site is not an advisory firm and we do not know enough about our visitors' risk tolerance to make any buy or sell recommendations. We discuss technical buy signals and sell signals, however it is up to you to evaluate and decide on your own what course of action suits you best. We suggest following the rules as discussed in the book "How To Make Money In Stocks". Our aim is to make the day-to-day job of following the system easier by reducing your workload. If you review the sample reports we gladly make accessible you will see exactly what we provide, and you can note the disclaimers. VIEW REAL SAMPLES OF THE ACTUAL REPORTS UPGRADED MEMBERS RECEIVED (Reports published 6-months earlier can be viewed at no cost! VIEW ARCHIVES FOR: 2006 2007 2008 2009 2010 2011 2012 2013 2014 2015
Here is the typical disclaimer we include -
THESE ARE NOT BUY RECOMMENDATIONS! Comments contained in the body of this report are technical opinions only. The material herein has been obtained from sources believed to be reliable and accurate, however, its accuracy and completeness cannot be guaranteed. This website is not an investment advisor, hence it does not endorse or recommend any securities or other investments. Any recommendation contained in this report may not be suitable for all investors and it is not to be deemed an offer or solicitation on our part with respect to the purchase or sale of any securities. All trademarks, service marks and trade names appearing in this report are the property of their respective owners, and are likewise used for identification purposes only.
I hope this answer is helpful to you. Please review the site terms and conditions if you have any other questions or concerns. You can contact me directly if necessary for further details.Feel free get in touch with me directly if there are any other questions or concerns regarding the service.
Best regards,
Kenneth J. Gruneisen
|
|
|
|
THESE ARE NOT BUY RECOMMENDATIONS!
Comments contained in the body of this report are technical
opinions only. The material herein has been obtained
from sources believed to be reliable and accurate, however,
its accuracy and completeness cannot be guaranteed.
This site is not an investment advisor, hence it does
not endorse or recommend any securities or other investments.
Any recommendation contained in this report may not
be suitable for all investors and it is not to be deemed
an offer or solicitation on our part with respect to
the purchase or sale of any securities. All trademarks,
service marks and trade names appearing in this report
are the property of their respective owners, and are
likewise used for identification purposes only.
This report is a service available
only to active Paid Premium Members.
You may opt-out of receiving report notifications
at any time. Questions or comments may be submitted
by writing to Premium Membership Services 665 S.E. 10 Street, Suite 201 Deerfield Beach, FL 33441-5634 or by calling 1-800-965-8307
or 954-785-1121.
|
|
|

